- Agents
- Essentials
- Getting Started
- Agent
- API
- APM Tracing
- Containers
- Dashboards
- Database Monitoring
- Datadog
- Datadog Site
- DevSecOps
- Incident Management
- Integrations
- Internal Developer Portal
- Logs
- Monitors
- Notebooks
- OpenTelemetry
- Profiler
- Search
- Session Replay
- Security
- Serverless for AWS Lambda
- Software Delivery
- Synthetic Monitoring and Testing
- Tags
- Workflow Automation
- Learning Center
- Support
- Glossary
- Standard Attributes
- Guides
- Agent
- Integrations
- Extend Datadog
- Authorization
- DogStatsD
- Custom Checks
- Integrations
- Build an Integration with Datadog
- Create an Agent-based Integration
- Create an API-based Integration
- Create a Log Pipeline
- Integration Assets Reference
- Build a Marketplace Offering
- Create an Integration Dashboard
- Create a Monitor Template
- Create a Cloud SIEM Detection Rule
- Install Agent Integration Developer Tool
- Service Checks
- Community
- Guides
- OpenTelemetry
- Administrator's Guide
- API
- Partners
- Datadog Mobile App
- DDSQL Reference
- CoScreen
- CoTerm
- Remote Configuration
- Cloudcraft (Standalone)
- In The App
- Dashboards
- Notebooks
- DDSQL Editor
- Reference Tables
- Sheets
- Monitors and Alerting
- Service Level Objectives
- Metrics
- Watchdog
- Bits AI
- Internal Developer Portal
- Error Tracking
- Change Tracking
- Event Management
- Incident Response
- Actions & Remediations
- Infrastructure
- Cloudcraft
- Resource Catalog
- Universal Service Monitoring
- End User Device Monitoring
- Hosts
- Containers
- Processes
- Serverless
- Network Monitoring
- Storage Management
- Cloud Cost
- Application Performance
- APM
- Continuous Profiler
- Database Monitoring
- Agent Integration Overhead
- Setup Architectures
- Setting Up Postgres
- Setting Up MySQL
- Setting Up SQL Server
- Setting Up Oracle
- Setting Up Amazon DocumentDB
- Setting Up MongoDB
- Setting Up ClickHouse
- Connecting DBM and Traces
- Data Collected
- Exploring Database Hosts
- Exploring Query Metrics
- Exploring Query Samples
- Exploring Database Schemas
- Exploring Recommendations
- Troubleshooting
- Guides
- Data Streams Monitoring
- Data Observability
- Digital Experience
- Real User Monitoring
- Synthetic Testing and Monitoring
- Continuous Testing
- Experiments
- Product Analytics
- Session Replay
- Software Delivery
- CI Visibility
- CD Visibility
- Deployment Gates
- Test Optimization
- Code Coverage
- PR Gates
- DORA Metrics
- Feature Flags
- Developer Integrations
- Security
- Security Overview
- Cloud SIEM
- Code Security
- Cloud Security
- App and API Protection
- AI Guard
- Workload Protection
- Sensitive Data Scanner
- AI Observability
- Log Management
- Observability Pipelines
- Configuration
- Sources
- Processors
- Destinations
- Amazon OpenSearch
- Amazon S3
- Amazon Security Lake
- Azure Storage
- CrowdStrike NG-SIEM
- Datadog Archives
- Datadog CloudPrem
- Datadog Logs
- Datadog Metrics
- Elasticsearch
- Google Cloud Storage
- Google Pub/Sub
- Google SecOps
- HTTP Client
- Kafka
- Microsoft Sentinel
- New Relic
- OpenSearch
- SentinelOne
- Socket
- Splunk HEC
- Sumo Logic Hosted Collector
- Syslog
- Packs
- Akamai CDN
- Amazon CloudFront
- Amazon VPC Flow Logs
- AWS Application Load Balancer Logs
- AWS CloudTrail
- AWS Elastic Load Balancer Logs
- AWS Network Load Balancer Logs
- Cisco ASA
- Cloudflare
- F5
- Fastly
- Fortinet Firewall
- HAProxy Ingress
- Istio Proxy
- Juniper SRX Firewall Traffic Logs
- Netskope
- NGINX
- Okta
- Palo Alto Firewall
- Windows XML
- ZScaler ZIA DNS
- Zscaler ZIA Firewall
- Zscaler ZIA Tunnel
- Zscaler ZIA Web Logs
- Search Syntax
- Scaling and Performance
- Monitoring and Troubleshooting
- Guides and Resources
- Log Management
- CloudPrem
- Administration
Metrics Summary
Overview
The Metrics Summary page displays a list of your metrics reported to Datadog under a specified time frame: the past hour, day, or week.
Search your metrics by metric name or tag using the Metric or Tag search fields:
Note: Tag values are retained in the Tag search field for 28 hours. Values not submitted in the past 28 hours do not appear as search options, even if they remain visible in the metric details side panel.
You can also discover relevant metrics using enhanced fuzzy matching support in the Metrics search field:
Tag filtering supports Boolean and wildcard syntax so that you can identify:
- Metrics that are tagged with a particular tag key, for example,
team:team:* - Metrics that are missing a particular tag key, for example,
team:NOT team:*
Facet panel
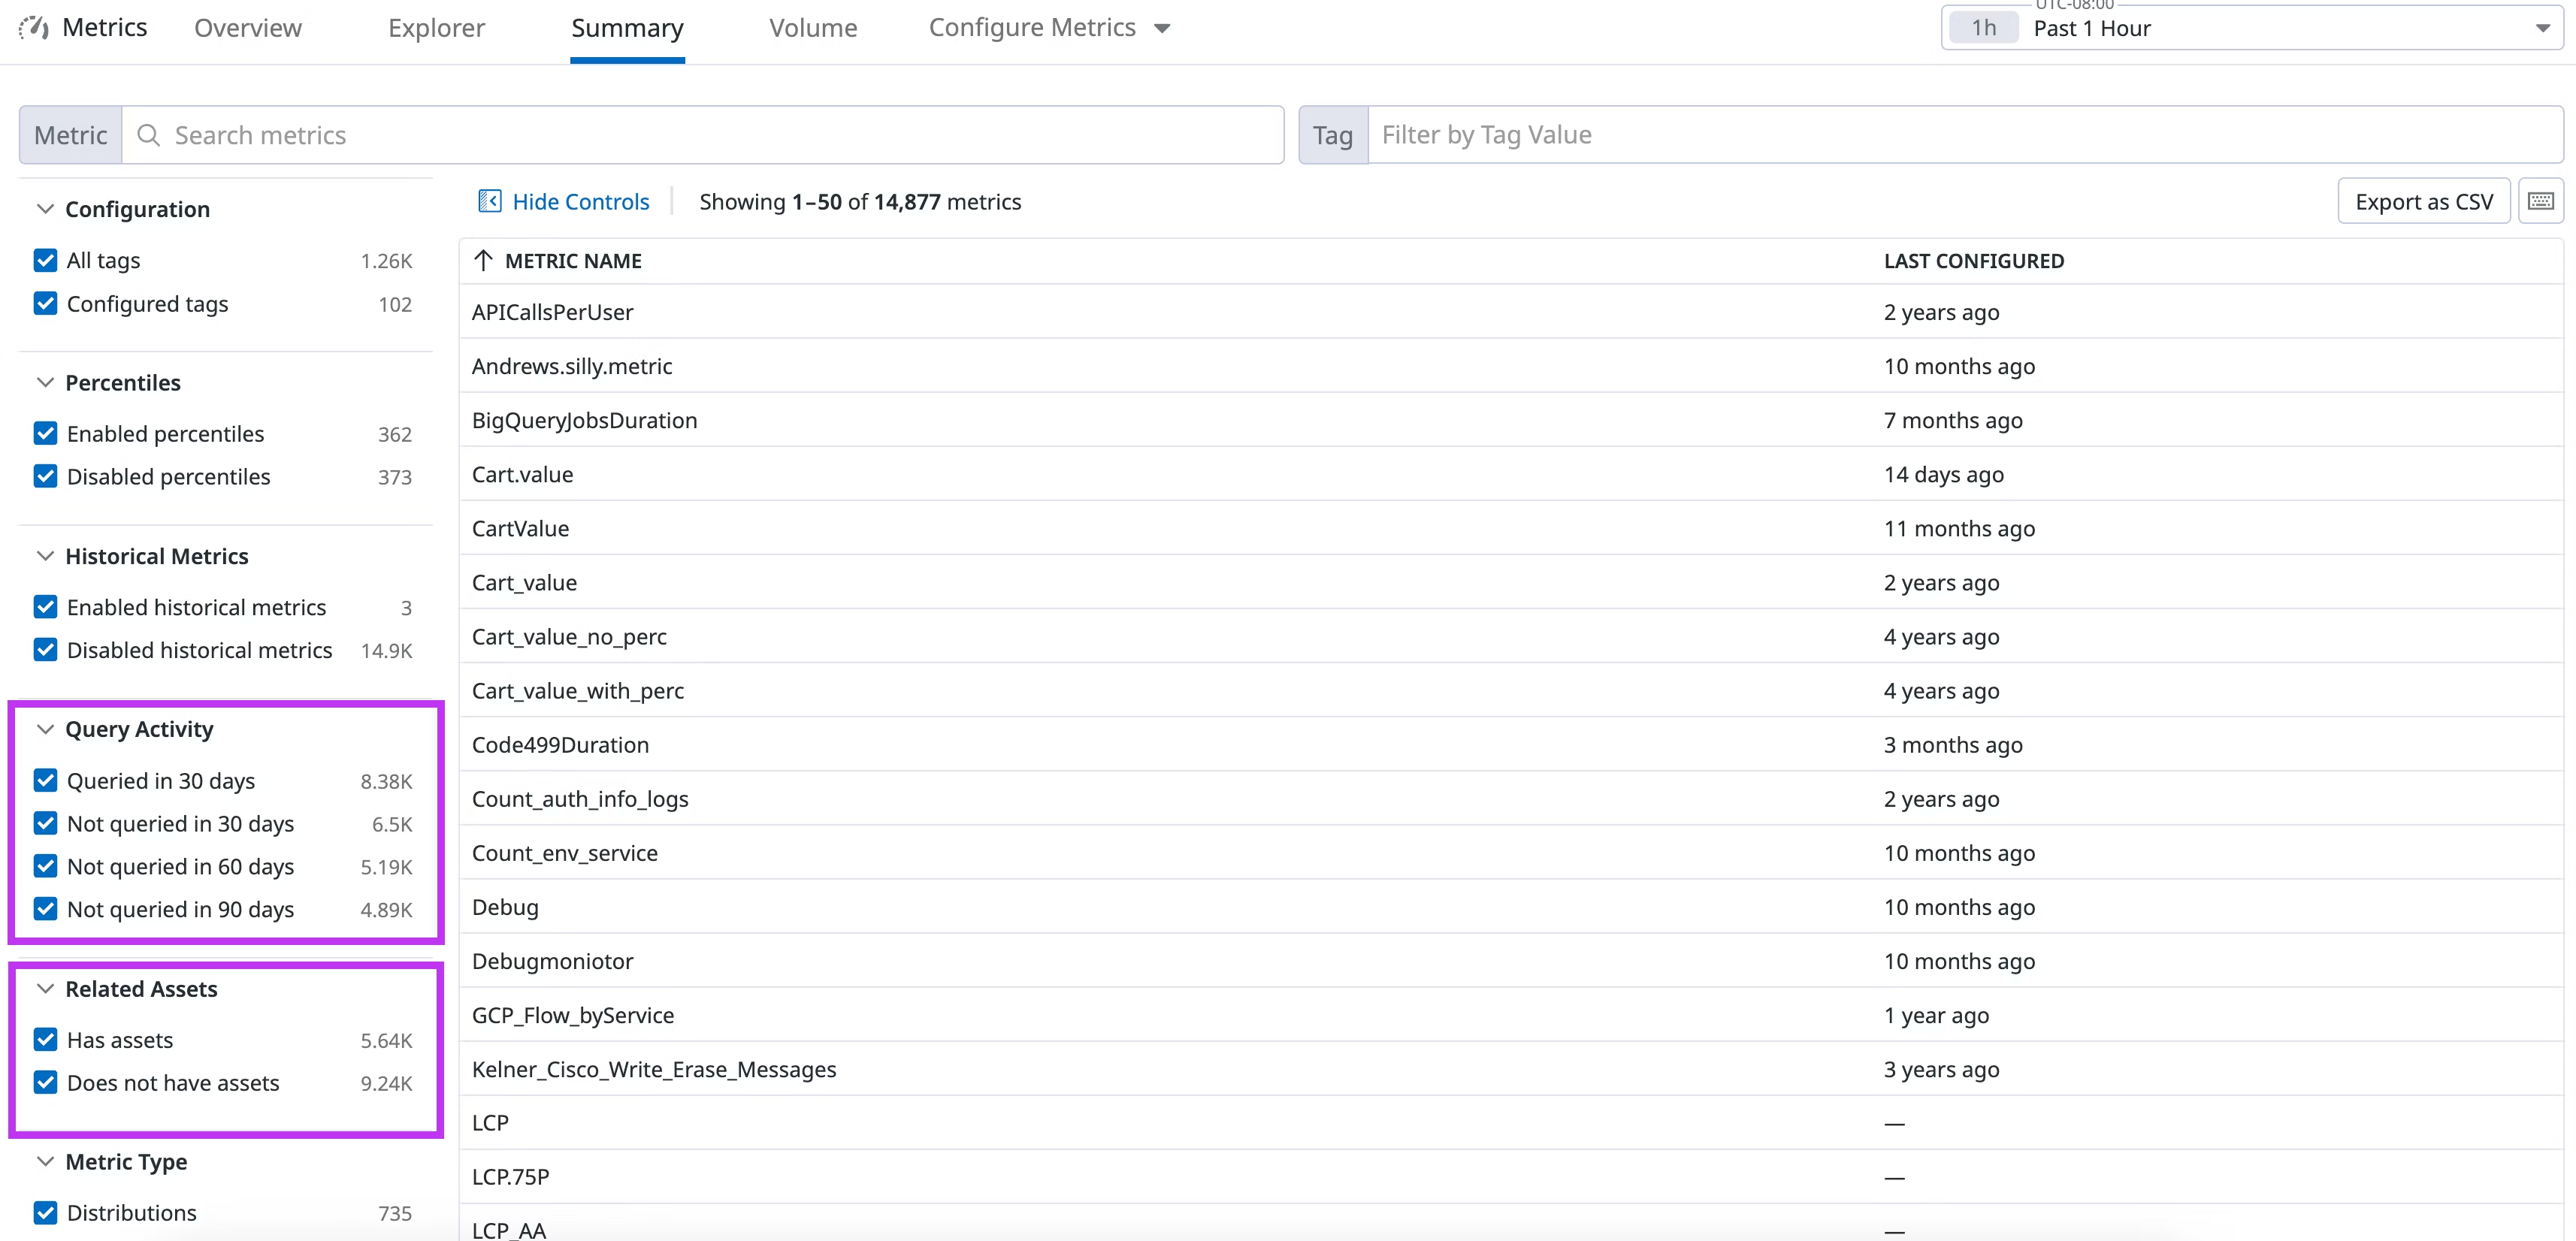
The search bars provide the most comprehensive set of actions to filter the list of metrics. But facets can also filter your metrics by:
- Configuration: Metrics with tag configurations
- Percentiles: Distribution metrics enabled by percentiles/advanced query capabilities
- Historical Metrics: Metrics that have historical metrics ingestion enabled
- Query Activity: Metrics not queried in Datadog or by the API in the past 30, 60, or 90 days
- Related Assets: Metrics that are being used on dashboards, notebooks, monitors, and SLOs
- Metric Type: Differentiate between distribution and non-distribution metrics (counts, gauges, rates)
- Metric Origin: The product from which the metric originated (for example, metrics generated from Logs or APM Spans). To learn more about the different metric origin types, see Metric origin definitions
Definitions
A metric is unqueried if it has not been accessed in monitors, SLOs, executed notebooks, opened dashboards, used in Metrics Explorer queries, or accessed through API calls within the past 30, 60, or 90 days.
A metric is considered used as long as it exists on an asset, regardless if it has been actively queried.
Configuration of multiple metrics
Clicking Configure Metrics gives you multiple options to configure more than one metric at a time:
- Manage tags: Configure tags on multiple custom metrics matching a namespace using Metrics without Limits™.
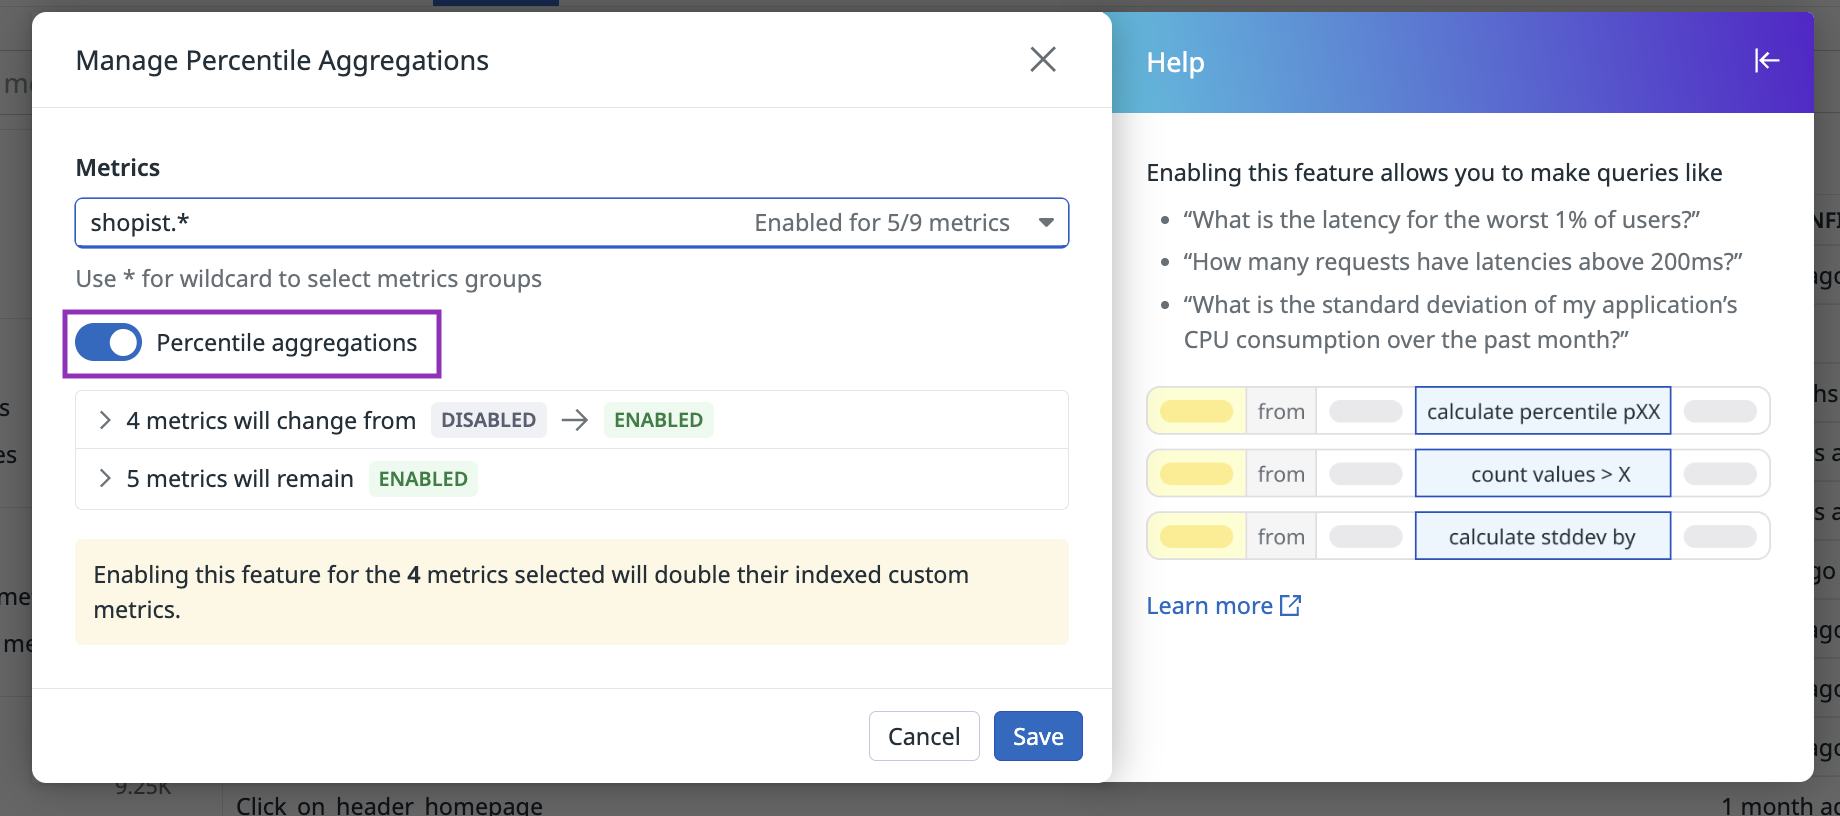
- Enable or disable percentiles: Manage percentile aggregations across multiple distribution metrics. See the Distributions page for more information.
- Enable or disable historical metrics ingestion: Manage the ingestion of historical metric data. See the Historical Metrics Ingestion page for more information.
Metric details sidepanel
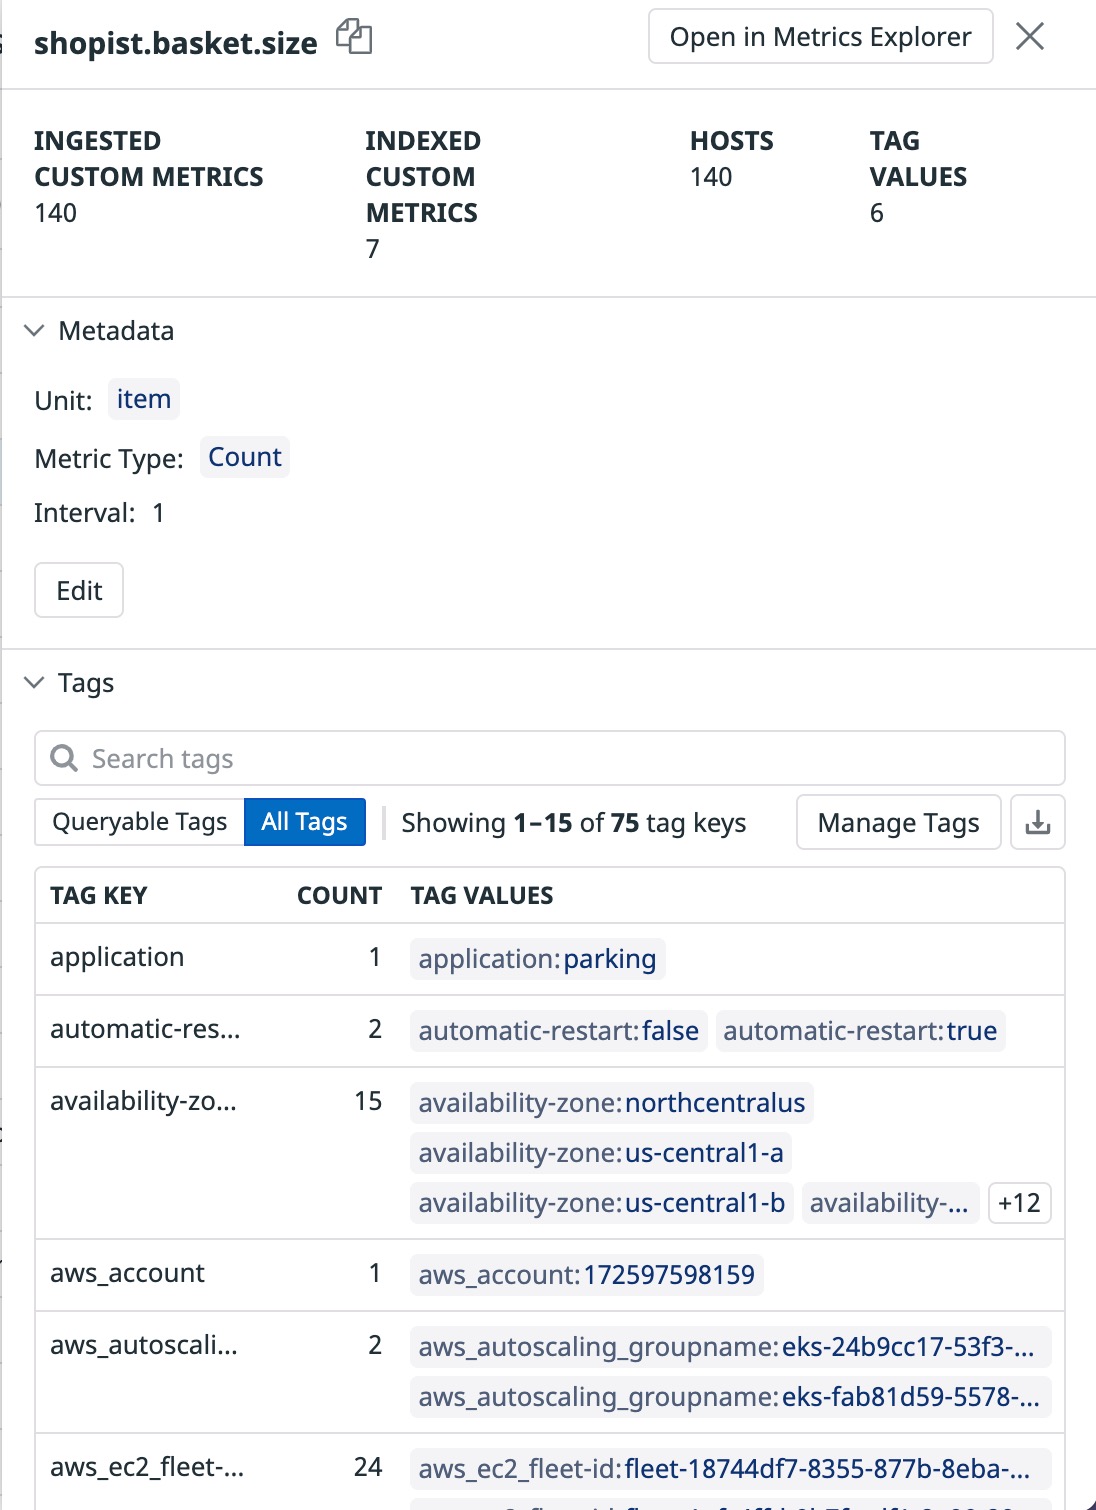
Click on any metric name to display its details sidepanel for more information regarding the metric’s metadata and tags:
Metric name
The name of your metric in the Metrics Explorer, dashboards, etc.
Ingested custom metrics
A metric name may emit multiple ingested custom metrics depending on its associated tag value combinations. Ingested custom metrics represent all of the data originally submitted with code.
Learn more in the custom metrics documentation.
Indexed custom metrics
Unlike ingested custom metrics, indexed custom metrics represent those that remain queryable across the Datadog platform. This number may be impacted by adding or removing percentile aggregations or by use of Metrics without Limits™. Learn more in the Metrics without Limits™ documentation.
Hosts
The total number of hosts reporting a metric.
Tag values
The total number of unique tag values attached to a metric.
Metrics metadata
The metadata attached to your metric. Most of the metadata can be edited on the metric summary page or with the Datadog API.
Metric unit
The unit for your metric (byte, second, request, query, etc.). See the metric unit page for more details.
When submitting custom metrics to Datadog, it is possible to change the unit of measurement that displays when hovering over the metric in your graph.
Note: This does not change how a metric graph is displayed. It only changes the units of measurement that raw values are considered as when you hover over a metric. Formatting is automatically applied for readability. For example, bytes (B) may be displayed as kilobytes (KiB).
Metric type
The type for your metric (gauge, rate, count, distribution). See the metric type page for more details.
Warning: Editing the metric type changes that metric’s behavior for ALL your dashboards and monitors.
Integration name
If the metric is coming from a supported integration, the metadata lists the integration name. This information cannot be edited.
Interval
The collection interval for the metric in seconds.
Metric description
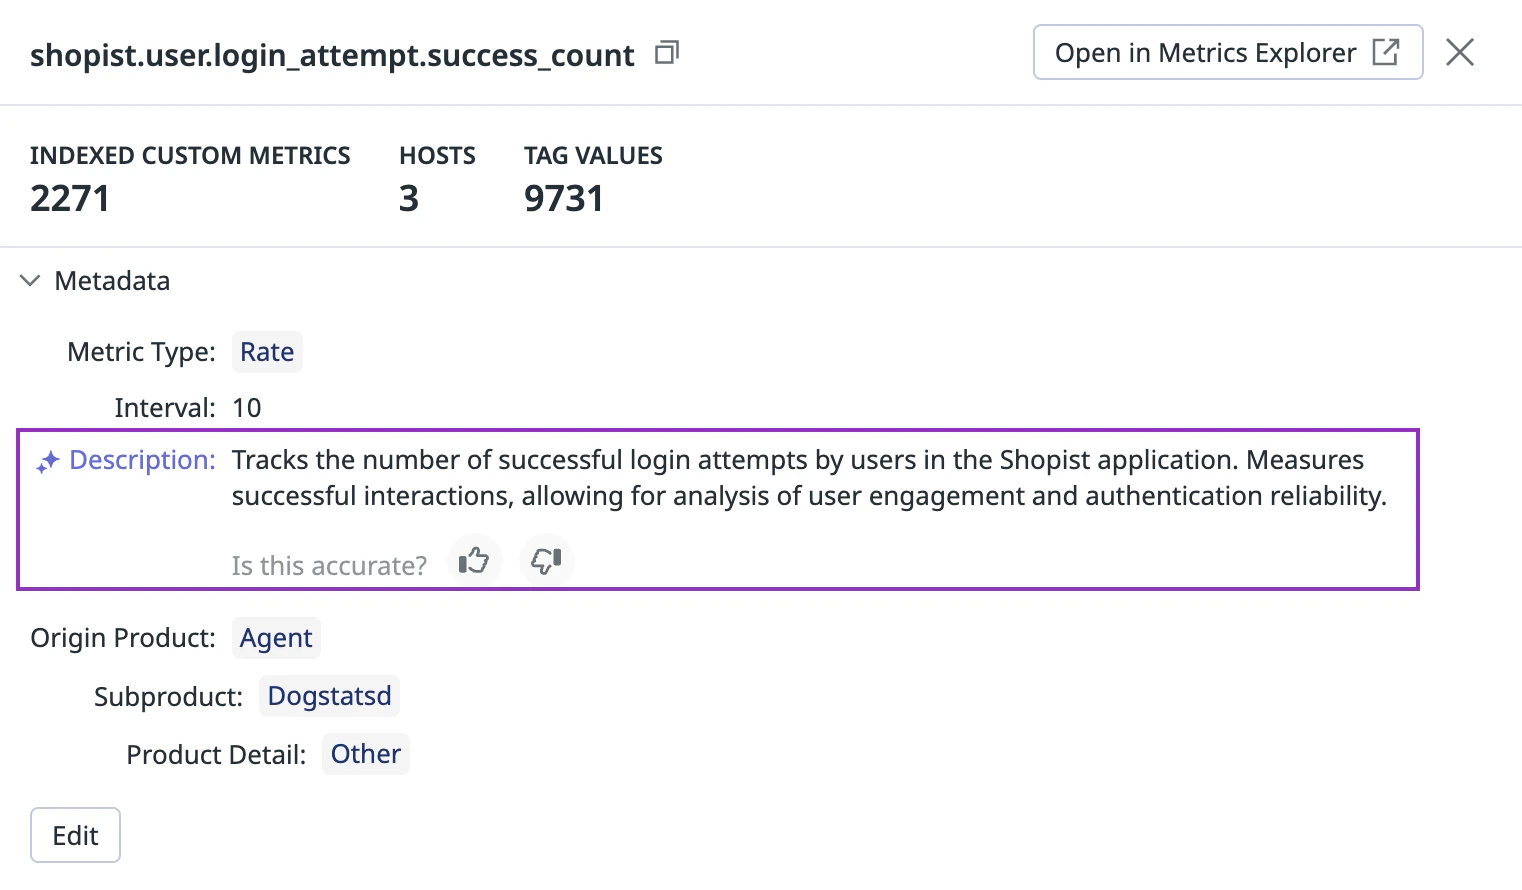
The metric description helps you understand what a metric represents, why it exists, and how it is typically used. Use this field to view and update descriptions for your custom metrics. Descriptions are pre-populated for metrics coming from supported integrations.
AI-generated description
For custom metrics with connected source code, Datadog can automatically create AI-generated descriptions to provide additional context. These descriptions are fully editable, and human edits always take precedence.
To enable auto-generated descriptions from source code, ensure that you’ve installed Datadog’s GitHub, GitLab, or Azure DevOps integration and that all your repositories are connected.
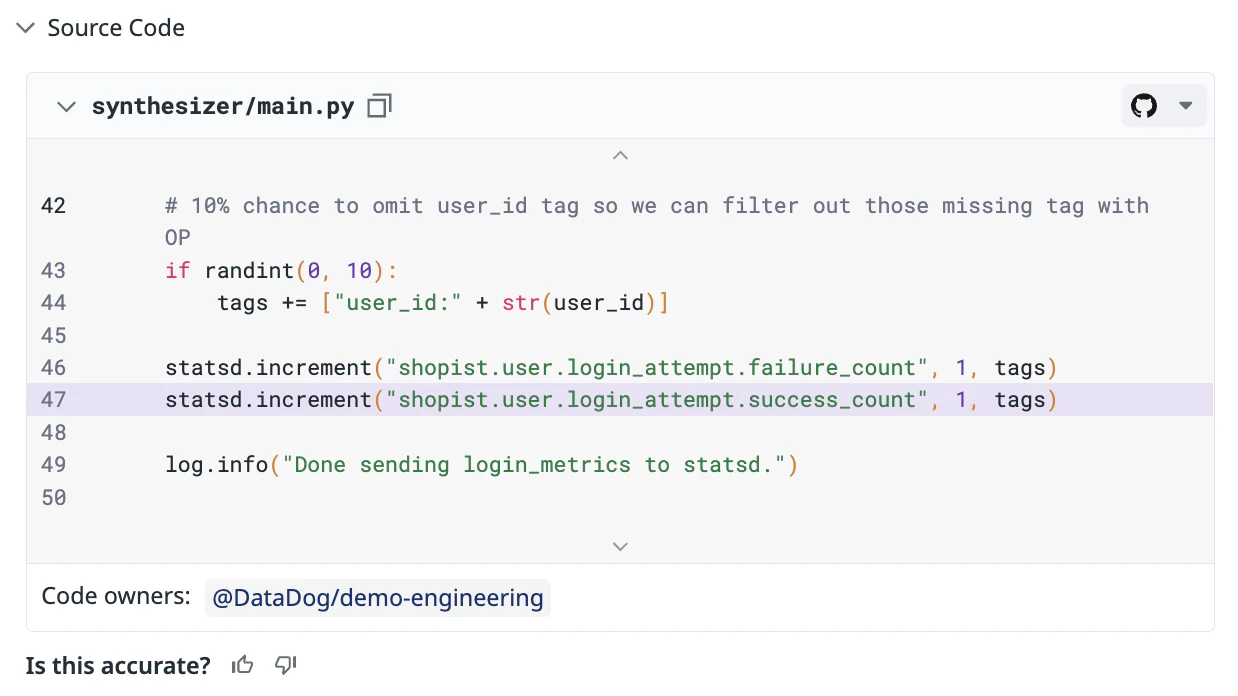
Source Code
The Source Code section in the metric side panel provides a centralized view of every custom metric and its underlying context.
Use the Source Code section in the metric side panel to identify a metric’s source code, understand how it is generated, and determine ownership. It provides visibility into context and ownership, helping you troubleshoot and optimize faster by linking directly to the metric’s source file, commit history, and blame data.
Troubleshooting missing metrics
If a metric doesn’t appear in Source Code, it may be due to how it’s defined.
Datadog detects metrics best when names are written as explicit strings. Metrics built using variables, constants, or custom helpers may not be detected.
Common reasons for missing metrics:
- Metric name is generated dynamically
- Metric is emitted through custom wrappers
- Repository is not fully indexed
Best practice:
- Define metric names as explicit strings when possible
Example:
Sending metric using a variable (not recommended)
public static final String METRIC_NAME = "my.metric.name";
statsEmitter.distribution(METRIC_NAME, value, tags);
Sending metric as explicit string (recommended):
timer = meterRegistry.timer("my.metric.name");
To ensure full coverage of your metric’s source code, ensure that you’ve installed Datadog’s GitHub, GitLab, or Azure DevOps integration and that all your repositories are connected.
Tags table
The tags table offers multiple ways to explore all of the tag keys and tag values that are actively reporting in your metric’s data.
Use the tags table to:
- Sort tag keys by the Count column (count of unique tag values).
- Search through the paginated table of tags for a particular tag key.
- Export the tags table as a downloadable CSV.
- Toggle between tags you’ve configured on your metric vs the metric’s originally submitted tags
For any particular tag key, you can:
- Inspect all tag values of that tag key.
- Use a specific tag
key:valueto further filter the list of metrics displayed on the Metrics Summary page. - Open a graph of this metric filtered by your tag
key:valuepair in the Metrics Explorer. - Copy any tag
key:valuefor filtering across the application.
Metrics Related Assets
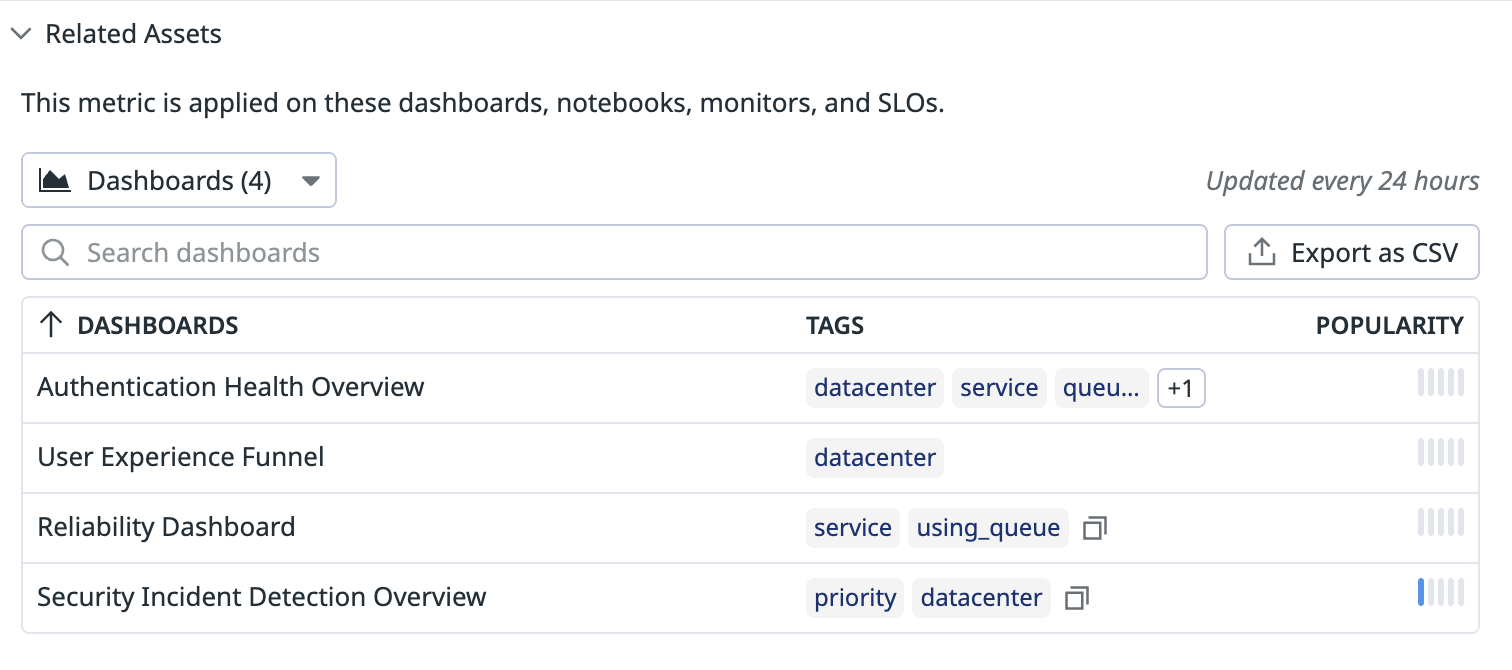
To determine the value of any metric name to your organization, use Metrics Related Assets. Metrics related assets refers to any dashboard, notebook, monitor, or SLO that queries a particular metric.
- Scroll to the bottom of the metric’s details side panel to the Related Assets section.
- Click the dropdown button to view the type of related asset you are interested in (dashboards, monitors, notebooks, SLOs). You can additionally use the search bar to validate specific assets.
- The Tags column shows exactly which tags are used in each asset.
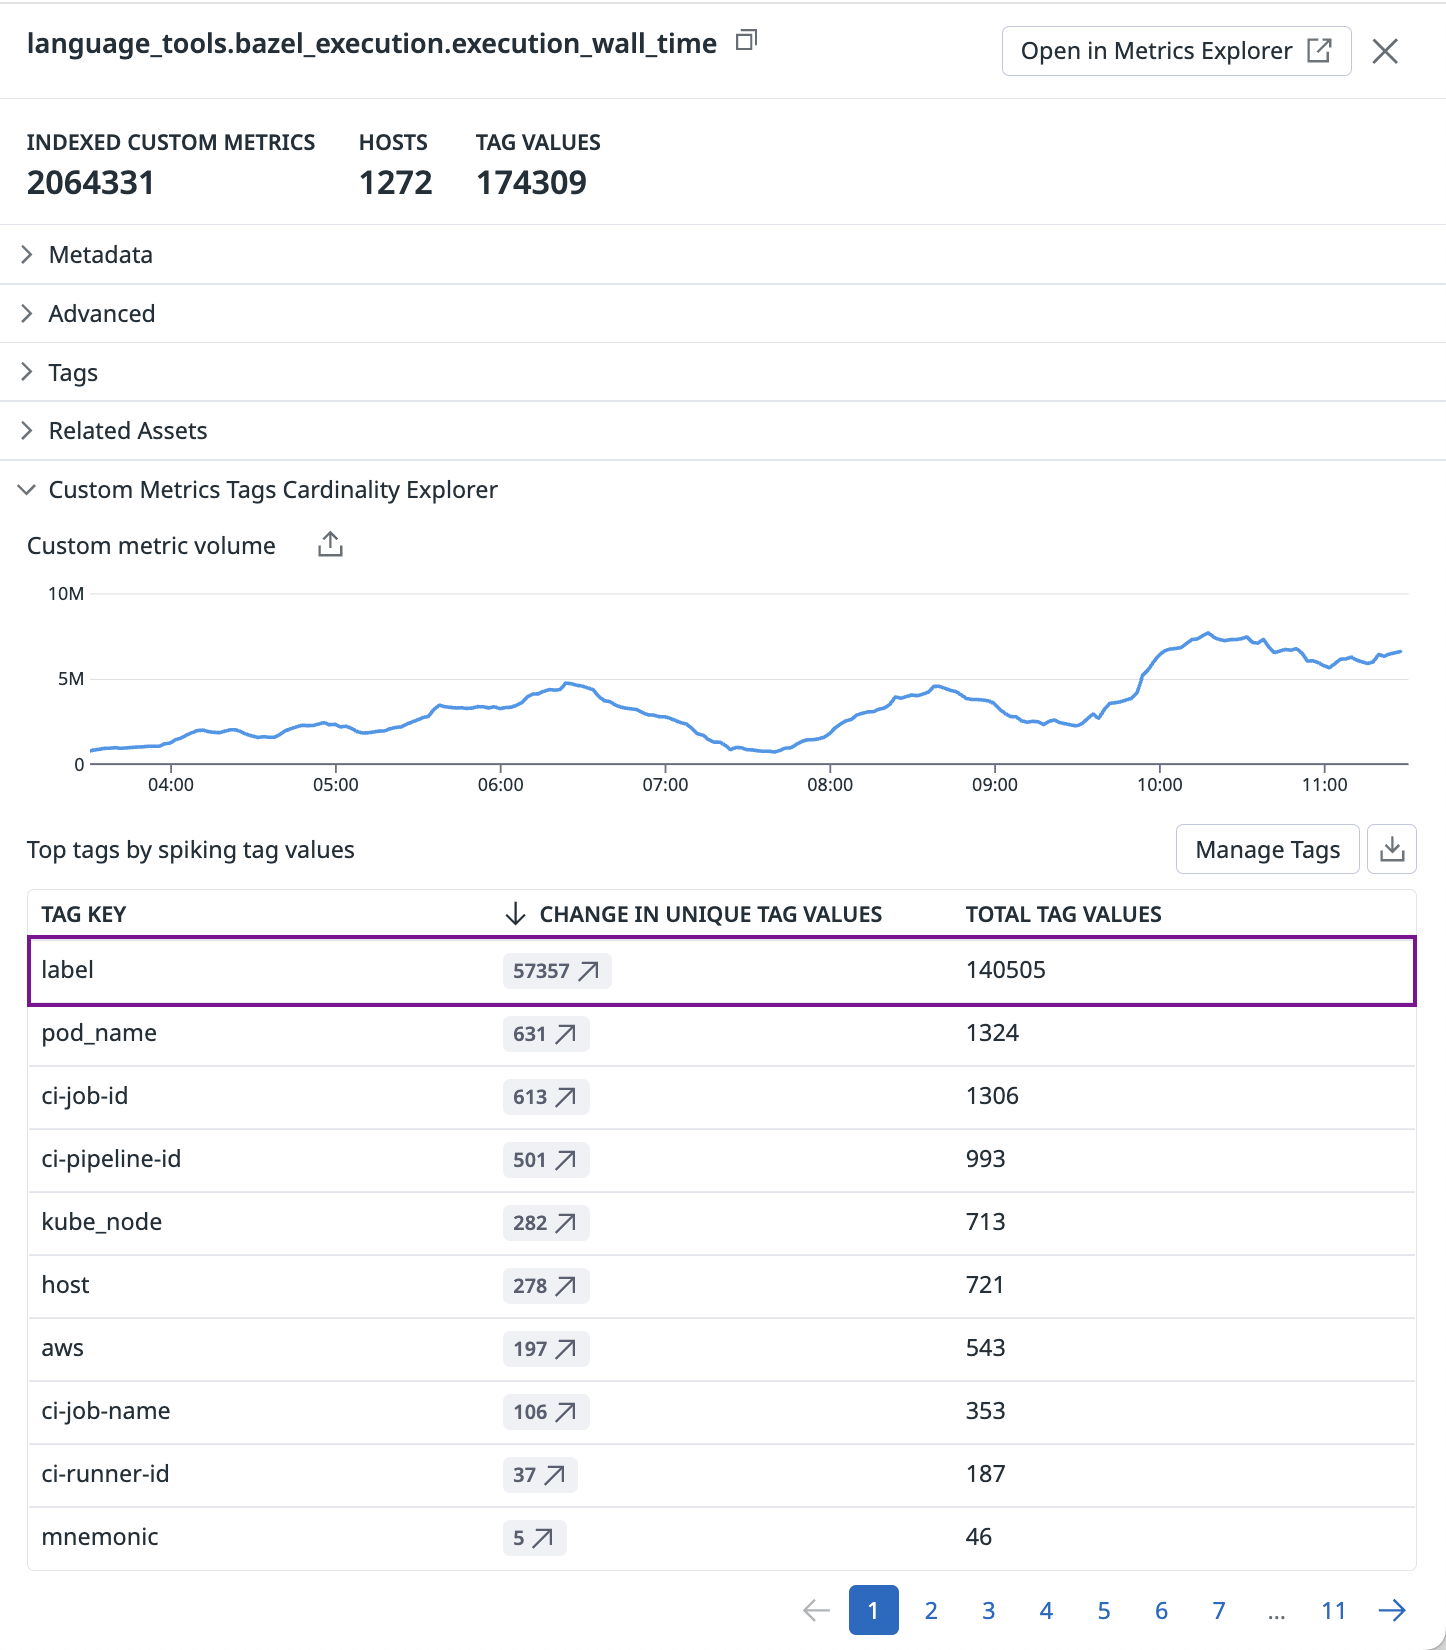
Custom Metrics Tags Cardinality Explorer
To determine why a particular metric name is emitting a large number of custom metrics, or spiking, use the Custom Metrics Tags Cardinality Explorer. This helps you pinpoint the tag keys driving the spike, which you can immediately exclude using Metrics without Limits™ for cost savings.Metrics without Limits™
Metrics without Limits™ provides you control over the size of your custom metrics without requiring any agent or code-level changes.
Note: Metrics without Limits™ is only available for custom metrics.
You can configure tags in bulk by going to Configure Metrics -> Manage tags in the Metrics page, or by clicking the Manage Tags button in a metric’s details side panel.
- Click on your custom distribution metric name in the Metrics Summary table to open the metrics details side panel.
- Click the Manage Tags button to open the tag configuration modal.
- Select Include tags… or Exclude tags… to customize the tags you do or don’t want to query for. For more information on tag configuration, see the Metrics without Limits documentation.
- Preview the effects of your proposed tag configuration with the cardinality estimator before selecting Save.
Note: The cardinality estimator requires the metric to be older than 48 hours.
Queryable tags
Once your metric has been configured with Metrics without Limits™, you can view which tags remain Queryable – ultimately those that contribute to Indexed Custom Metrics volume. And you can toggle back to all originally submitted and ingested tags that contribute to your Ingested Custom Metrics volume.
Metric origin definitions
This table shows the mapping between the metric origin as seen in the facet and where it was submitted from:
| Metric Origin | Submitted from |
|---|---|
| API Catalog | Timeseries sent by the Datadog Software Catalog product from the APIM Endpoint. |
| APM | Timeseries sent by the Datadog APM product for metrics generated from traces and span metrics. |
| Agent | Timeseries sent by the Datadog Agent, collected from Agent integrations, built-in integrations, DogStatsD, or custom Agent checks. |
| Cloud Security | Timeseries sent by the Datadog Cloud Security product. |
| Cloud Integrations | Timeseries collected from cloud providers like AWS, Azure, and Google Cloud etc. from their respective integrations. |
| DBM | Timeseries sent by the Datadog Database Monitoring product, including insights into MySQL, Oracle, and Postgres activities/queries/locks. |
| DSM | Timeseries sent by the Datadog Data Streams Monitoring product, for metrics generated from the DSM spans and traces. |
| Datadog Exporter | Timeseries sent by the OpenTelemetry Collector or the Datadog Exporter. |
| Datadog Platform | Timeseries sent by metrics intake that are used to report metrics usage. |
| Events | Timeseries generated from the Datadog Events platform. |
| LLM Observability | Timeseries emitted by the LLM Observability product using the lmobs_to_metrics service. |
| Logs | Timeseries generated from the Datadog Logs platform. |
| Metrics API | Timeseries sent using Datadog’s OTLP Ingestion endpoint and OTel receiver with a Datadog integration counterparts or points for estimated usage metrics or Datadog API Client. |
| CNM | Timeseries sent by the Datadog Cloud Network Monitoring product. |
| Observability Pipelines | Timeseries sent by the Datadog Observability Pipielines including error and performance metrics. |
| Other | Timeseries that don’t have a DD integration counterpart. |
| Processes | Timeseries generated from the Datadog Processes product. |
| RUM | Timeseries generated from the Datadog Real User Monitoring product. |
| SAAS Integrations | Timeseries collected from popular SAAS platforms like Slack, Docker, PagerDuty etc. |
| Serverless | Timeseries sent by the Datadog Serverless platform including Function, App Services, Cloud Run, and Container App Metrics. |
| Software Catalog | Timeseries sent by the Datadog Software Catalog product including Scorecard metrics. |
| Synthetic Monitoring | Synthetic monitoring and continuous testing metrics generated from the Datadog Synthetic Monitoring product. |
| USM | Timeseries generated from the Datadog Universal Service Monitoring product. |
Further reading
Additional helpful documentation, links, and articles:


