- Principales informations
- Getting Started
- Agent
- API
- Tracing
- Conteneurs
- Dashboards
- Database Monitoring
- Datadog
- Site Datadog
- DevSecOps
- Incident Management
- Intégrations
- Internal Developer Portal
- Logs
- Monitors
- OpenTelemetry
- Profileur
- Session Replay
- Security
- Serverless for AWS Lambda
- Software Delivery
- Surveillance Synthetic
- Tags
- Workflow Automation
- Learning Center
- Support
- Glossary
- Standard Attributes
- Guides
- Agent
- Intégrations
- Développeurs
- OpenTelemetry
- Administrator's Guide
- API
- Partners
- Application mobile
- DDSQL Reference
- CoScreen
- CoTerm
- Remote Configuration
- Cloudcraft
- In The App
- Dashboards
- Notebooks
- DDSQL Editor
- Reference Tables
- Sheets
- Alertes
- Watchdog
- Métriques
- Bits AI
- Internal Developer Portal
- Error Tracking
- Change Tracking
- Service Management
- Actions & Remediations
- Infrastructure
- Cloudcraft
- Resource Catalog
- Universal Service Monitoring
- Hosts
- Conteneurs
- Processes
- Sans serveur
- Surveillance réseau
- Cloud Cost
- Application Performance
- APM
- Termes et concepts de l'APM
- Sending Traces to Datadog
- APM Metrics Collection
- Trace Pipeline Configuration
- Connect Traces with Other Telemetry
- Trace Explorer
- Recommendations
- Code Origin for Spans
- Observabilité des services
- Endpoint Observability
- Dynamic Instrumentation
- Live Debugger
- Suivi des erreurs
- Sécurité des données
- Guides
- Dépannage
- Profileur en continu
- Database Monitoring
- Agent Integration Overhead
- Setup Architectures
- Configuration de Postgres
- Configuration de MySQL
- Configuration de SQL Server
- Setting Up Oracle
- Setting Up Amazon DocumentDB
- Setting Up MongoDB
- Connecting DBM and Traces
- Données collectées
- Exploring Database Hosts
- Explorer les métriques de requête
- Explorer des échantillons de requêtes
- Exploring Database Schemas
- Exploring Recommendations
- Dépannage
- Guides
- Data Streams Monitoring
- Data Jobs Monitoring
- Data Observability
- Digital Experience
- RUM et Session Replay
- Surveillance Synthetic
- Continuous Testing
- Product Analytics
- Software Delivery
- CI Visibility
- CD Visibility
- Deployment Gates
- Test Visibility
- Code Coverage
- Quality Gates
- DORA Metrics
- Feature Flags
- Securité
- Security Overview
- Cloud SIEM
- Code Security
- Cloud Security Management
- Application Security Management
- Workload Protection
- Sensitive Data Scanner
- AI Observability
- Log Management
- Pipelines d'observabilité
- Log Management
- CloudPrem
- Administration
Define Services And Track UI Components In Your Browser Application
Cette page n'est pas encore disponible en français, sa traduction est en cours.
Si vous avez des questions ou des retours sur notre projet de traduction actuel, n'hésitez pas à nous contacter.
Si vous avez des questions ou des retours sur notre projet de traduction actuel, n'hésitez pas à nous contacter.
Overview
RUM captures events from your browser applications and lets you explore them to troubleshoot slow pages and code errors, or to analyze application usage. All captured events are available in RUM Explorer for querying, dashboarding, and alerting.
If your browser application is large, it’s likely been built by multiple web development teams. Each team has an area of ownership that they focus on when troubleshooting errors, slowness, or analyzing usage.
This guide describes how to define an application in RUM. In addition, it covers common use cases in large applications where web development teams may require visibility into the health and usage of their area of ownership.
Create a RUM application
The first step to tracking and analyzing your browser application is to create a RUM application. A RUM application maps a browser application available at a given domain that renders the experience for what customers would perceive as a website.
Track pages in your browser application
Whether your browser application is a single page application or is one that uses server-side rendering, the Browser RUM SDK automatically tracks route changes and creates a view event for every route change.
- A view has a URL available at
@view.url, such ashttps://www.yourwebsite.com/about. - A view has a path available at
@view.url_path, such as/about.
If, for example, automatically capturing pageviews by route change does not provide enough visibility, you can specify a different name for your pages. To do this, you can track views manually and assign them each a name available at @view.name, such as “About Us”.
Track timings during the rendering lifecycle of your pages
The Browser SDK automatically tracks a set of industry-standard timings, Core Web Vitals, page loading times and more.
In addition, you can track the time it takes for a specific item on the page to render, such as an image or a component. You can track more timings by capturing them in code, then pasting the values in your view events. For details on how to do this, see the documentation on adding your own performance timing.
Once timings are captured, they are available like any auto-collected timing. You can use timings to do the following:
- Analyze the distribution of the time across versions of the code in the RUM Explorer
- Troubleshoot possible high values in the view waterfall
Track components in web pages
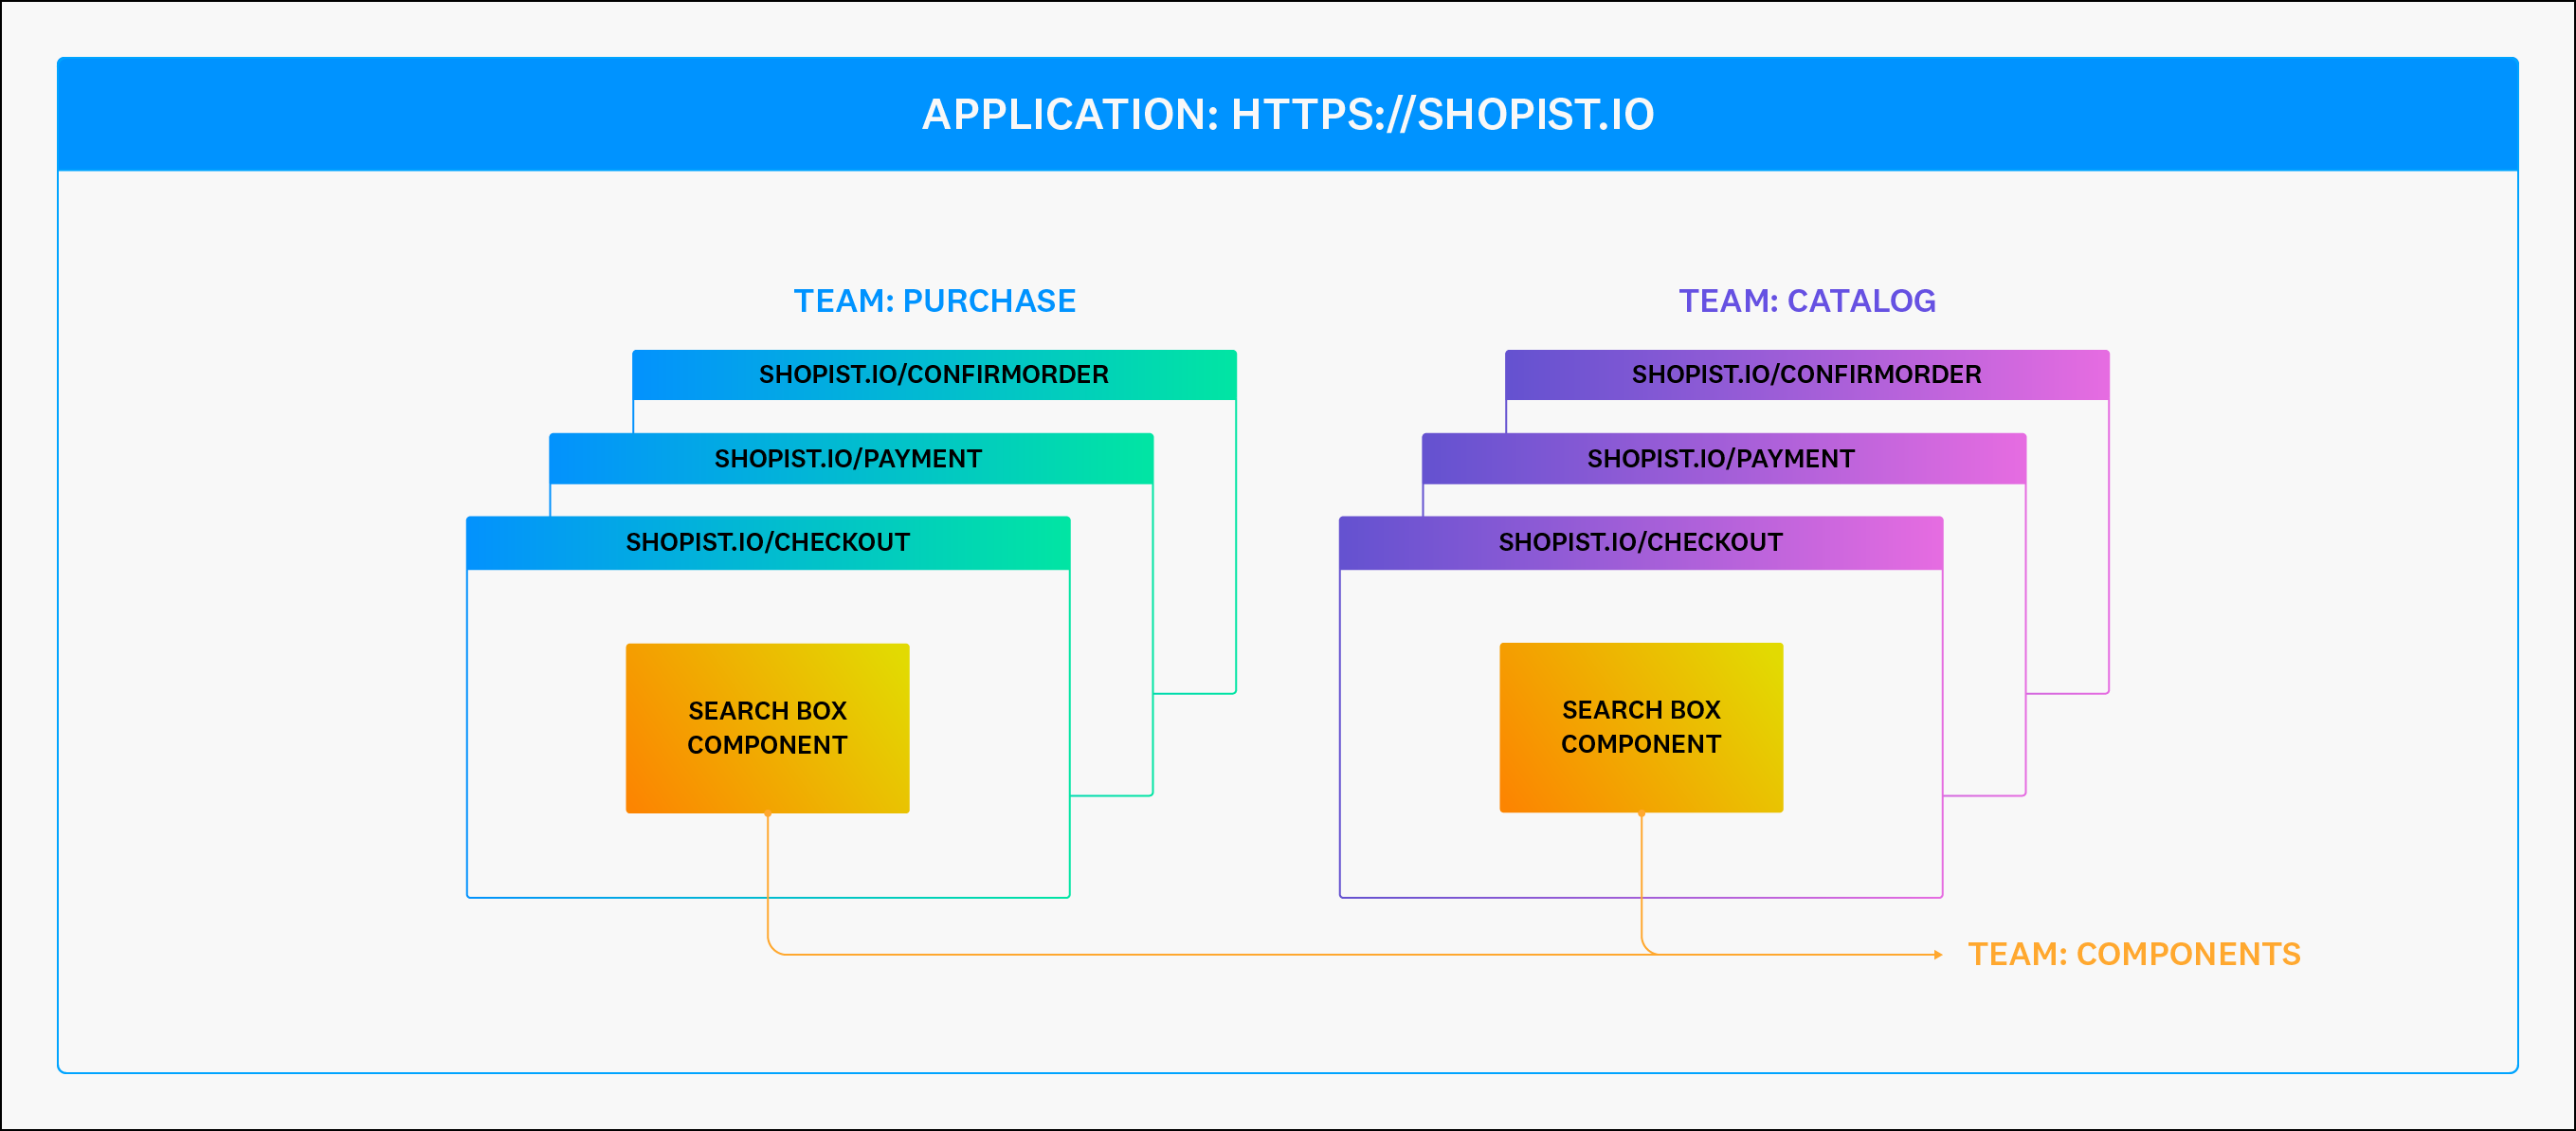
If your browser application uses UI components that are present across multiple pages in one application and/or across multiple applications, you can use custom instrumentation to track the usage and rendering time of these components across pages.
Generate a custom vital to track the lifecycle of components across pages. Let’s imagine the /myorders page and the /search page both use the search box component below.
You can track the following milestones in the lifecycle of the search component by sending a custom vital every time:
search_component_render: The search component renderssearch_component_input: The search component gets input from the user keyboardsearch_component_suggestions_display: The search component displays suggestions
The custom vital then automatically carries attributes for:
- The RUM application it was used in
@view: The page it was rendered in@geo: Geolocation information (if enabled)@session: The session identifier of the user
For example, with custom instrumentation, the custom vital can be assigned attributes for:
- The team it belongs to
- The time it took to render
- Additional context like suggested items
window.DD_RUM.startDurationVital('search_component_render', {
    context: {
        'team': 'Team A',
        'suggested_items': ['tomato', 'strawberries']
    }
})
// ... component renders ...
window.DD_RUM.stopDurationVital('search_component_render')
The time it took to render is automatically calculated and available at @vital.duration.
From the RUM Explorer, you can then analyze:
- The page where a component is used the most
- The browser application where a component is used the most
- The P75 percentile for the time for the component to fully render
Track team ownership
You can use view-based ownership to automatically assign teams to RUM views based on service names, enabling teams to filter and monitor their specific areas of responsibility directly in the RUM Applications Overview page.
Teams own a set of pages
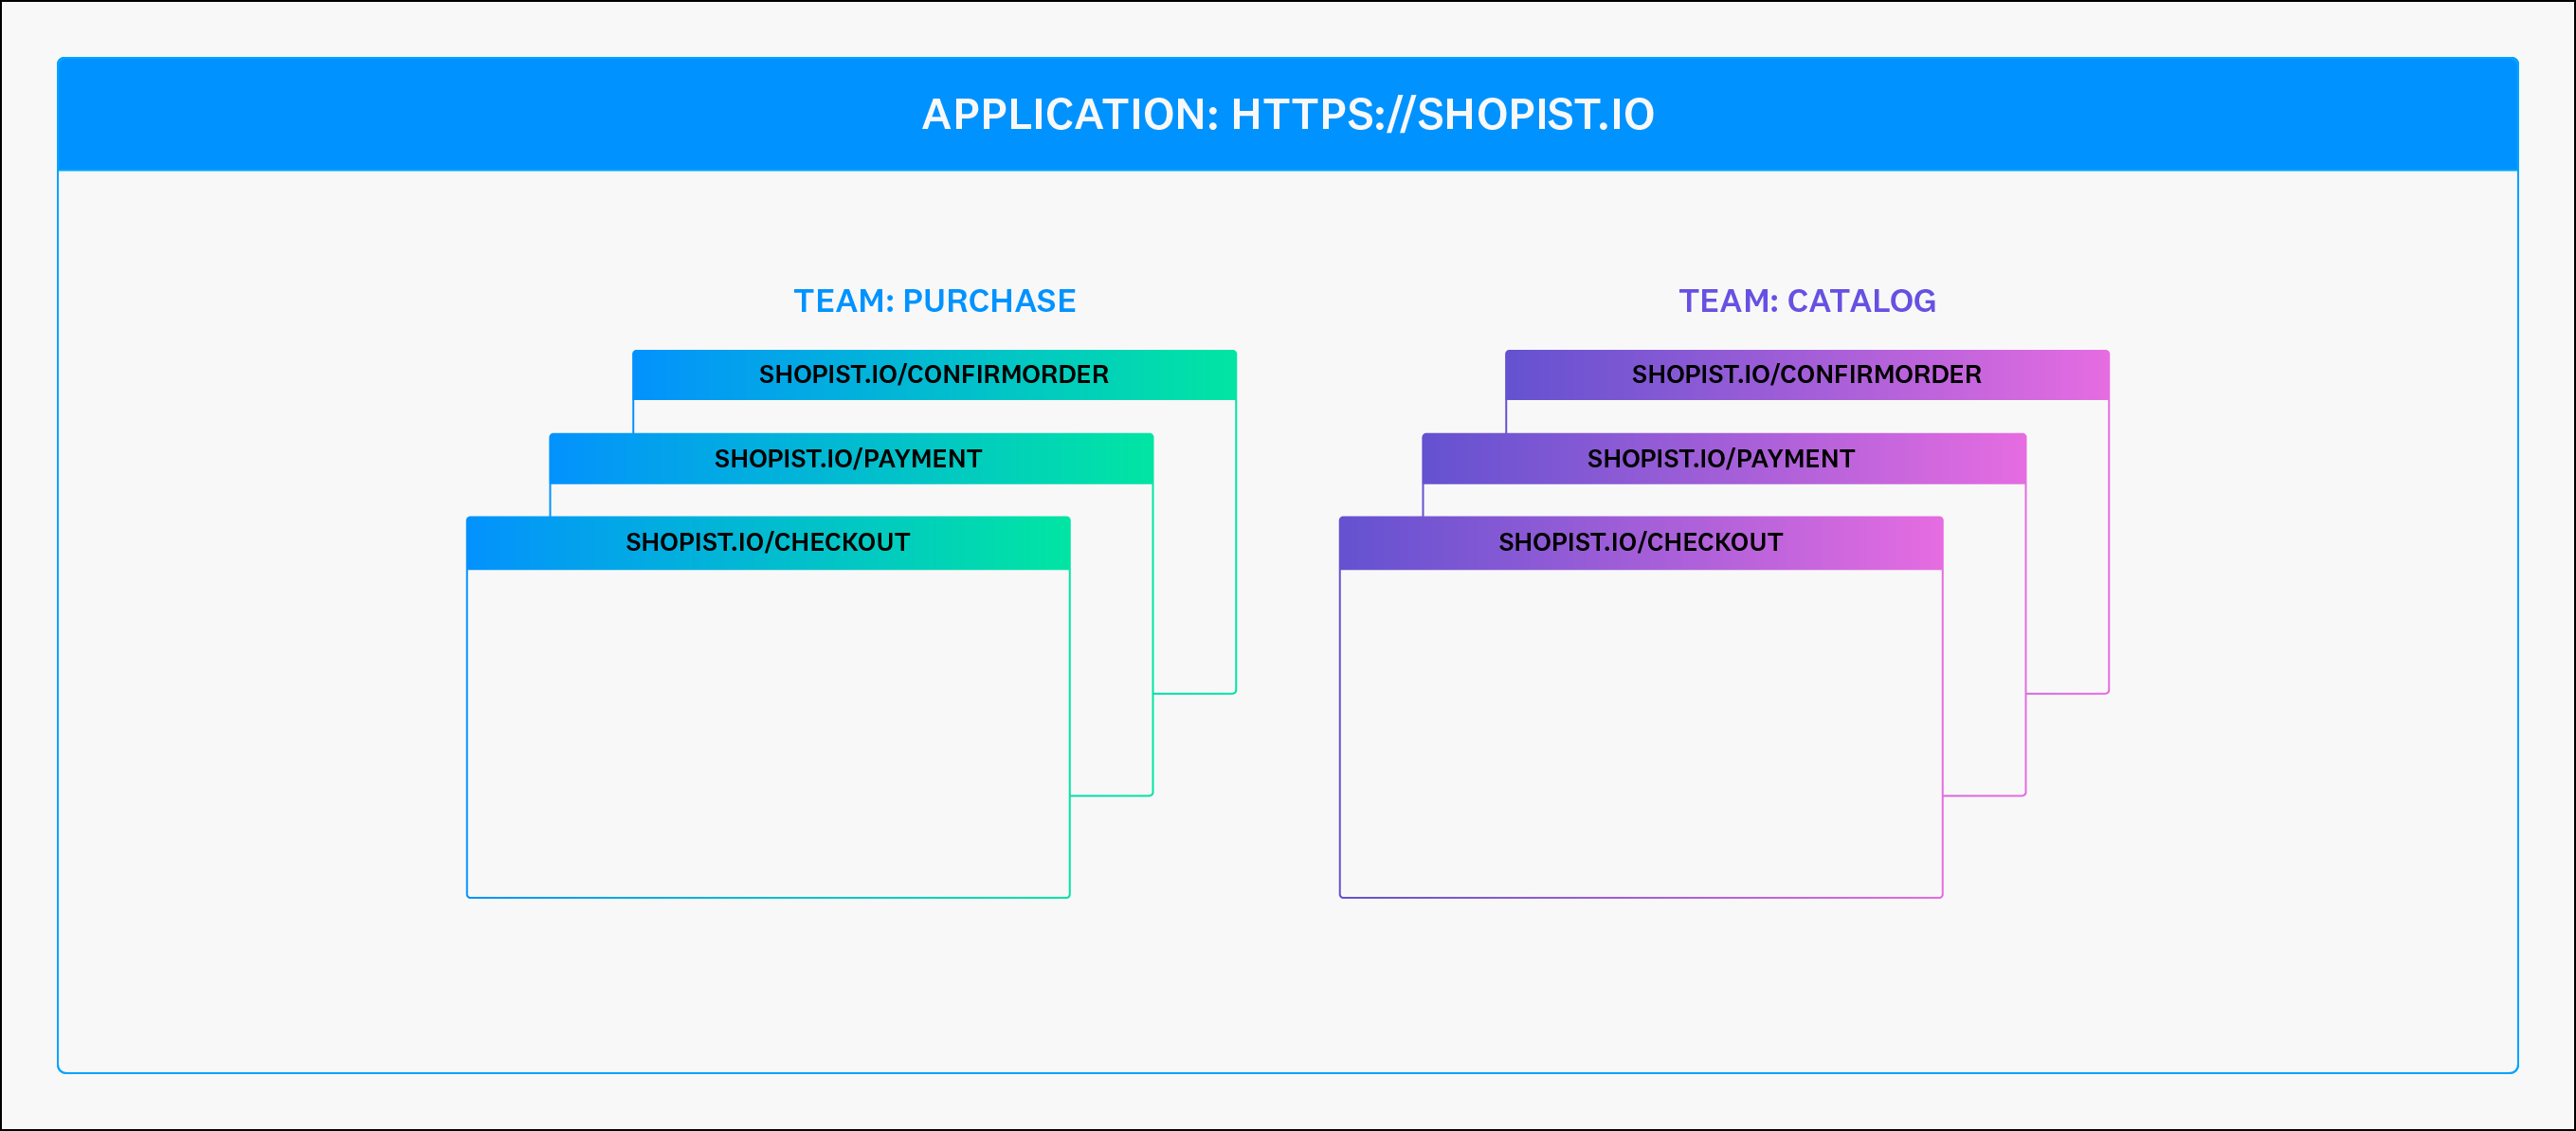
Imagine a web development team owns a set of pages like the example below.
Inside your RUM application, create services for each set of pages owned by a team by doing the following:
- Turn on manual view tracking by setting the configuration option
trackViewsManuallytotrue. - For each page of your website, assign a view name and a service following the instructions for overriding default RUM view names.
"purchase"service for the pages available at/checkout,/payment,/confirmOrder."catalog"service for the pages available at/beds,/chairs/123,/search.
- Upload a source map for each service to view unminified stack traces in Error Tracking.
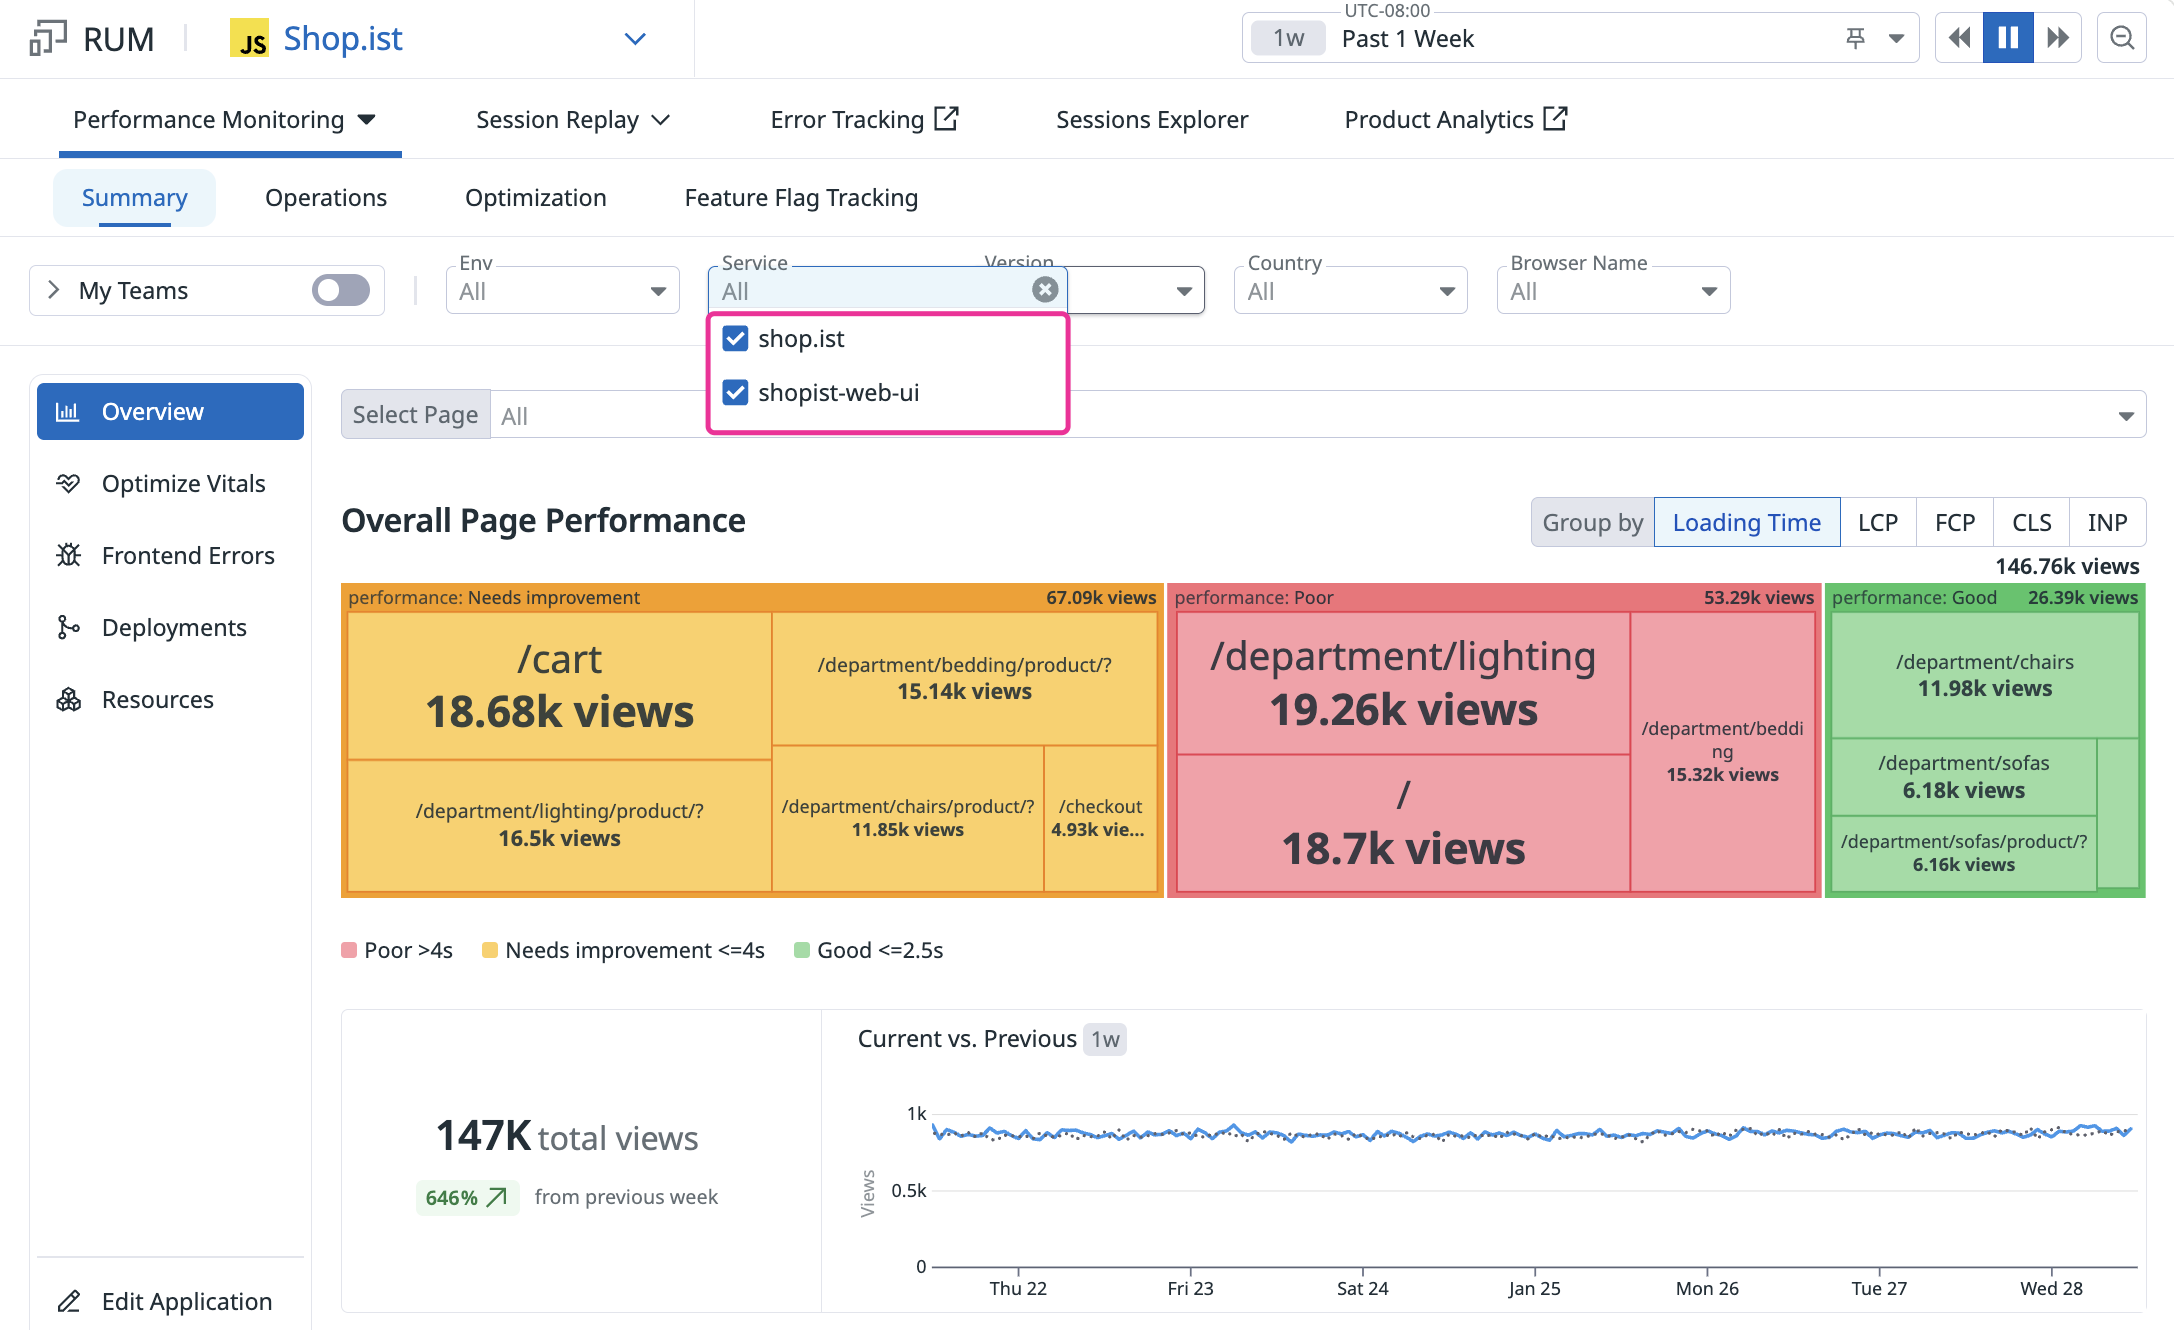
Get insights into the performance or the adoption of a given team’s scope by using the service attribute in RUM:
- From the RUM Application Overview page, narrow down all graphs by
serviceto get a holistic view for a team’s scope - Any query done in the RUM Explorer can use the
serviceattribute to filter:- Errors by service
- Pageviews by service
Teams own UI components
Components are tracked using custom vitals mentioned above:
- Add a team attribute inside the custom vital definition.
- Track the loading time and other timings during the component’s lifecycle as attributes in the custom vitals.
Further reading
Documentation, liens et articles supplémentaires utiles:


