Oracle Cloud Infrastructure
La integración de Oracle Cloud Infrastructure no es compatible con el
Datadog site seleccionado (
).
Visión general
Oracle Cloud Infrastructure (OCI) es una infraestructura como servicio (IaaS) y plataforma como servicio (PaaS) utilizada por empresas de gran escala. Incluye un conjunto completo de más de 30 servicios gestionados de alojamiento, almacenamiento, redes, bases de datos, etc.
Utilice la integración OCI de Datadog para obtener una visibilidad completa de su entorno OCI a través de métricas, logy datos de recursos. Estos datos le permiten crear cuadros de mando, le ayudan a solucionar problemas y pueden supervisarse para garantizar la seguridad y el cumplimiento de las normativas.
Configuración
Recopilación de métricas
OCI QuickStart está en Vista previa. Utilice
este formulario para enviar su solicitud hoy mismo.
OCI QuickStart de Datadog es una experiencia de configuración totalmente gestionada y de flujo único que te ayuda a monitorizar tu infraestructura y aplicaciones OCI en tan sólo unos clics. OCI QuickStart crea la infraestructura necesaria para reenviar métricas, logs y datos de recursos a Datadog y descubre automáticamente nuevos recursos o compartimentos OCI para la recopilación de datos.
Nota: En forma predeterminada sólo se envían métricas. Habilita la recopilación de logs y de datos de recursos desde el ícono de integración de OCI de Datadog después de completar esta configuración.
Para configurar la infraestructura de reenvío de métricas y logs a Datadog:
La integración requiere el uso de Oracle Service Connector Hubs para reenviar datos a Datadog. Se recomienda solicitar un aumento del límite del servicio antes de completar la configuración. El número aproximado de Service Connector Hubs que necesitas es:
$$\text"Service Connector Hubs" = \text"Número de compartimentos en tenencia" / \text"5"$$
- Tu cuenta de usuario OCI necesita el rol de Administrador de la nube para completar estos pasos
- Debes iniciar sesión en OCI en la tenencia con la que deseas integrarte
- Debes iniciar sesión en OCI con la Región de origen seleccionada en la parte superior derecha de la pantalla
- Tu cuenta de usuario OCI debe estar en el Dominio de identidad predeterminado
- Tu cuenta de usuario de OCI debe poder crear un usuario, un grupo de usuarios y un grupo dinámico en el dominio de identidad predeterminado.
- Tu cuenta de usuario OCI debe poder crear políticas en el compartimento raíz
- us-ashburn-1
- ap-tokyo-1
- sa-saopaulo-1
- us-phoenix-1
- eu-frankfurt-1
- eu-stockholm-1
- ap-singapur-1
- us-sanjose-1
- ca-toronto-1
- sa-santiago-1
- uk-london-1
- eu-madrid-1
- me-jeddah-1
- us-chicago-1
Ponte en contacto a través de este formulario para solicitar regiones adicionales.
Ícono de integración de OCI de Datadog
- Ve al ícono de integración de OCI de Datadog y haz clic en Añadir nueva tenencia.
- Selecciona o crea una clave de la API Datadog para utilizarla para la integración.
- Crea una clave de la aplicación Datadog.
- Haz clic en Crear stack tecnológico de OCI. Esto te llevará a un stack tecnológico de Oracle Resource Manager (ORM) para finalizar el despliegue.
Nota: Despliega este stack tecnológico sólo una vez por tenencia.
Stack tecnológico de ORM
- Acepta las Condiciones de uso de Oracle.
- Deja sin marcar la opción de utilizar proveedores personalizados de Terraform.
- Utiliza el directorio de trabajo predeterminado para desplegar el stack tecnológico u opcionalmente elige uno diferente.
- Haz clic en Siguiente y Siguiente de nuevo.
- Haz clic en Crear y espera hasta 15 minutos a que se complete el despliegue.
Para reenviar tus métricas de OCI a Datadog:
Para ver una representación visual de esta arquitectura, consulta la sección Arquitectura.
- Tu cuenta de usuario OCI necesita el rol de Administrador de la nube para completar estos pasos
- OCID de la tenencia
- Región de origen
Ingresa el OCID y la región de origen de la tenencia que deseas monitorizar en el cuadro de integración de Datadog y OCI.
Crear un stack tecnológico de políticas de OCI
- Tu cuenta de usuario OCI debe poder [crear grupos y políticas dinámicas][4] en el dominio predeterminado
- Debes estar en la región de origen de la tenencia
Asegúrate de que la región de origen de la tenencia esté seleccionada en la parte superior derecha de la pantalla.
Este stack tecnológico de políticas de Oracle Resource Manager (ORM) sólo debe desplegarse una vez por tenencia.
- Haz clic en el botón Create Policy Stack (Crear un stack tecnológico de políticas) en el cuadro de integración de Datadog y OCI.
- Acepta las Condiciones de uso de Oracle.
- Deja la opción de utilizar proveedores de Terraform personalizados sin marcar.
- Utiliza el nombre y el compartimento predeterminados para el stack tecnológico. De manera opcional, indica tu propio nombre descriptivo o compartimento.
- Haz clic en Siguiente.
- Deja el campo de tenencia y el campo de usuario actual como están.
- Haz clic en Siguiente.
- Haz clic en Create (Crear).
Introduce DatadogROAuthUser info
- OCID del
DatadogROAuthUser - Clave de la API de OCI y valor de la huella digital
- En la barra de búsqueda de la consola OCI, busca
DatadogROAuthUser y haz clic en el recurso de Usuario que aparece. - Copia el valor del OCID del usuario.
- Pega el valor en el campo User OCID (OCID del usuario) del cuadro de integración de Datadog y OCI.
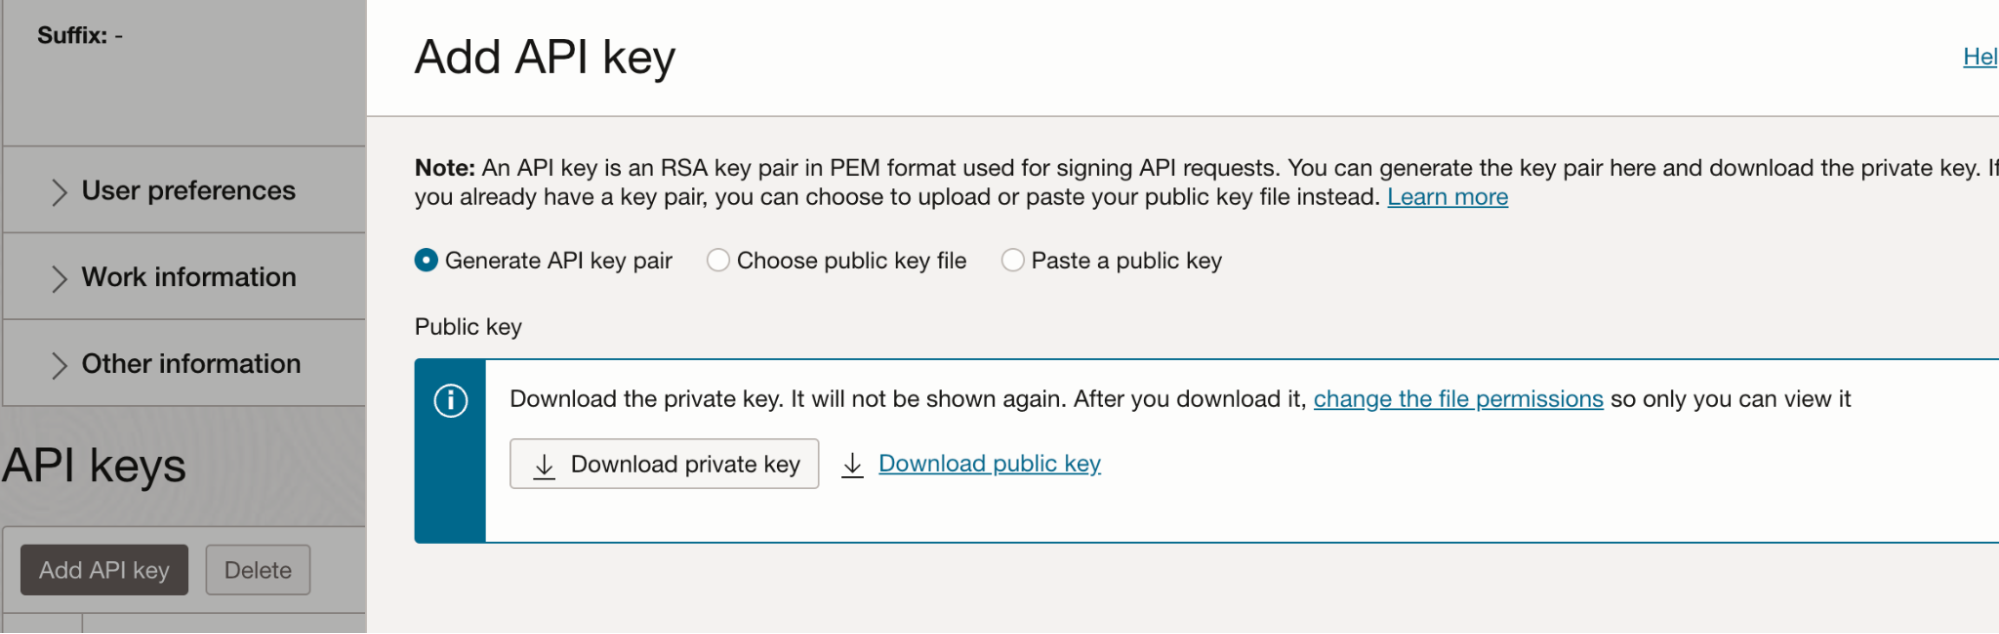
- Al volver a la consola OCI, genera una clave de API con estos pasos:
a. En la esquina inferior izquierda de la pantalla, en Recursos, haz clic en Claves de API.
b. Haz clic en Añadir clave de API.
c. Haz clic en Descargar clave privada.
d. Haz clic en Añadir.
e. Aparece una ventana emergente Configuration file preview (Vista previa del archivo de configuración), pero no es necesario realizar ninguna acción; cierra la ventana emergente.
- Copia el valor de la huella digital y pégalo en el campo Huella digital del cuadro de integración de Datadog y OCI.
- Copia el valor de la clave privada con estos pasos:
a. Abre el archivo de clave privada
.pem descargado en un editor de texto, o utiliza un comando de terminal como cat para mostrar el contenido del archivo.
b. Copia todo el contenido, incluidos -----BEGIN PRIVATE KEY----- y -----END PRIVATE KEY-----. - Pega el valor de la clave privada en el campo Private Key (Clave privada) del cuadro de integración de Datadog y OCI.
Crea un stack tecnológico de reenvío de métricas de OCI
- Tu cuenta de usuario OCI debe poder crear recursos en el compartimento
- Valor de la [clave de API de Datadog][6].
- Nombre de usuario y token de autenticación para un usuario con los permisos
REPOSITORY_READ y REPOSITORY_UPDATE para extraer e insertar imágenes en un repositorio Docker- Consulta [Cómo obtener un token de autenticación][7] para saber cómo crear un token de autenticación.
- Consulta [Políticas para controlar el acceso a repositorios][8] para obtener más información sobre las políticas necesarias
Nota: Para comprobar que el inicio de sesión en el registro de Docker sea el correcto, consulta [Inicio de sesión en el registro de Oracle Cloud Infrastructure][9].
El stack tecnológico de reenvío de métricas debe desplegarse para cada combinación de tenencia y región que se debe monitorizar. Para la configuración más sencilla, Datadog recomienda crear todos los recursos OCI necesarios con el stack tecnológico de Oracle Resource Manager (ORM) que se proporciona a continuación. Como alternativa, puedes utilizar tu infraestructura de red OCI existente.
Todos los recursos creados a partir del stack tecnológico de ORM de Datadog se despliegan en el compartimento especificado y para la región seleccionada actualmente en la parte superior derecha de la pantalla.
- Haz clic en el botón Create Metric Stack (Crear un stack tecnológico de métricas) en el cuadro de integración de Datadog y OCI.
- Acepta las Condiciones de uso de Oracle.
- Deja sin marcar la opción Custom providers (Proveedores personalizados).
- Asigna un nombre al stack tecnológico y selecciona el compartimento en el que se desplegará.
- Haz clic en Siguiente.
- En el campo Datadog API Key (Clave de API de Datadog), ingresa el valor de tu clave de API de Datadog.
- En la sección Network options (Opciones de red), deja marcada la opción
Create VCN.
Si utilizas una Red de Nube Virtual (VCN) existente, debes proporcionar el OCID de la subred al stack tecnológico. Asegúrate de que la VCN:
- Tenga permiso para realizar llamadas de salida HTTP a través de la puerta de NAT
- Sea capaz de extraer imágenes del registro de contenedores OCI mediante la puerta de servicios.
- Tenga las reglas de tabla de rutas para permitir la puerta de NAT y la puerta de servicio
- Tenga las reglas de seguridad para enviar solicitudes HTTP
- En la sección Opciones de red, deja sin marcar la opción
Create VCN e introduce la información de tu VCN:
a. En el campo Compartimento de VCN, selecciona tu compartimento.
b. En la sección VCN existente, selecciona tu VCN existente.
c. En la sección Function Subnet OCID (OCID de subred de función), introduce el OCID de la subred que se va a utilizar.
- De manera opcional, en la sección Metrics settings (Parámetros de las métricas), elimina cualquier espacio de nombres de métrica de la recopilación.
- En la sección Metrics compartments (Compartimentos de las métricas), ingresa una lista separada por comas de los OCID de compartimentos que se van a monitorizar. Los filtros de espacio de nombres de métrica seleccionados en el paso anterior se aplican a cada compartimento.
- En la sección Configuración de funciones, selecciona
GENERIC_ARM. Selecciona GENERIC_X86 si realizas el despliegue en una región de Japón. - Haz clic en Siguiente.
- Haz clic en Create (Crear).
- Vuelve a la página del cuadro de integración de Datadog y OCI y haz clic en Create configuration (Crear configuración).
Notas:
- En forma predeterminada, sólo se selecciona el compartimento raíz y se activan todos los espacios de nombres de métricas del Paso 8 presentes en el compartimento (se admiten hasta 50 espacios de nombres por concentrador de conectores). Si eliges monitorizar compartimentos adicionales, los espacios de nombres añadidos a ellos son una intersección de los espacios de nombres seleccionados y los espacios de nombres presentes en el compartimento.
- Debes gestionar quién tiene acceso a los archivos de estado de Terraform de los stacks tecnológicos del gestor de recursos. Consulta la sección Archivos de estado de Terraform de la página Obtener el gestor de recursos para obtener más información.
Completar la configuración en Datadog
Vuelve al ícono de integración de OCI de Datadog y haz clic en ¡Listo!.
Validación
Consulta las métricas de oci.* en el dashboard de información general de integración de OCI o la página Metrics Explorer en Datadog.
Las métricas de la función de OCI (espacio de nombres oci.faas) y las métricas de la instancia del contenedor (espacio de nombres oci_computecontainerinstance) se encuentran en versión preliminar.
Configuración
 !
!
Una vez completada la configuración, aparecerá una pestaña de configuración para la tenencia en la parte izquierda del ícono de integración de OCI de Datadog. Aplica las configuraciones de recopilación de datos de toda la tenencia como se indica en las secciones siguientes.
Añadir regiones
En la pestaña General, selecciona las regiones para la recopilación de datos en la lista de casillas de verificación Regiones. Las selecciones de regiones se aplican a toda la tenencia, tanto para las métricas como para logs.
Nota: Si has utilizado el método de configuración QuickStart y después te has suscrito a una nueva región OCI, vuelve a aplicar el stack tecnológico de configuración inicial en ORM. La nueva región estará entonces disponible en el ícono de OCI de Datadog.
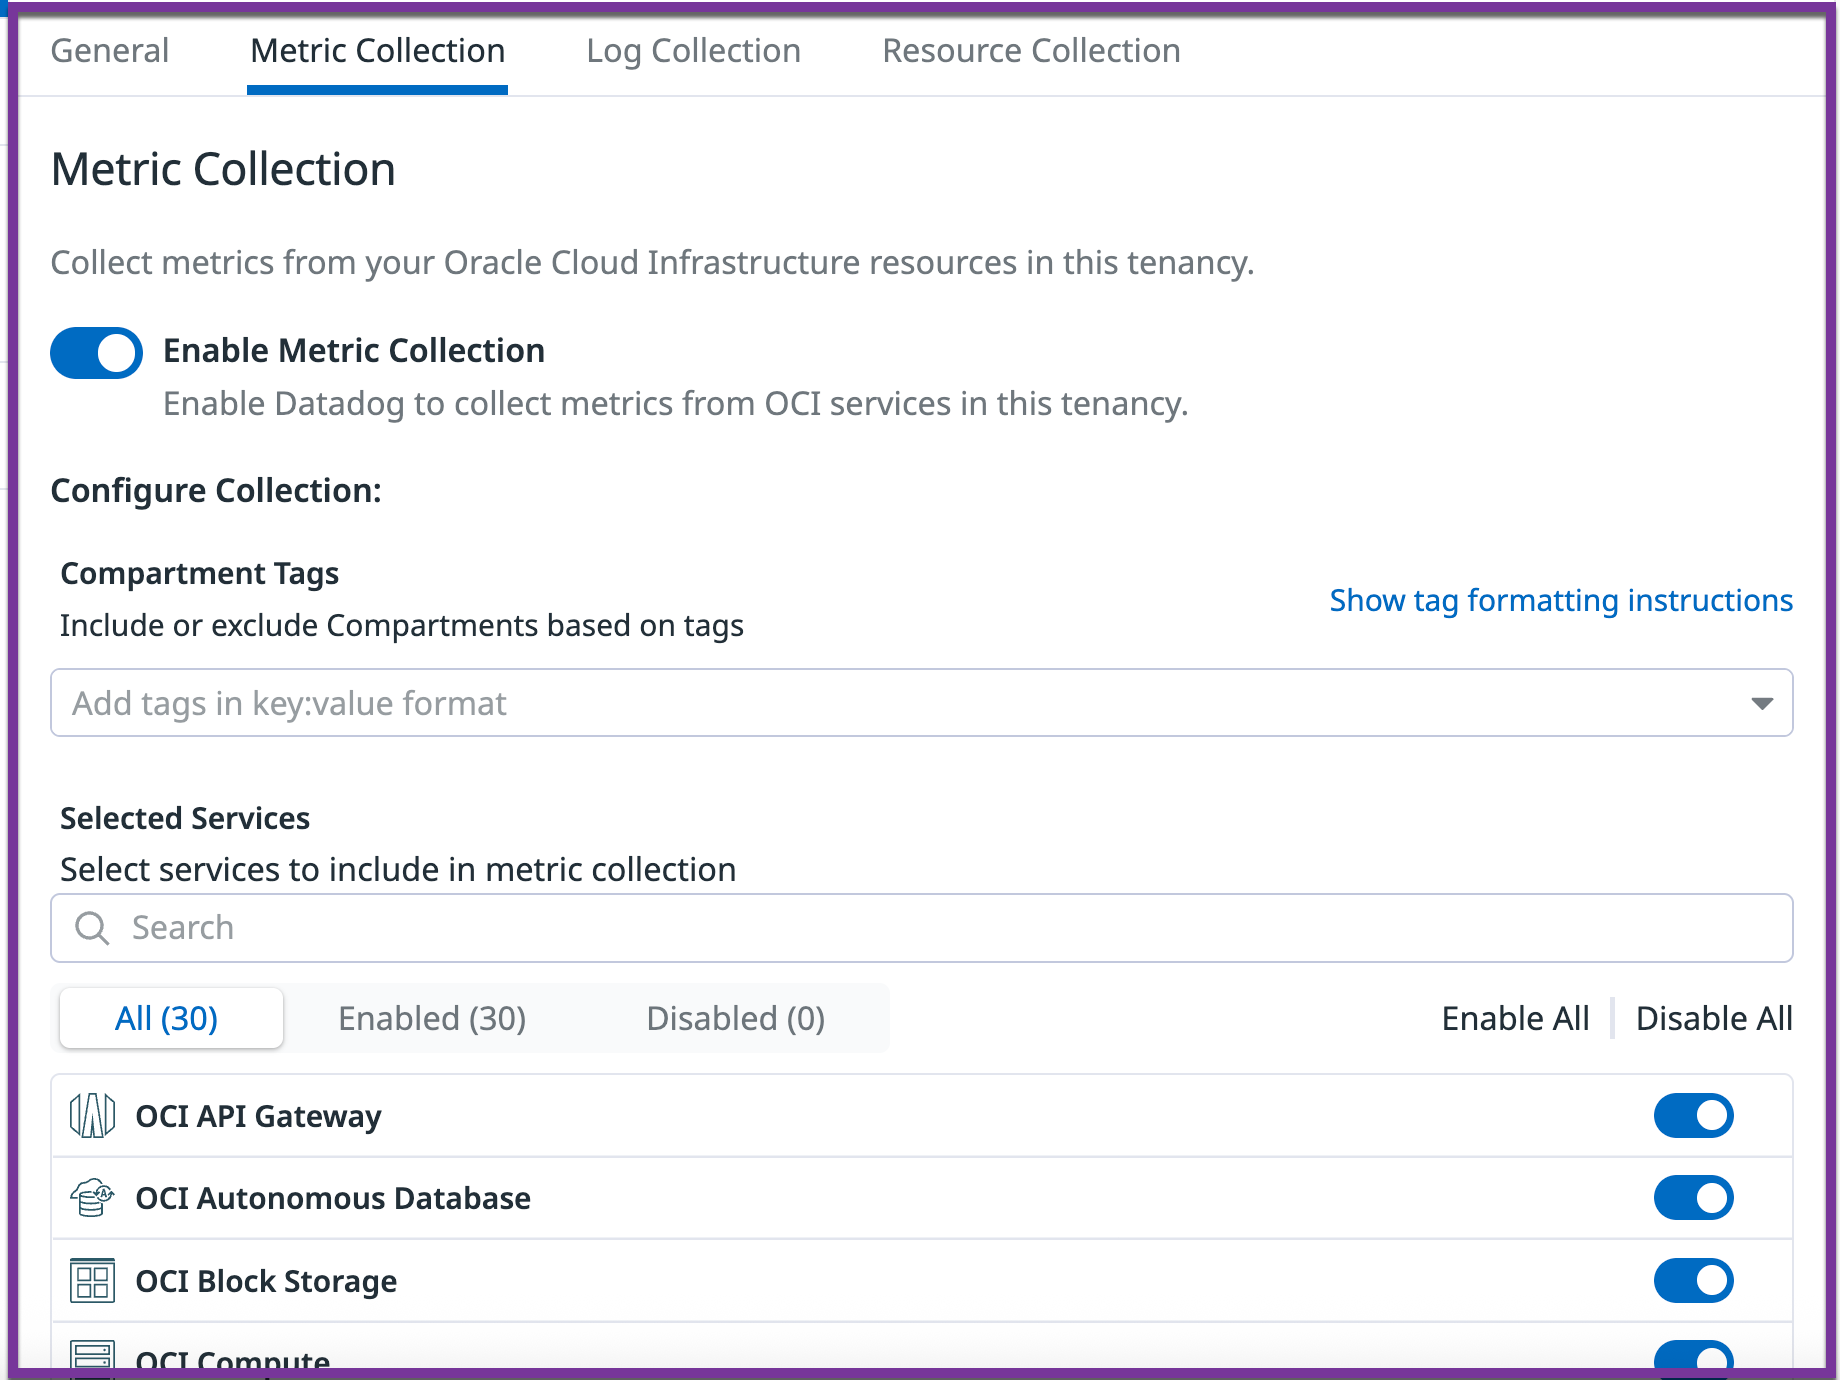
Recopilación de métricas y logs
Utiliza las pestañas Recopilación de métricas y Recopilación de logs para configurar qué métricas y logs se envían a Datadog:
- Activar o desactivar la recopilación de métricas o logs para toda la tenencia.
- Incluir o excluir compartimentos específicos basándose en las etiquetas (tags) de compartimentos del formato
key:value. Por ejemplo:datadog:monitored,env:prod* incluye compartimentos si alguna de estas etiquetas (tags) está presente!env:staging,!testing excluye los compartimentos sólo si ambas etiquetas (tags) están presentesdatadog:monitored,!region:us-phoenix-1 incluye los compartimentos que tienen la etiqueta (tag) datadog:monitored y los que no tienen la etiqueta (tag) region:us-phoenix-1
- Activar o desactivar la recopilación para servicios OCI específicos.
Notas:
- Tras modificar las etiquetas (tags) en OCI, los cambios pueden tardar hasta 15 minutos en aparecer en Datadog
- En OCI, las etiquetas (tags) no son heredadas por los compartimentos secundarios; cada compartimento se debe etiquetar individualmente.
Espacios de nombre de métricas
Recopilación de logs
Utiliza uno de los siguientes métodos para enviar tus logs de OCI a Datadog:
- Configura un log de OCI.
- Crea una función de OCI.
- Configura un conector de servicio de OCI.
Las siguientes instrucciones utilizan el portal de OCI para configurar la integración.
Registro de OCI
- En el portal de OCI, ve a Logging -> Log Groups (Registro > Grupos de logs).
- Selecciona tu compartimento y haz clic en Crear un grupo de logs. Se abre un panel lateral.
- Introduce
data_log_group para el nombre y, opcionalmente, proporciona una descripción y etiquetas (tags). - Haz clic en Create (Crear) para configurar tu nuevo grupo de logs.
- En Resources (Recursos), haz clic en Logs.
- Haz clic en Create custom log (Crear log personalizado) o Enable service log (Habilitar log de servicio) según lo desees.
- Haz clic en Enable Log (Habilitar log), para crear tu nuevo log de OCI.
Para obtener más información sobre logs de OCI, consulta Activación del registro para un recurso.
Función de OCI
- En el portal de OCI, ve a Functions* (Funciones).
- Selecciona una aplicación existente o haz clic en Create Application (Crear aplicación).
- Crea una nueva función de OCI dentro de tu aplicación. Consulta Información general de funciones de Oracle para obtener más detalles.
- Se recomienda crear primero una función boilerplate en Python y sustituir los archivos generados automáticamente por el código fuente de Datadog:
Hub de conectores de servicio de OCI
- En el portal de OCI, ve a Logging -> Service Connectors (Registro > Conectores de servicio).
- Haz clic en Create Service Connector (Crear conector de servicio) para ser redireccionado a la página Create Service Connector (Crear conector de servicio).
- Selecciona Source (Origen) como Logging (Registro) y Target (Destino) como Functions (Funciones).
- En Configure Source Connection (Configurar conexión de origen) selecciona Compartment name (Nombre de compartimento), Log Group (Grupo de logs) y Log. (El Log Group (Grupo de logs) y Log creados en el primer paso).
- Si también deseas enviar Audit Logs (Logs de auditoría), haz clic en +Another Log (+ otro log) y selecciona el mismo Compartment (Compartimento) y sustituye “_Auditoría” como tu Log Group (Grupo de logs).
- En Configure target (Configurar destino) selecciona Compartment (Compartimento), Function application (Aplicación de función) y Function (Función). (La Function Application (Aplicación de función) y la Function (Función) creadas en el paso anterior.)
- Si se te pide que crees una política, haz clic en Create (Crear) en la pantalla.
- Haz clic en Create (Crear) en la parte inferior para terminar de crear tu conector de servicio.
Para obtener más información sobre OCI Object Storage, consulta la entrada del blog sobre el conector de servicio de Oracle.
- Configura un log de OCI.
- Crea un almacén de objetos de OCI y habilita el acceso de lectura/escritura para logs de OCI.
- Crea una función de OCI.
- Configura un evento de OCI.
Las siguientes instrucciones utilizan el portal de OCI para configurar la integración.
Registro de OCI
- En el portal de OCI, ve a Solutions and Platform -> Logging -> Logs (Soluciones y plataforma -> Registro -> Logs).
- Haz clic en Create Custom Log (Crear log personalizado) para pasar a la página Create Custom Log (Crear log personalizado).
- Dale un nombre a tu nuevo log de OCI.
- Selecciona un Compartment (Compartimento) y un Log Group (Grupo de logs). Estas selecciones se mantienen en toda la instalación.
- Haz clic en Create Custom Log (Crear log personalizado) para acceder a la página Create Agent Config (Crear configuración del Agent).
- Haz clic en Create new configuration (Crear nueva configuración).
- Dale un nombre a tu nueva configuración. Tu compartimento está preseleccionado para ti.
- Establece el tipo de grupo en Dynamic Group (Grupo dinámico) y agrupa a uno de tus grupos existentes.
- Establece el tipo de entrada en Log Path (Ruta de log), introduce el nombre de entrada que prefieras y utiliza “/” para las rutas de los archivos.
- Haz clic en Create Custom Log (Crear log personalizado), entonces tu log de OCI se creará y estará disponible en la página de logs.
Para obtener más información sobre logs de OCI, consulta Activación del registro para un recurso.
Almacén de objetos de OCI
- En el portal de OCI, ve a Core Infrastructure -> Object Storage -> Object Storage (Infraestructura central > Almacén de objetos > Almacén de objetos).
- Haz clic en Create Bucket (Crear bucket) para acceder al formulario Create bucket (Crear bucket).
- Selecciona Standard (Estándar) para tu nivel de almacenamiento y marca Emit Object Events (Emitir eventos de objeto).
- Completa el resto del formulario según tus preferencias.
- Haz clic en Create Bucket (Crear bucket), tu bucket se creará y estará disponible en la lista de buckets.
- Selecciona tu nuevo bucket en la lista de buckets activos y haz clic en Logs en recursos.
- Activa leer, lo que te dirige a un menú lateral Habilitar log.
- Selecciona un Compartment (Compartimento) y un Log Group (Grupo de logs) (utiliza las mismas selecciones que en tu log de OCI).
- Introduce un nombre para el Log Name (Nombre de log) y selecciona tu retención de log preferida.
Para obtener más información sobre OCI Object Storage, consulta Poner datos en Object Storage.
Función de OCI
- En el portal de OCI, ve a Solutions and Platform -> Developer Services -> Functions (Soluciones y plataforma > Servicios de desarrollador > Funciones).
- Selecciona una aplicación existente o haz clic en Create Application (Crear aplicación).
- Crea una nueva función de OCI dentro de tu aplicación. Para más detalles, consulta Información general de funciones de Oracle.
- Se recomienda crear primero una función boilerplate en Python y sustituir los archivos generados automáticamente por el código fuente de Datadog:
Evento de OCI
- En el portal de OCI, ve a Solutions and Platform -> Application Integration -> Event Service (Soluciones y plataforma > Integración de aplicaciones > Servicio de eventos).
- Haz clic en Create Rule (Crear regla) para acceder a la página Create Rule (Crear regla).
- Asigna un nombre y una descripción a tu regla de evento.
- Establece tu condición como Tipo de evento, el nombre de servicio como Almacén de objetos y el tipo de evento como Objeto - Crear.
- Establece tu tipo de acción como Functions (Funciones).
- Asegúrate de que tu compartimento de función sea la misma selección que hiciste para Log de OCI, Bucket de OCI y Función de OCI.
- Selecciona tu aplicación y función (según el paso de instalación anterior).
- Haz clic en Create Rule (Crear regla), tu regla se creará y estará disponible en la lista de reglas.
Para más información sobre OCI Object Storage, consulta Empezando con eventos.
Recopilación de recursos
En la pestaña Recopilación de recursos del ícono de integración de OCI de Datadog, haz clic en el conmutador Habilitar recopilación de recursos. Los recursos son visibles en el Catálogo de recursos de Datadog.
Arquitectura
Recursos de reenvío de métricas y logs
 .
.
Para cada región monitorizada, esta opción de configuración crea la siguiente infraestructura dentro de esa región para reenviar métricas y logs a Datadog:
- Aplicación de funciones (
dd-function-app) - Dos funciones:
- Reenvío de métricas (
dd-metrics-forwarder) - Reenvío de logs (
dd-logs-forwarder)
- VCN (
dd-vcn) con infraestructura de red segura:- Subred privada (
dd-vcn-private-subnet) - Puerta NAT (
dd-vcn-natgateway) para acceso externo a Internet - Puerta de servicios (
dd-vcn-servicegateway) para el acceso interno a los servicios OCI
- Vault del Servicio de Gestión de Claves (KMS) (
datadog-vault) para almacenar la clave de la API Datadog - Compartimento dedicado Datadog (
Datadog)
Todos los recursos están etiquetados con ownedby = "datadog".
Recursos de IAM
 .
.
Esta opción de configuración crea los siguientes recursos IAM para habilitar el reenvío de datos a Datadog:
- Usuario del servicio (
dd-svc) - Grupo (
dd-svc-admin) al que pertenece el usuario del servicio - Par de claves RSA para la autenticación de la API
- Clave de la API OCI para el usuario del servicio
- Grupo dinámico (
dd-dynamic-group-connectorhubs) que incluye todos los conectores de servicio del compartimento Datadog - Grupo dinámico (
dd-dynamic-group-function) que incluye todas las funciones del compartimento de Datadog - Política (
dd-svc-policy) para dar al usuario del servicio acceso de lectura a los recursos de la tenencia y acceso para gestionar OCI Service Connector Hubs y OCI Functions en el compartimento creado y gestionado por Datadog
- Permitir que dd-svc-admin lea todos los recursos en tenencia
- Permitir que dd-svc-admin gestione conectores de servicios en el compartimento Datadog
- Permitir que dd-svc-admin gestione una familia de funciones en el compartimento Datadog con permisos específicos:
     * FN_FUNCIÓN_ACTUALIZACIÓN
     * FN_FUNCIÓN_LISTA
     * FN_APLICACIONES_LISTA
- Autorizar a dd-svc-admin a leer objetos en el informe de uso de la tenencia
- Política
dd-dynamic-group-policy para permitir que los conectores de servicio lean datos (logs y métricas) e interactúen con las funciones. Esta política también permite que las funciones lean secretos en el compartimento Datadog (la API Datadog y las claves de aplicaciones almacenadas en el vault de KMS).
   - Allow dd-dynamic-group-connectorhubs to read log-content in tenancy
   - Allow dd-dynamic-group-connectorhubs to read metrics in tenancy
   - Allow dd-dynamic-group-connectorhubs to use fn-function in Datadog compartment
   - Allow dd-dynamic-group-connectorhubs to use fn-invocation in Datadog compartment
   - Allow dd-dynamic-group-functions to read secret-bundles in Datadog compartment
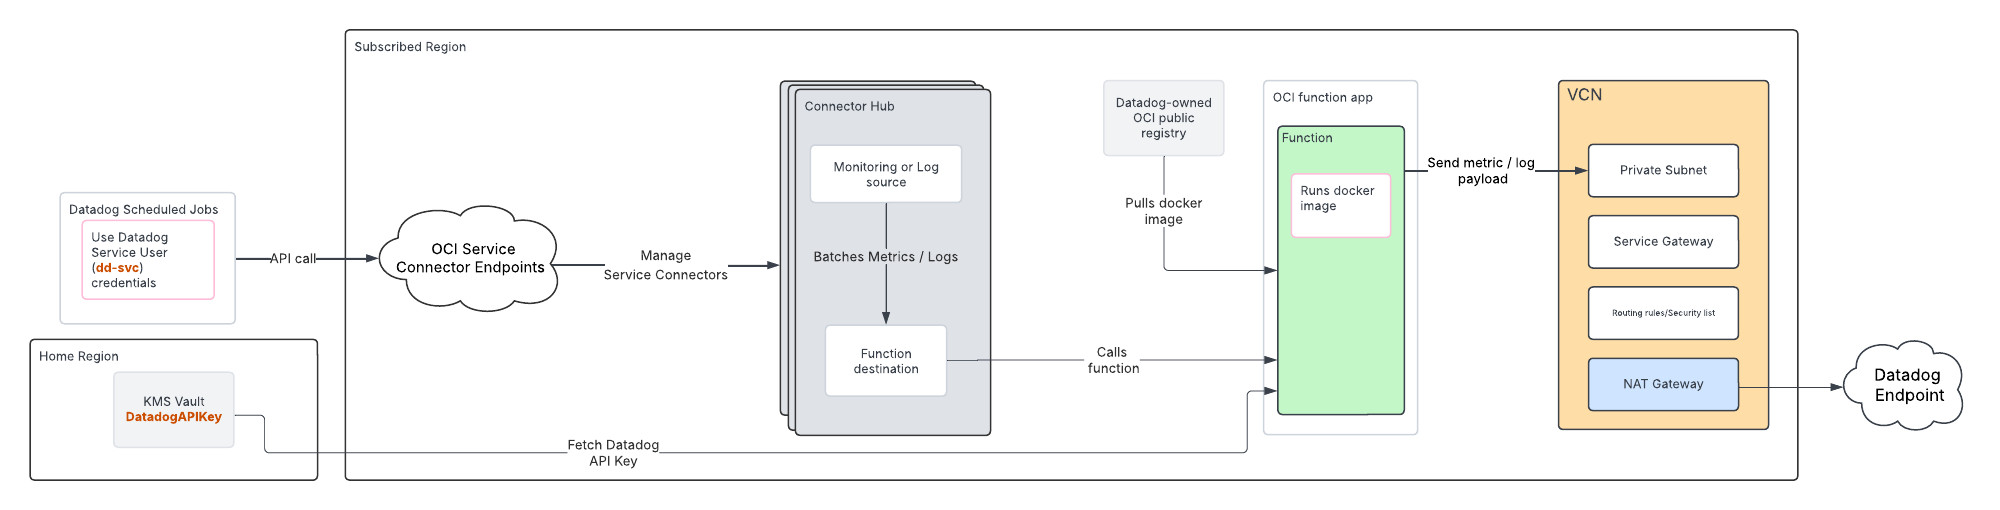
Recursos de reenvío de métricas
 .
.
Esta opción de configuración crea un hub de conectores OCI, una aplicación de función y una infraestructura de red segura para reenviar métricas OCI a Datadog. El stack tecnológico de ORM para estos recursos crea un repositorio de contenedor de función para la región en la tenencia y la imagen Docker se envía a este para ser utilizada por la función.
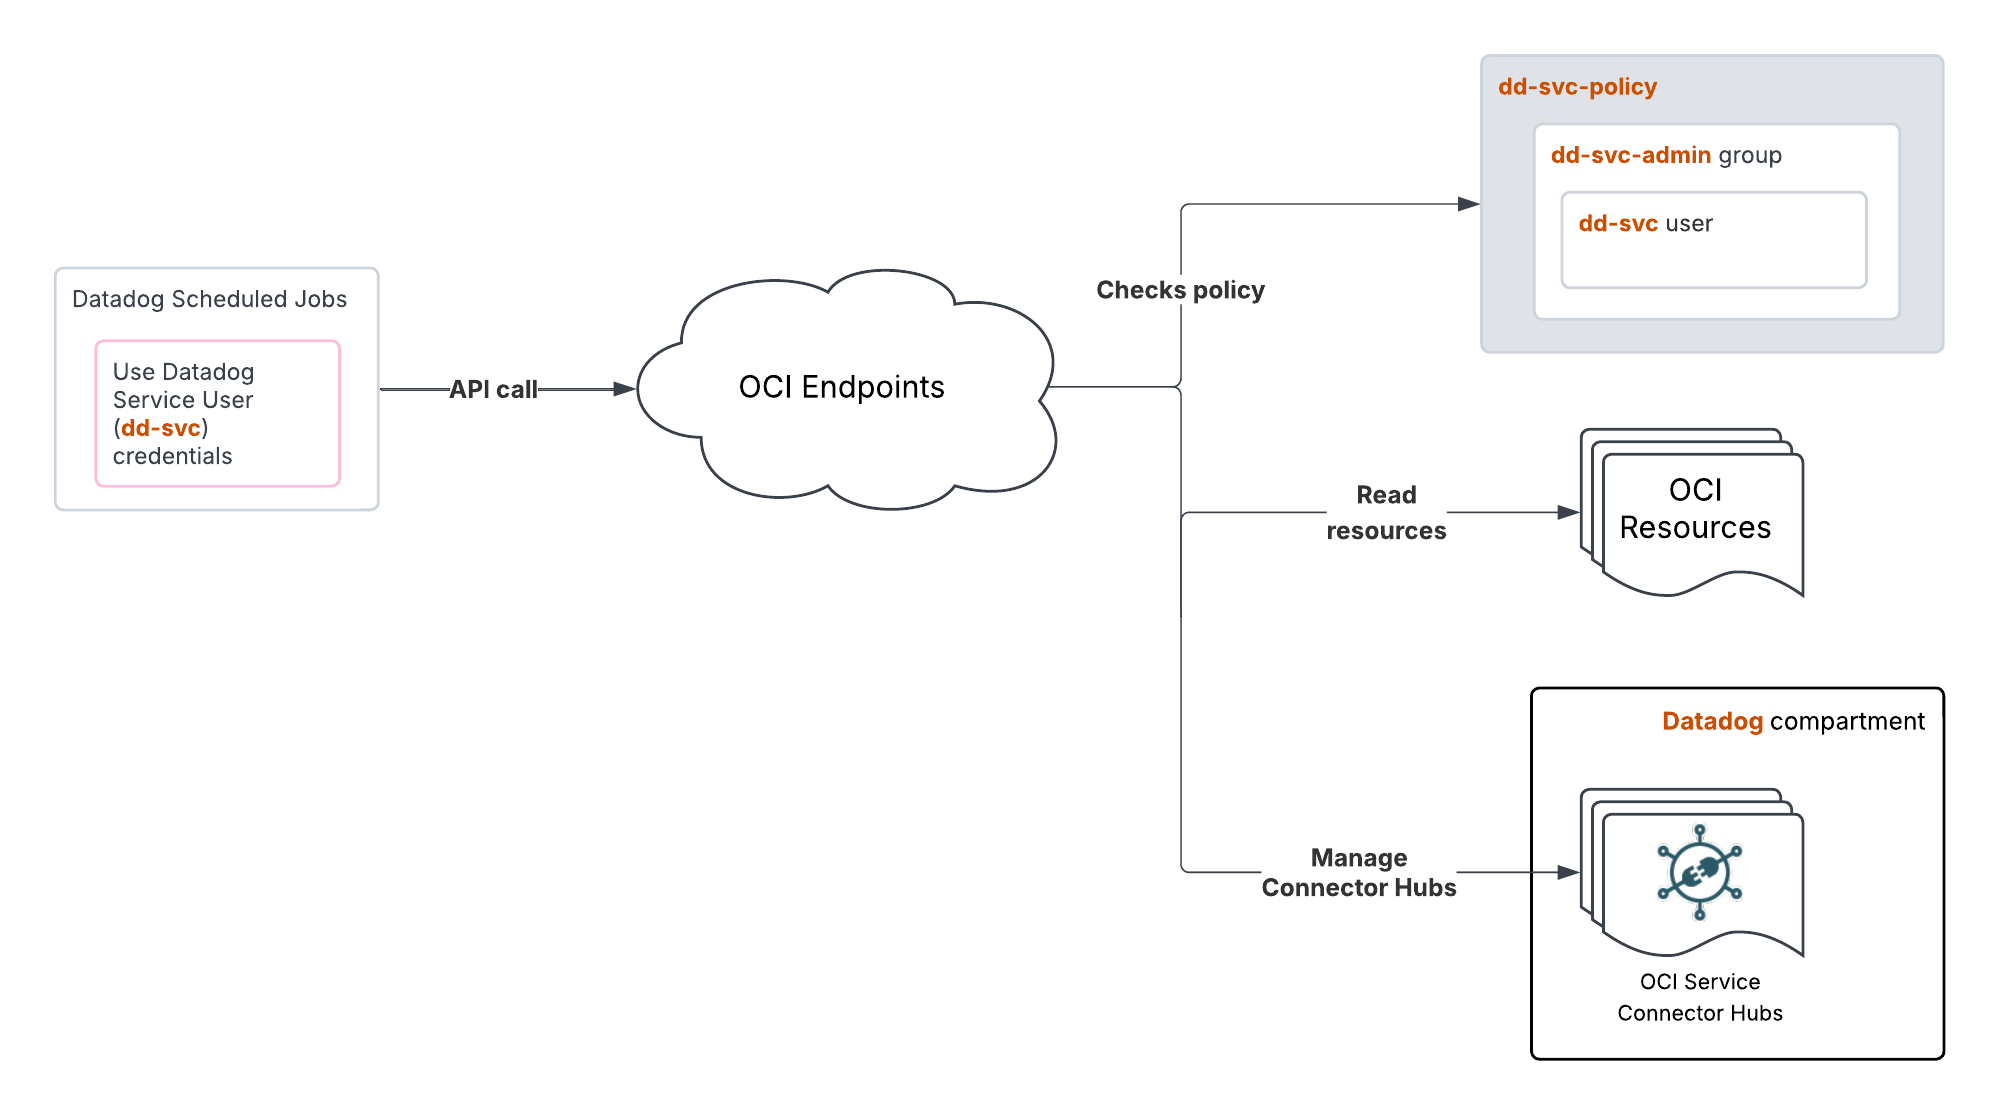
Recursos de IAM

Esta opción de configuración crea:
- Grupo dinámico con
resource.type = 'serviceconnectors', para permitir el acceso al hub de conectores - Usuario denominado DatadogROAuthUser, que Datadog utiliza para leer los recursos de la tenencia.
- Grupo al que se añade el usuario creado para el acceso a la política
- Usuario llamado DatadogAuthWriteUser, que se utiliza para insertar imágenes Docker para la función
- Grupo de acceso de escritura al que se añade
DatadogAuthWriteUser, para insertar imágenes a través de la política de acceso - Política en el compartimento raíz para permitir que los hubs de conectores lean métricas e invoquen funciones. Esta política también otorga al grupo de usuarios creado acceso de lectura tanto a los recursos de tenencia como al grupo de acceso de escritura, para insertar imágenes
Allow dynamic-group Default/<GROUP_NAME> to read metrics in tenancy
Allow dynamic-group Default/<GROUP_NAME> to use fn-function in tenancy
Allow dynamic-group Default/<GROUP_NAME> to use fn-invocation in tenancy
Allow group Default/<USER_GROUP_NAME> to read all-resources in tenancy
Allow group Default/<WRITE_USER_GROUP_NAME> to manage repos in tenancy where ANY {request.permission = 'REPOSITORY_READ', request.permission = 'REPOSITORY_UPDATE', request.permission = 'REPOSITORY_CREATE'}
Datos recopilados
Métricas
Consulta metadata.csv para obtener una lista de las métricas proporcionadas por esta integración.
Checks de servicio
La integración de OCI no incluye ningún check de servicio.
Eventos
La integración de OCI no incluye ningún evento.
Solucionar problemas
¿Necesitas ayuda? Ponte en contacto con Asistencia técnica de Datadog.
Referencias adicionales
Documentación útil adicional, enlaces y artículos: