Oracle Cloud Infrastructure

Overview

Oracle Cloud Infrastructure (OCI) is an infrastructure-as-a-service (IaaS) and platform-as-a-service (PaaS) used by enterprise-scale companies. With a full suite of managed services for hosting, storage, networking, databases, and more.

Use Datadog’s OCI integration to forward your logs and metrics to Datadog, where they can power dashboards, help with troubleshooting, and be monitored for security and compliance posture.

Setup

Metric collection

To forward your OCI metrics to Datadog, first create a Datadog auth user, group, and policy in the home region of your tenancy to enable Datadog to read data from your OCI resources. Then use Oracle Resource Manager (ORM) stacks to:

Enter tenancy info

Enter the OCID and home region of the tenancy you want to monitor in the Datadog OCI integration tile.

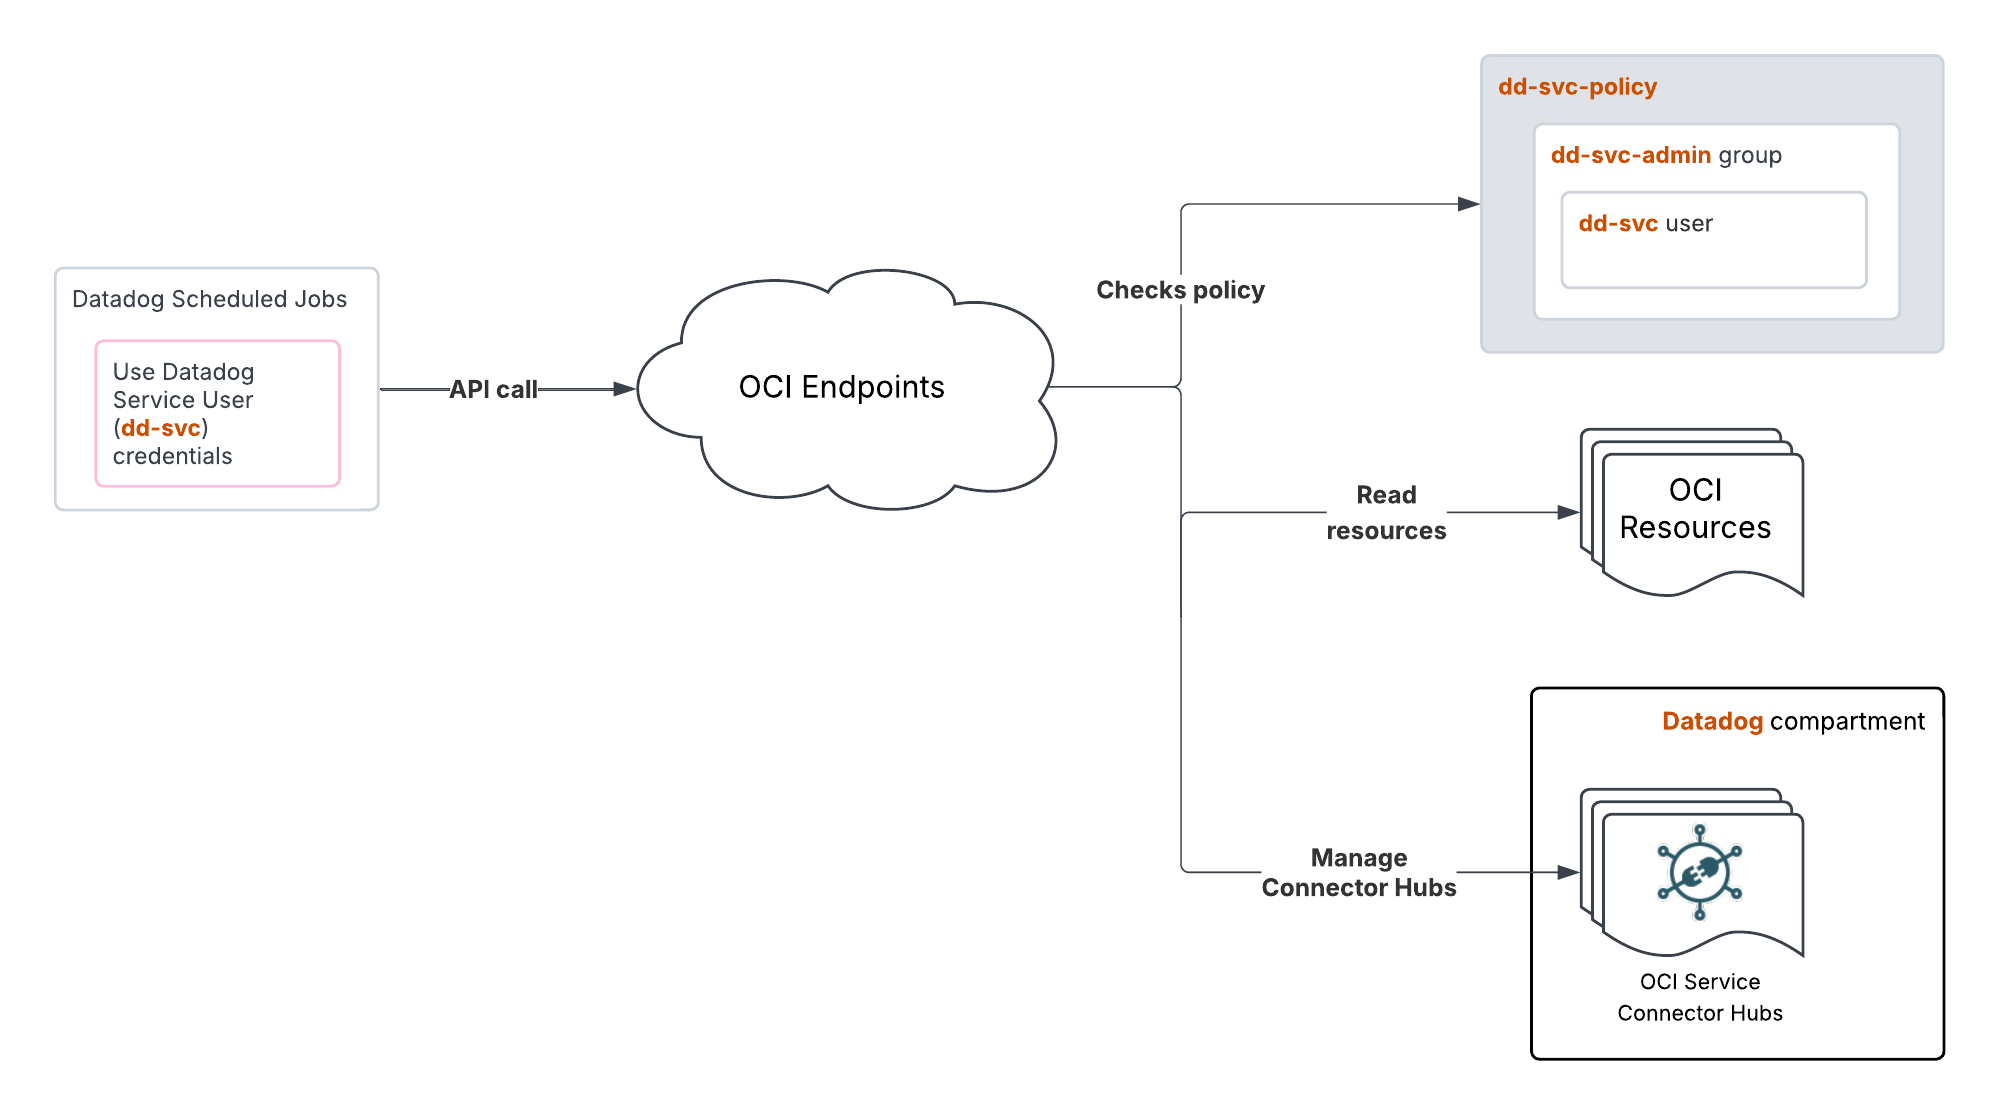
Create a Datadog auth user, group, and policy

A diagram of the OCI resources and workflow used for integration authentication

Note: Your OCI user account needs the Cloud Administrator role to complete these steps.

  1. Follow the instructions on OCI’s Creating a User page to create a user with DatadogAuthUser as the Username and Last Name.
  2. Use your email for the email of DatadogAuthUser.
  3. Click Create.
  4. Copy the user’s OCID value, and paste it into the User OCID field in the Datadog OCI integration tile.
  5. Follow the instructions on OCI’s Managing groups page to create a group and add the DatadogAuthUser.
    a. Open the To create a group section and follow the instructions to create a group with DatadogAuthGroup as its Name.
    b. Open the To add a user to a group section and follow the instructions to add DatadogAuthUser to DatadogAuthGroup.

Note: If the user and group are not created in the Default domain, ensure that the domain is replicated on all the subscribed regions of the tenancy. See Replicating an Identity Domain to Multiple Regions for more information.

  1. Follow the instructions on OCI’s Creating a policy page to create a policy that allows members of the DatadogAuthGroup to read resources in the tenancy.
    a. For the Name, enter DatadogAuthPolicy.
    b. Provide an apt description such as Policy to allow DatadogAuthUser to read tenancy resources.
    c. In the Policy Builder section, select Show manual editor and enter the following statement:

    Allow group DatadogAuthGroup to read all-resources in tenancy
    

    d. Click Create.

  2. Go to the DatadogAuthUser created previously.

  3. Copy the user’s OCID value, and paste it into the User OCID field in the Datadog OCI integration tile.

  4. Returning to the OCI console, generate an API key with these steps:
    a. Click the Profile button on the top right of the screen.
    b. Select My profile from the dropdown list.
    c. In the bottom left corner of the screen, under Resources, click API keys.
    d. Click Add API key.
    e. Click Download private key.
    f. Click Add.
    g. A Configuration file preview popup appears, but no action is needed; close the popup.

The Add API Key page in the OCI console
  1. Copy the Fingerprint value, and paste it into the Fingerprint field on the Datadog OCI integration tile.
  2. Copy the private key value with these steps:
    a. Open the downloaded private key .pem file in a text editor, or use a terminal command such as cat to display the file’s contents.
    b. Copy the value between -----BEGIN PRIVATE KEY----- and -----END PRIVATE KEY-----.
  3. Paste the private key value into the Private Key field on the Datadog OCI integration tile.

Create OCI Stacks

This integration uses an OCI connector hub, function app, and secure networking infrastructure to forward OCI metrics to Datadog.

A diagram of the OCI resources mentioned in this page and displaying the flow of data

For the simplest setup, Datadog recommends creating all the necessary OCI resources with the ORM stacks provided below. Alternatively, you can use your existing OCI networking infrastructure or function app that meets the requirements outlined in the Create a metric forwarding stack section.

Note: You should manage who has access to the Terraform state files of the resource manager stacks. See the Terraform State Files section of the Securing Resource Manager page for more information.

Create a policy stack

An ORM policy stack must be created in the home region of the tenancy. The policy stack creates a dynamic group with resource.type = 'serviceconnectors' to enable access to the connector hub. It also creates a policy in the root compartment to allow connector hubs to read metrics and invoke functions with the following statements:

Allow dynamic-group <GROUP_NAME> to read metrics in tenancy
Allow dynamic-group <GROUP_NAME> to use fn-function in tenancy
Allow dynamic-group <GROUP_NAME> to use fn-invocation in tenancy

To create the stack, your user account must be able to create dynamic groups and policies.

  1. Click the Create a stack button on the Datadog OCI integration tile.
  2. Accept the Oracle Terms of Use.
  3. In the Working directory dropdown, choose datadog-oci-orm/policy-setup.
  4. Leave the option to use custom Terraform providers unchecked.
  5. Provide a descriptive name such as datadog-metrics-policy-setup and select the compartment to deploy it to.
  6. Click Next.
  7. Name the dynamic group and policy to be created, or use the default names provided.
  8. Ensure that the home region of the tenancy is selected.
  9. Click Next.
  10. Click Create.
Create a metric forwarding stack

All resources created by this stack are deployed to the compartment specified. Ensure the user running this stack has access to create resources in the compartment.

  1. Go to Create stack in the OCI console.
  2. Accept the Oracle Terms of Use.
  3. In the Working directory dropdown, choose datadog-oci-orm/metrics-setup.
  4. Leave the option to use custom Terraform providers unchecked.
  5. Name the stack and select the compartment to deploy it to.
  6. Click Next.
  7. Leave Tenancy values unmodified, as these are specified by your current region and tenant, as well as the compartment selected previously.
  8. In the Datadog API Key field, enter your Datadog API key.
  9. In the Datadog Environment Endpoint field, select the endpoint that matches your Datadog site:
Datadog siteEndpoint
US1ocimetrics-intake.datadoghq.com
US3ocimetrics-intake.us3.datadoghq.com
US5ocimetrics-intake.us5.datadoghq.com
EU1ocimetrics-intake.datadoghq.eu
AP1ocimetrics-intake.ap1.datadoghq.com
  1. In the Network options section, leave Create VCN checked.
    a. In the vcnCompartment field, select your compartment.

If using an existing VCN, the subnet’s OCID must be provided to the stack. Make sure that the VCN:

  • Is allowed to make HTTP egress calls through NAT gateway.
  • Is able to pull images from OCI container registry using service gateway.
  • Has the route table rules to allow NAT gateway and service gateway.
  • Has the security rules to send HTTP requests.
  1. In the Network options section, uncheck the Create VCN option and enter your VCN information:
    a. In the vcnCompartment field, select your compartment.
    b. In the existingVcn section, select your existing VCN.
    c. In the Function Subnet OCID section, enter the OCID of the subnet to be used.

The ORM stack creates a function container repository for the region in the tenancy, and the Docker image is pushed to it to be used by the function.

  1. Complete the following steps in the Function settings section:
    a. In the Function Application shape field, leave the value as GENERIC_ARM.
    b. In the OCI Docker registry user name field, provide an OCI Docker registry username. See Logging in to Oracle Cloud Infrastructure Registry for more information about creating an OCI docker registry username. c. In the OCI Docker registry password field, provide an auth token. See Getting an Auth Token for more information.

If using an existing function application, the image must already exist and the full image path must be provided. Below is an example of a full image path:

<REGION_KEY>.ocir.io/<TENANCY_NAMESPACE>/datadog-functions/datadog-function-metrics:latest
  1. Complete the following steps in the Function settings section:
    a. In the Function Application shape field, leave the value as GENERIC_ARM.
    b. In the Function Image Path field, enter the full image path.
  1. Set the Service Connector hub batch size to 5000.
  2. Click Next.
  3. Click Create.
  4. Return to the Datadog OCI integration tile and click Create configuration.

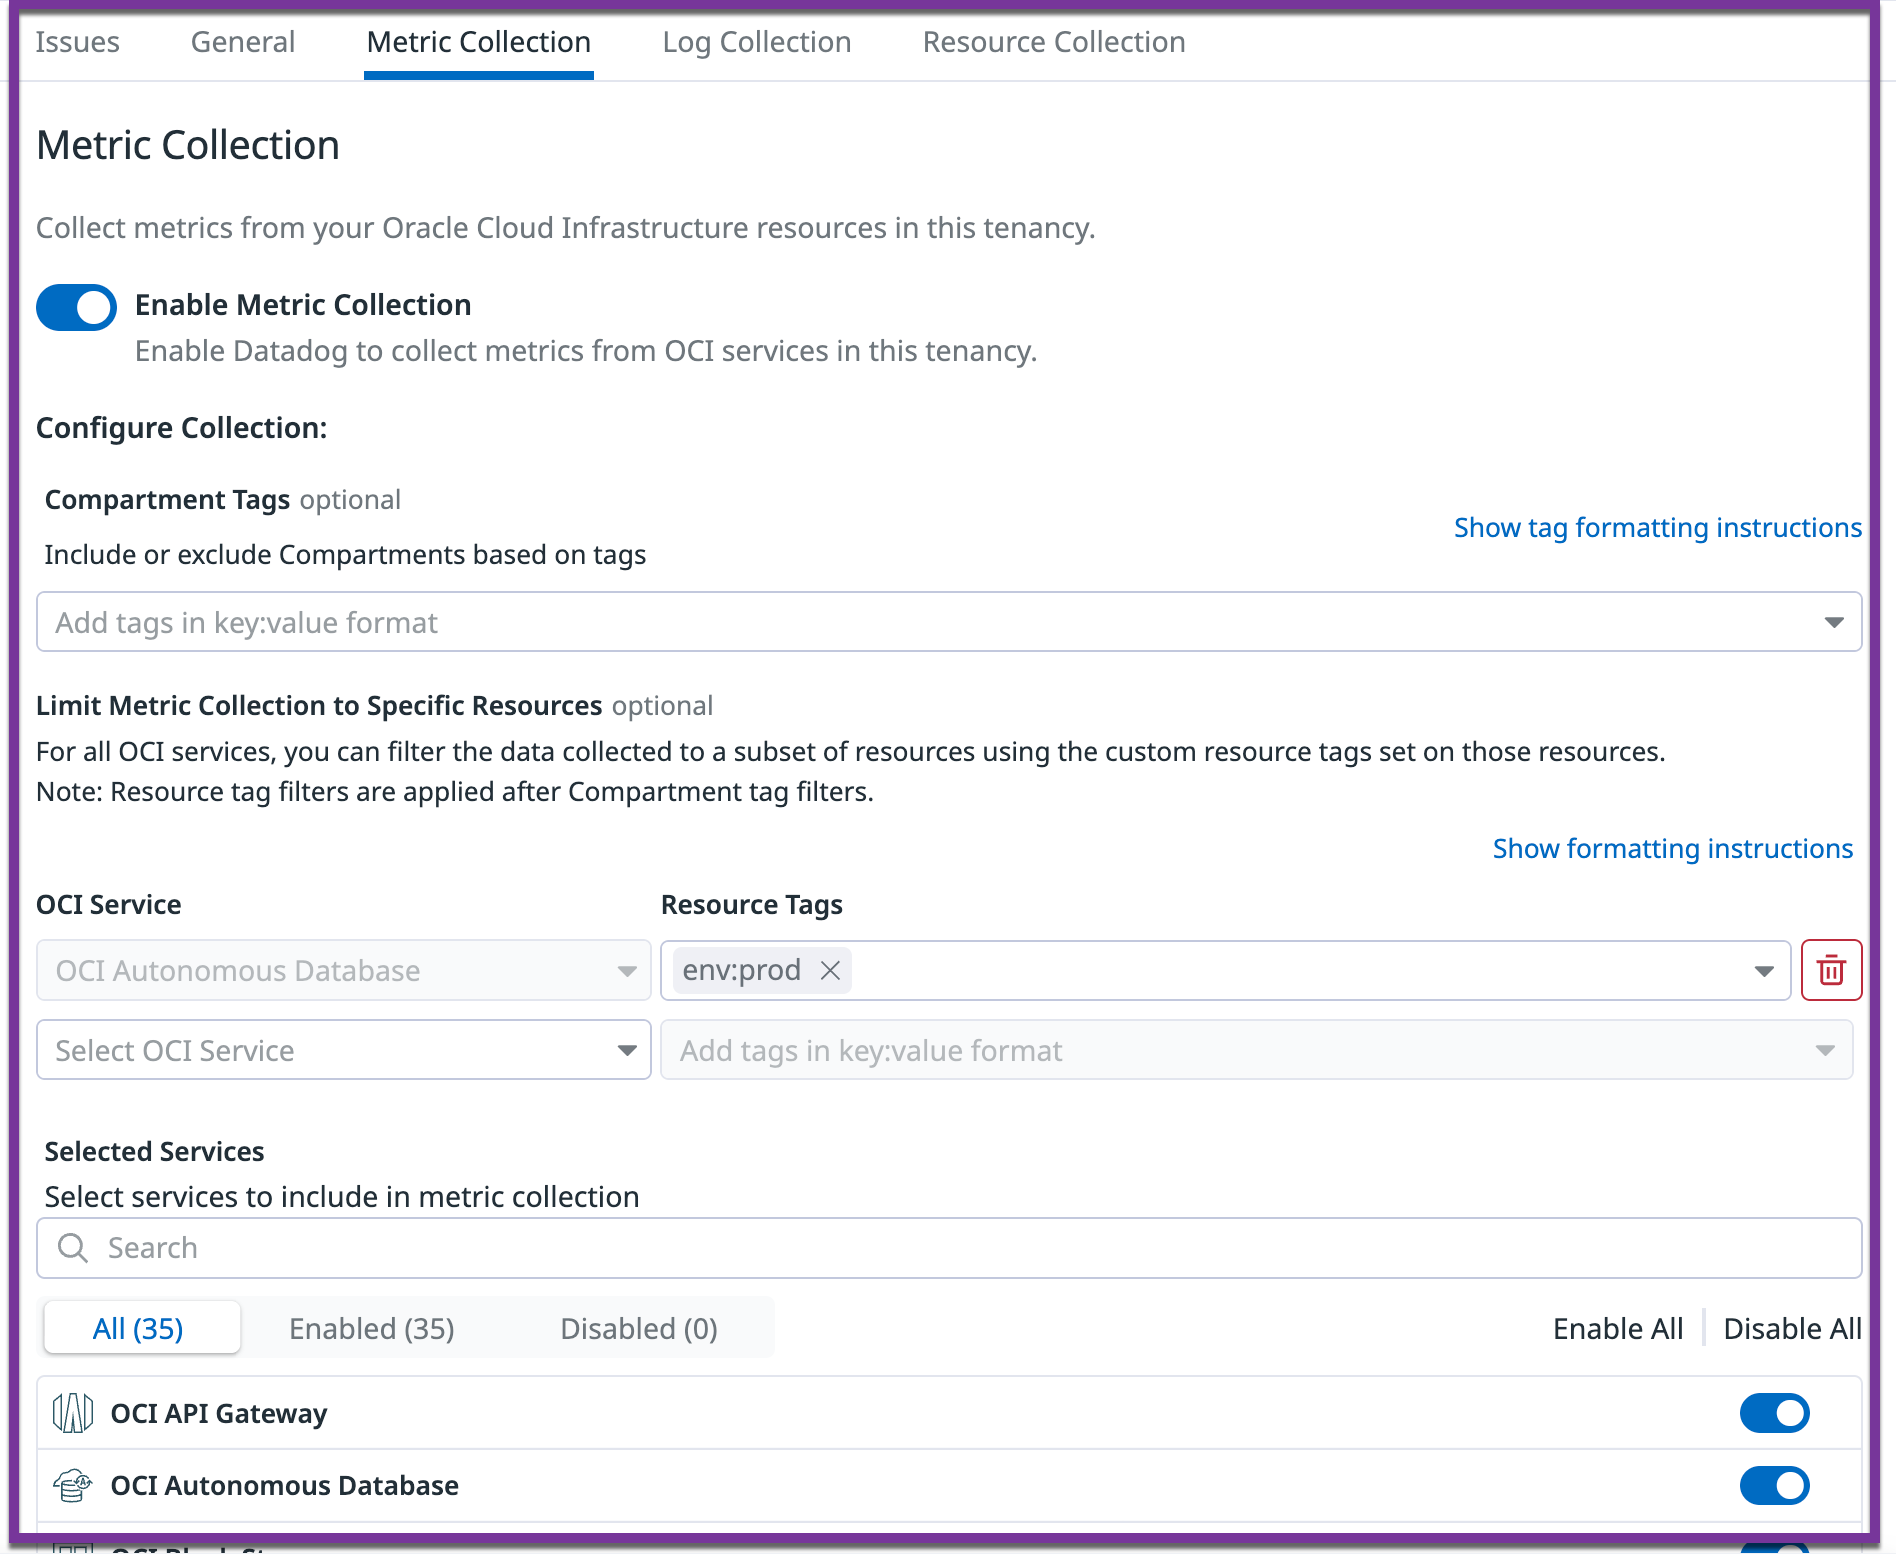
Note: By default, only the root compartment is selected, and all of the metric namespaces supported by the Datadog OCI integration are enabled (up to 50 namespaces are supported per connector hub).

  1. Optionally, to add compartments or edit the list of metric namespaces enabled, click Edit on the newly created Connector Hub.
    • Click + Another compartment to add compartments.
    • In the Configure source section, add or remove namespaces from the Namespaces dropdown.

Validation

View oci.* metrics in the OCI integration overview dashboard or Metrics Explorer page in Datadog.

OCI function metrics (oci.faas namespace) and container instance metrics (oci_computecontainerinstance namespace) are in beta.

Metric namespaces

IntegrationMetric Namespace
Autonomous Databaseoci_autonomous_database
Block Storageoci_blockstore
Computeoci_computeagent, rdma_infrastructure_health, gpu_infrastructure_health, oci_compute_infrastructure_health
Container Instances (Beta)oci_computecontainerinstance
Databaseoci_database, oci_database_cluster
Dynamic Routing Gatewayoci_dynamic_routing_gateway
FastConnectoci_fastconnect
File Storageoci_filestorage
Functions (Beta)oci_faas
HeatWave MySQLoci_mysql_database
Kubernetes Engineoci_oke
Load Balanceroci_lbaas, oci_nlb
NAT Gatewayoci_nat_gateway
Object Storageoci_objectstorage
Queueoci_queue
Service Connector Huboci_service_connector_hub
Service Gatewayoci_service_gateway
VCNoci_vcn
VPNoci_vpn
Web Application Firewalloci_waf

Log collection

Send logs from your Oracle Cloud Infrastructure to Datadog by following either process:

  1. Configure an OCI log.
  2. Create an OCI function.
  3. Setup an OCI Service Connector.

The instructions below use the OCI portal to set up the integration.

OCI logging

  1. In the OCI portal, navigate to Logging -> Log Groups.
  2. Select your compartment and click Create Log Group. A side panel opens.
  3. Enter data_log_group for the name, and optionally provide a description and tags.
  4. Click Create to set up your new Log Group.
  5. Under Resources, click Logs.
  6. Click to Create custom log or Enable service log as desired.
  7. Click Enable Log, to create your new OCI Log.

For more information on OCI Logs, see Enabling Logging for a Resource.

OCI function

  1. In the OCI portal, navigate to Functions.
  2. Select an existing application or click Create Application.
  3. Create a new OCI function within your application. See the Oracle Overview of Functions for details.
  4. It is recommended to create a boilerplate Python function first and replace the auto generated files with Datadog’s source code:
    • Replace func.py with code from the Datadog OCI repo.
    • Replace func.yaml with code from the Datadog OCI repo. DATADOG_TOKEN and DATADOG_HOST must be replaced with your Datadog API key and region logs intake link.
    • Replace requirements.txt with code from the Datadog OCI repo.

OCI service connector hub

  1. In the OCI portal, navigate to Logging -> Service Connectors.
  2. Click Create Service Connector to be directed to the Create Service Connector page.
  3. Select the Source as Logging and Target as Functions.
  4. Under Configure Source Connection select a Compartment name, Log Group, and Log. (The Log Group and Log created in the first step)
  5. If you also want to send Audit Logs, click +Another Log and select the same Compartment while replacing “_Audit” as your Log Group.
  6. Under Configure target select a Compartment, Function application, and Function. (The Function Application and Function created in the previous step)
  7. If you are prompted to create a policy, click Create from the prompt.
  8. Click Create at the bottom to finish creating your Service Connector.

For more information on OCI Object Storage, see Oracle’s Service Connector blog post.

  1. Configure an OCI log.
  2. Create an OCI object store and enable read/write access for OCI logs.
  3. Create an OCI function.
  4. Set up an OCI event.

The instructions below use the OCI portal to set up the integration.

OCI logging

  1. In the OCI portal, navigate to Solutions and Platform -> Logging -> Logs.
  2. Click Create Custom Log to be directed to the Create Custom Log page.
  3. Give your new OCI log a name.
  4. Select a Compartment and Log Group. These selections remain consistent across the entire installation.
  5. Click Create Custom Log to be directed to the Create Agent Config page.
  6. Click Create new configuration.
  7. Give your new configuration a name. Your compartment is preselected for you.
  8. Set the group type to Dynamic Group and group to one of your existing groups.
  9. Set the input type to Log Path, enter your preferred input name and use “/” for file paths.
  10. Click Create Custom Log, then your OCI log is created and available on the logs page.

For more information on OCI Logs, see Enabling Logging for a Resource.

OCI object storage

  1. In the OCI portal, navigate to Core Infrastructure -> Object Storage -> Object Storage.
  2. Click Create Bucket to be directed to the Create Bucket form.
  3. Select Standard for your storage tier and check Emit Object Events.
  4. Complete the rest of the form based on your preference.
  5. Click Create Bucket, then your bucket is created and available in the bucket list.
  6. Select your new bucket from the active bucket list and click Logs under resources.
  7. Toggle read to enabled which directs you to an Enable Log side menu.
  8. Select a Compartment and Log Group (use the same selections as your OCI log).
  9. Enter a name for the Log Name and select your preferred log retention.

For more information on OCI Object Storage, see Putting Data into Object Storage.

OCI function

  1. In the OCI portal, navigate to Solutions and Platform -> Developer Services -> Functions.
  2. Select an existing application or click Create Application.
  3. Create a new OCI function within your application. See the Oracle Overview of Functions for more details.
  4. It is recommended to create a boilerplate Python function first and replace the auto generated files with Datadog’s source code:
    • Replace func.py with code from the Datadog OCI repo.
    • Replace func.yaml with code from the Datadog OCI repo. DATADOG_TOKEN and DATADOG_HOST must be replaced with your Datadog API key and region logs intake link.
    • Replace requirements.txt with code from the Datadog OCI repo.

OCI event

  1. In the OCI portal, navigate to Solutions and Platform -> Application Integration -> Event Service.
  2. Click Create Rule to be directed to the Create Rule page.
  3. Give your event rule a name and description.
  4. Set your condition as Event Type, service name as Object Storage, and event type as Object - Create.
  5. Set your action type as Functions.
  6. Ensure that your function compartment is the same selection you made for OCI Log, OCI Bucket, and OCI Function.
  7. Select your function application and function (according to the previous installation step.)
  8. Click Create Rule, then your rule is created and available in the rules list.

For more information on OCI Object Storage, see Getting Started with Events.

Data Collected

Metrics

oci.autonomous_database.apply_lag
(gauge)
This metric displays (in seconds) how far the standby database is behind the primary database as of the time sampled.
Shown as second
oci.autonomous_database.block_changes
(gauge)
The average number of blocks changed per second.
Shown as update
oci.autonomous_database.cpu_time
(gauge)
Average rate of accumulation of CPU time by foreground sessions in the database over the time interval. Statistic: Mean. Interval: 1 minute
Shown as second
oci.autonomous_database.cpu_utilization
(gauge)
The CPU usage expressed as a percentage, aggregated across all consumer groups. The utilization percentage is reported with respect to the number of CPUs the database is allowed to use. Statistic: Mean. Interval: 1 minute
Shown as percent
oci.autonomous_database.current_logons
(count)
The number of successful logons during the selected interval. Statistic: Count. Interval: 1 minute
Shown as operation
oci.autonomous_database.dbtime
(gauge)
The amount of time database user sessions spend executing database code (CPU Time + WaitTime). DB Time is used to infer database call latency, because DB Time increases in direct proportion to both database call latency (response time) and call volume. It is calculated as the average rate of accumulation of database time by foreground sessions in the database over the time interval.
Shown as second
oci.autonomous_database.ecpus_allocated
(gauge)
The actual number of ECPUs allocated by the service during the selected interval of time.
Shown as cpu
oci.autonomous_database.execute_count
(count)
The number of user and recursive calls that executed SQL statements during the selected interval. Statistic: Sum. Interval: 1 minute
Shown as execution
oci.autonomous_database.iops
(gauge)
The average number of I/O operations per second.
Shown as operation
oci.autonomous_database.iothroughput
(gauge)
The average throughput in MB per second.
Shown as megabyte
oci.autonomous_database.logical_blocks_read
(gauge)
The average number of logical block reads ("db block gets" plus "consistent gets") per second. Includes buffered and direct I/O. Statistic: Sum. Interval: 1 minute
Shown as read
oci.autonomous_database.ocpus_allocated
(gauge)
The actual number of OCPUs allocated by the service during the selected interval of time.
Shown as cpu
oci.autonomous_database.parse_count
(count)
The number of hard and soft parses during the selected interval. Statistic: Sum. Interval: 1 minute
Shown as event
oci.autonomous_database.parses_by_type
(count)
The number of hard or soft parses per second.
Shown as event
oci.autonomous_database.queued_statements
(count)
The number of queued SQL statements, aggregated across all consumer groups, during the selected interval. Statistic: Sum. Interval: 1 minute
Shown as execution
oci.autonomous_database.redo_size
(gauge)
The average amount of redo generated in MB per second.
Shown as megabyte
oci.autonomous_database.running_statements
(count)
The number of running SQL statements, aggregated across all consumer groups, during the selected interval. Statistic: Mean. Interval: 1 minute
Shown as execution
oci.autonomous_database.sessions
(count)
The number of sessions in the database. Statistic: Sum. Interval: 1 minute
Shown as session
oci.autonomous_database.storage_allocated
(gauge)
Maximum amount of space allocated to the database during the interval. Statistic: Max. Interval: 1 hour
Shown as gigabyte
oci.autonomous_database.storage_allocated_by_tablespace
(gauge)
Maximum amount of space allocated for each tablespace during the interval.
Shown as gigabyte
oci.autonomous_database.storage_used
(gauge)
Maximum amount of space used during the interval. Statistic: Max. Interval: 1 hour
Shown as gigabyte
oci.autonomous_database.storage_used_by_tablespace
(gauge)
Maximum amount of space used by each tablespace during the interval.
Shown as gigabyte
oci.autonomous_database.storage_utilization
(gauge)
The percentage of provisioned storage capacity currently in use. Represents the total allocated space for all tablespaces. Statistic: Mean. Interval: 1 hour
Shown as percent
oci.autonomous_database.storage_utilization_by_tablespace
(gauge)
The percentage of space utilized by each tablespace.
Shown as percent
oci.autonomous_database.transaction_count
(count)
The combined number of user commits and user rollbacks during the selected interval. Statistic: Sum. Interval: 1 minute
Shown as event
oci.autonomous_database.transactions_by_status
(count)
The number of committed or rolled back transactions per second.
Shown as transaction
oci.autonomous_database.transport_lag
(gauge)
The approximate number of seconds of redo not yet available on the standby database as of the time sampled.
Shown as second
oci.autonomous_database.user_calls
(count)
The combined number of logons, parses, and execute calls during the selected interval. Statistic: Sum. Interval: 1 minute
Shown as event
oci.autonomous_database.wait_time
(gauge)
Average rate of accumulation of non-idle wait time by foreground sessions in the database over the time interval. Statistic: Mean. Interval: 1 minute
Shown as second
oci.database.block_changes
(gauge)
The Average number of blocks changed per second.
Shown as update
oci.database.cpu_utilization
(gauge)
The CPU utilization expressed as a percentage, aggregated across all consumer groups. The utilization percentage is reported with respect to the number of CPUs the database is allowed to use, which is two times the number of OCPUs.
Shown as percent
oci.database.current_logons
(count)
The number of successful logons during the selected interval.
oci.database.execute_count
(count)
The number of user and recursive calls that executed SQL statements during the selected interval.
oci.database.parse_count
(count)
The number of hard and soft parses during the selected interval.
oci.database.storage_allocated
(gauge)
Total amount of storage space allocated to the database at the collection time.
Shown as gigabyte
oci.database.storage_allocated_by_tablespace
(gauge)
Total amount of storage space allocated to the tablespace at the collection time. In case of container database, this metric provides root container tablespaces.
Shown as gigabyte
oci.database.storage_used
(gauge)
Total amount of storage space used by the database at the collection time.
Shown as gigabyte
oci.database.storage_used_by_tablespace
(gauge)
Total amount of storage space used by tablespace at the collection time. In case of container database, this metric provides root container tablespaces.
Shown as gigabyte
oci.database.storage_utilization
(gauge)
The percentage of provisioned storage capacity currently in use. Represents the total allocated space for all tablespaces.
Shown as percent
oci.database.storage_utilization_by_tablespace
(gauge)
This indicates the percentage of storage space utilized by the tablespace at the collection time. In case of container database, this metric provides root container tablespaces.
Shown as percent
oci.database.transaction_count
(count)
The combined number of user commits and user rollbacks during the selected interval.
Shown as transaction
oci.database.user_calls
(count)
The combined number of logons, parses, and execute calls during the selected interval.
oci.database_cluster.asmdiskgroup_utilization
(gauge)
Percentage of usable space used in a Disk Group. Usable space is the space available for growth. DATA disk group stores our Oracle database files. RECO disk group contains database files for recovery such as archives and flashback logs.
Shown as percent
oci.database_cluster.cpu_utilization
(gauge)
Percent CPU utilization.
Shown as percent
oci.database_cluster.filesystem_utilization
(gauge)
Percent utilization of provisioned filesystem.
Shown as percent
oci.database_cluster.load_average
(gauge)
System load average over 5 minutes.
Shown as process
oci.database_cluster.memory_utilization
(gauge)
Percentage of memory available for starting new applications, without swapping. The available memory can be obtained via the following command: cat/proc/meminfo.
Shown as percent
oci.database_cluster.node_status
(gauge)
Indicates whether the host is reachable in RAC environments.
oci.database_cluster.ocpus_allocated
(gauge)
The number of OCPUs allocated.
Shown as cpu
oci.database_cluster.swap_utilization
(gauge)
Percent utilization of total swap space.
Shown as percent
oci.blockstore.volume_guaranteed_iops
(gauge)
Rate of change for guaranteed IOPS per SLA. Expressed as the average of guaranteed IOPS during a given time interval.
Shown as operation
oci.blockstore.volume_guaranteed_throughput
(gauge)
Rate of change for guaranteed throughput per SLA. Expressed as megabytes per interval.
Shown as megabyte
oci.blockstore.volume_guaranteed_vpus_per_gb
(gauge)
Rate of change for currently active VPUs/GB. Expressed as the average of active VPUs/GB during a given time interval.
Shown as operation
oci.blockstore.volume_read_ops
(count)
Activity level from I/O reads. Expressed as reads per interval.
Shown as operation
oci.blockstore.volume_read_throughput
(gauge)
Read throughput. Expressed as bytes read per interval.
Shown as byte
oci.blockstore.volume_replication_seconds_since_last_sync
(gauge)
Time elapsed since the last synced cross region replica. Expressed in seconds.
Shown as second
oci.blockstore.volume_replication_seconds_since_last_upload
(gauge)
Time elapsed since the last cross region replica was uploaded. Expressed in seconds.
Shown as second
oci.blockstore.volume_throttled_ios
(count)
Total sum of all the I/O operations that were throttled during a given time interval.
Shown as operation
oci.blockstore.volume_write_ops
(count)
Activity level from I/O writes. Expressed as writes per interval.
Shown as operation
oci.blockstore.volume_write_throughput
(gauge)
Write throughput. Expressed as bytes written per interval.
Shown as byte
oci.gpu_infrastructure_health.gpu_ecc_double_bit_errors
(count)
The number of GPU double bit ECC errors reported.
Shown as error
oci.gpu_infrastructure_health.gpu_ecc_single_bit_errors
(count)
The number of GPU single bit ECC errors reported.
Shown as error
oci.gpu_infrastructure_health.gpu_memory_utilization
(gauge)
The percentage of the GPU memory resource in use.
Shown as percent
oci.gpu_infrastructure_health.gpu_power_draw
(gauge)
The amount of GPU power used.
oci.gpu_infrastructure_health.gpu_temperature
(gauge)
The GPU temperature reported.
oci.gpu_infrastructure_health.gpu_utilization
(gauge)
Activity level from GPU. Expressed as a percentage of total time. For instance pools, the value is averaged across all instances in the pool.
Shown as percent
oci.computeagent.cpu_utilization
(gauge)
Activity level from CPU. Expressed as a percentage of total time. For instance pools, the value is averaged across all instances in the pool.
Shown as percent
oci.computeagent.disk_bytes_read
(count)
Read throughput. Expressed as bytes read per interval.
Shown as byte
oci.computeagent.disk_bytes_written
(count)
Write throughput. Expressed as bytes written per interval.
Shown as byte
oci.computeagent.disk_iops_read
(count)
Activity level from I/O reads. Expressed as reads per interval.
Shown as operation
oci.computeagent.disk_iops_written
(count)
Activity level from I/O writes. Expressed as writes per interval.
Shown as operation
oci.computeagent.load_average
(gauge)
Average system load calculated over a 1-minute period.
Shown as process
oci.computeagent.memory_allocation_stalls
(count)
Number of times page reclaim was called directly.
oci.computeagent.memory_utilization
(gauge)
Space currently in use. Measured by pages. Expressed as a percentage of used pages. For instance pools, the value is averaged across all instances in the pool.
Shown as percent
oci.computeagent.networks_bytes_in
(count)
Network receipt throughput. Expressed as bytes received.
Shown as byte
oci.computeagent.networks_bytes_out
(count)
Network transmission throughput. Expressed as bytes transmitted.
Shown as byte
oci.rdma_infrastructure_health.rdma_rx_bytes
(count)
The bytes received on the RDMA interface.
Shown as byte
oci.rdma_infrastructure_health.rdma_rx_packets
(count)
The number of RDMA interface packets received.
Shown as packet
oci.rdma_infrastructure_health.rdma_tx_bytes
(count)
The bytes transmitted on the RDMA interface.
Shown as byte
oci.rdma_infrastructure_health.rdma_tx_packets
(count)
The number of RDMA interface packets transmitted.
Shown as packet
oci.compute_infrastructure_health.health_status
(count)
The number of health issues for an instance. Any non-zero value indicates a health defect. This metric is available only for bare metal instances.
Shown as error
oci.compute_infrastructure_health.instance_status
(gauge)
The status of a running instance. A value of 0 indicates that the instance is available (up). A value of 1 indicates that the instance is not available (down) due to an infrastructure issue. If the instance is stopped, then the metric does not have a value. This metric is available only for VM instances.
Shown as instance
oci.compute_infrastructure_health.maintenance_status
(gauge)
The maintenance status of an instance. A value of 0 indicates that the instance is not scheduled for an infrastructure maintenance event. A value of 1 indicates that the instance is scheduled for an infrastructure maintenance event. This metric is available for both VM and bare metal instances.
Shown as instance
oci.oracle_oci_database.allocated_storage_utilization_by_tablespace
(gauge)
The percentage of space used by a tablespace, out of allocated space.
Shown as percent
oci.oracle_oci_database.apply_lag
(gauge)
The number of seconds the standby database is behind the primary database. Statistic: Mean Interval: 5 minutes Resource group: oracle_dataguard Not applicable for PDBs.
Shown as second
oci.oracle_oci_database.apply_lag_data_refresh_elapsed_time
(gauge)
The elapsed time since the ApplyLag metric sample was last collected. Statistic: Mean Interval: 5 minutes Resource group: oracle_dataguard Not applicable for PDBs.
Shown as second
oci.oracle_oci_database.avg_gc_cr_block_receive_time
(gauge)
The average global cache consistent-read (CR) block receive time.
Shown as millisecond
oci.oracle_oci_database.backup_duration
(gauge)
The duration of the last database backup. Statistic: Mean Interval: 30 minutes Only applicable for SI and RAC CDBs.
Shown as second
oci.oracle_oci_database.backup_size
(gauge)
The size of the last database backup. Statistic: Mean Interval: 30 minutes Only applicable for SI and RAC CDBs.
Shown as gigabyte
oci.oracle_oci_database.block_changes
(gauge)
The average number of blocks changed per second.
Shown as update
oci.oracle_oci_database.blocking_sessions
(gauge)
The current blocking sessions.
oci.oracle_oci_database.cputime
(gauge)
The average rate of accumulation of CPU time by foreground sessions in the database instance over the time interval. The CPU time component of Average Active Sessions.
Shown as fraction
oci.oracle_oci_database.cpu_utilization
(gauge)
The CPU utilization expressed as a percentage, aggregated across all consumer groups. The utilization percentage is reported with respect to the number of CPUs the database is allowed to use, which is two times the number of OCPUs.
Shown as percent
oci.oracle_oci_database.current_logons
(count)
The number of successful logons during the selected interval.
oci.oracle_oci_database.dbtime
(gauge)
The average rate of accumulation of database time (CPU + Wait) by foreground sessions in the database instance over the time interval. Also known as Average Active Sessions.
Shown as fraction
oci.oracle_oci_database.estimated_failover_time
(gauge)
The number of seconds required to fail over to the standby database. Statistic: Mean. Interval: 5 minutes. Resource group: oracle_dataguard. Not applicable for PDBs.
Shown as second
oci.oracle_oci_database.execute_count
(count)
The number of user and recursive calls that executed SQL statements during the selected interval.
Shown as execution
oci.oracle_oci_database.fraspace_limit
(gauge)
The flash recovery area space limit.
Shown as gigabyte
oci.oracle_oci_database.frautilization
(gauge)
The flash recovery area utilization.
Shown as percent
oci.oracle_oci_database.gc_cr_blocks_received
(gauge)
The global cache CR blocks received per second.
Shown as block
oci.oracle_oci_database.gc_current_blocks_received
(gauge)
The global cache current blocks received per second.
Shown as block
oci.oracle_oci_database.iops
(gauge)
The average number of IO operations per second.
Shown as operation
oci.oracle_oci_database.io_throughput
(gauge)
The average throughput in MB per second.
Shown as megabyte
oci.oracle_oci_database.interconnect_traffic
(gauge)
The average internode data transfer rate.
Shown as megabyte
oci.oracle_oci_database.invalid_objects
(gauge)
The number of invalid database objects.
oci.oracle_oci_database.logical_blocks_read
(gauge)
The average number of blocks read from SGA/Memory (buffer cache) per second.
Shown as read
oci.oracle_oci_database.max_tablespace_size
(gauge)
The maximum possible tablespace size. For CDBs, this metric provides data for root container tablespaces.
Shown as gigabyte
oci.oracle_oci_database.memory_usage
(gauge)
The total size of the memory pool.
Shown as megabyte
oci.oracle_oci_database.monitoring_status
(gauge)
The monitoring status of the resource. If a metric collection fails, error information is captured in this metric.
oci.oracle_oci_database.non_reclaimable_fra
(gauge)
The non-reclaimable fast recovery area.
Shown as percent
oci.oracle_oci_database.ocpus_allocated
(count)
The actual number of OCPUs allocated by the service during the selected interval of time.
oci.oracle_oci_database.parse_count
(count)
The number of hard and soft parses during the selected interval.
oci.oracle_oci_database.parses_by_type
(gauge)
The number of hard or soft parses per second.
Shown as event
oci.oracle_oci_database.problematic_scheduled_dbmsjobs
(gauge)
The number of problematic scheduled database jobs.
Shown as job
oci.oracle_oci_database.process_limit_utilization
(gauge)
The process limit utilization.
Shown as percent
oci.oracle_oci_database.processes
(gauge)
The number of database processes.
Shown as process
oci.oracle_oci_database.reclaimable_fra
(gauge)
The reclaimable fast recovery area.
Shown as percent
oci.oracle_oci_database.reclaimable_fraspace
(gauge)
The flash recovery area reclaimable space.
Shown as gigabyte
oci.oracle_oci_database.recovery_window
(gauge)
The current recovery window of a database. Statistic: Mean. Interval: 15 minutes. Only applicable for SI and RAC CDBs version 19c and later.
Shown as second
oci.oracle_oci_database.redo_apply_rate
(gauge)
The redo apply rate on the standby database. Statistic: Mean. Interval: 5 minutes. Resource group: oracle_dataguard. Not applicable for PDBs.
Shown as megabyte
oci.oracle_oci_database.redo_generation_rate
(gauge)
The redo generation rate on the primary database. Statistic: Mean. Interval: 5 minutes. Resource group: oracle_dataguard. Not applicable for PDBs.
Shown as megabyte
oci.oracle_oci_database.redo_size
(gauge)
The average amount of redo generated.
Shown as megabyte
oci.oracle_oci_database.session_limit_utilization
(gauge)
The session limit utilization.
Shown as percent
oci.oracle_oci_database.sessions
(gauge)
The number of sessions in the database.
Shown as session
oci.oracle_oci_database.storage_allocated
(gauge)
The total amount of storage space allocated to the database at collection time.
Shown as gigabyte
oci.oracle_oci_database.storage_allocated_by_tablespace
(gauge)
The total amount of storage space allocated to the tablespace at collection time. In the case of CDBs, this metric provides root container tablespaces.
Shown as gigabyte
oci.oracle_oci_database.storage_used
(gauge)
The total storage used by the database at collection time, including the space used by tablespaces, flash recovery area, control files, and log files.
Shown as gigabyte
oci.oracle_oci_database.storage_used_by_tablespace
(gauge)
The total amount of storage space used by tablespace at collection time. In the case of CDBs, this metric provides root container tablespace.
Shown as gigabyte
oci.oracle_oci_database.storage_utilization
(gauge)
The percentage of provisioned storage capacity currently in use. Represents the total allocated space for all tablespaces.
Shown as percent
oci.oracle_oci_database.storage_utilization_by_tablespace
(gauge)
The percentage of storage space utilized by the tablespace at the collection time. In the case of CDBs, this metric provides root container tablespaces.
Shown as percent
oci.oracle_oci_database.transaction_count
(count)
The combined number of user commits and user rollbacks during the selected interval.
Shown as transaction
oci.oracle_oci_database.transactions_by_status
(gauge)
The number of committed or rolled back transactions per second.
Shown as transaction
oci.oracle_oci_database.transport_lag
(gauge)
The number of seconds of redo not yet available on the standby database. Statistic: Mean. Interval: 5 minutes. Resource group: oracle_dataguard. Not applicable for PDBs.
Shown as second
oci.oracle_oci_database.transport_lag_data_refresh_elapsed_time
(gauge)
The elapsed time since the TransportLagDataRefreshElapsedTime metric sample was last collected. Statistic: Mean. Interval: 5 minutes. Resource group: oracle_dataguard. Not applicable for PDBs.
Shown as second
oci.oracle_oci_database.unprotected_data_window
(gauge)
The current unprotected data window of a database. Statistic: Mean. Interval: 15 minutes. Only applicable for SI and RAC CDBs version 19c and later.
Shown as second
oci.oracle_oci_database.unusable_indexes
(gauge)
The number of unusable indexes in the database schema.
Shown as index
oci.oracle_oci_database.usable_fra
(gauge)
The usable fast recovery area.
Shown as percent
oci.oracle_oci_database.used_fraspace
(gauge)
The flash recovery area space usage.
Shown as gigabyte
oci.oracle_oci_database.user_calls
(count)
The combined number of logons, parses, and execute calls during the selected interval.
oci.oracle_oci_database.wait_time
(gauge)
The average rate of accumulation of non-idle wait time by foreground sessions in the database instance over the time interval. The wait time component of Average Active Sessions.
Shown as fraction
oci.oracle_oci_database.dbmgmt_job_executions_count
(count)
The number of SQL job executions on a single Managed Database or a Database Group, and their status.
Shown as execution
oci.fastconnect.bits_received
(count)
Number of bits received on the FastConnect interface at the Oracle end of the connection. For a cross-connect group (LAG), the value is the sum across all cross-connects in the group.
Shown as bit
oci.fastconnect.bits_sent
(count)
Number of bits sent from the FastConnect interface at the Oracle end of the connection. For a cross-connect group (LAG), the value is the sum across all cross-connects in the group.
Shown as bit
oci.fastconnect.bytes_received
(count)
Number of bytes received on the FastConnect interface at the Oracle end of the connection. For a cross-connect group (LAG), the value is the sum across all cross-connects in the group.
Shown as byte
oci.fastconnect.bytes_sent
(count)
Number of bytes sent from the FastConnect interface at the Oracle end of the connection. For a cross-connect group (LAG), the value is the sum across all cross-connects in the group.
Shown as byte
oci.fastconnect.connection_state
(gauge)
The values are up (1) or down (0). For a virtual circuit, the operational state of the virtual circuit's interface. For a cross-connect group, this reflects the overall operational state of the cross-connects that make up the cross-connect group (LAG). If at least one of the cross-connects is up, this value is up (1). If all the cross-connects in the group are down, this value is down (0).
oci.fastconnect.ipv_4bgp_session_state
(gauge)
The values are up (1) or down (0). The status of the IPv4 BGP session for a virtual circuit.
oci.fastconnect.ipv_6bgp_session_state
(gauge)
The values are up (1) or down (0). The status of the IPv6 BGP session for a virtual circuit.
oci.fastconnect.packets_discarded
(count)
Number of packets discarded at the Oracle end of the connection.
Shown as packet
oci.fastconnect.packets_error
(count)
Number of packets dropped at the Oracle end of the connection. Dropped packets indicate a misconfiguration in some part of the overall system. Check if there's been a change to the configuration of your VCN, the virtual circuit, or your CPE. For a cross-connect group (LAG), the value is the sum across all cross-connects in the group.
Shown as packet
oci.fastconnect.packets_received
(count)
Number of packets received on the FastConnect interface at the Oracle end of the connection. For a cross-connect group (LAG), the value is the sum across all cross-connects in the group.
Shown as packet
oci.fastconnect.packets_sent
(count)
Number of packets sent from the FastConnect interface at the Oracle end of the connection. For a cross-connect group (LAG), the value is the sum across all cross-connects in the group.
Shown as packet
oci.filestorage.file_system_read_average_latency_by_size
(gauge)
Read latency by size. Expressed as average read latency per second, grouped by size.
Shown as second
oci.filestorage.file_system_read_requests_by_size
(gauge)
Read requests by size. Expressed as operation per second, grouped by size.
Shown as operation
oci.filestorage.file_system_read_throughput
(count)
Read throughput for the file system. If the file system is exported through multiple mount targets, total throughput for all mount targets is displayed. Expressed as bytes read per second.
Shown as byte
oci.filestorage.file_system_usage
(gauge)
Total space utilization for a file system. Expressed as GiB consumed per second.
Shown as byte
oci.filestorage.file_system_write_average_latency_by_size
(gauge)
Write latency by size. Expressed as average write latency per second, grouped by size.
Shown as second
oci.filestorage.file_system_write_requests_by_size
(count)
Write requests by size. Expressed as operation per second, grouped by size.
Shown as operation
oci.filestorage.file_system_write_throughput
(count)
Write throughput for the file system. If the file system is exported through multiple mount targets, total throughput for all mount targets is displayed. Expressed as bytes written per second.
Shown as byte
oci.filestorage.kerberos_errors
(count)
Kerberos errors seen by the mount target while receiving IO from an NFS client. Expressed as a sum of errors per interval.
Shown as error
oci.filestorage.ldap_connection_errors
(count)
Connection failures between mount targets and the LDAP server for this outbound connector. Expressed as error count by error type per interval.
Shown as error
oci.filestorage.ldap_request_average_latency
(gauge)
Mount target to LDAP server request latency for this outbound connector. Expressed as mean latency, in seconds, by request type.
Shown as second
oci.filestorage.ldap_request_errors
(count)
LDAP query failures over an established connection between mount targets and the LDAP server for this outbound connector. Expressed as error count by error type per interval.
Shown as error
oci.filestorage.ldap_request_throughput
(count)
Requests from the mount target to the LDAP server through its outbound connector. Expressed as request type and outbound connector per interval.
Shown as request
oci.filestorage.metadata_iops
(gauge)
IOPs (Input/Output Operations Per Second) for the following NFS operations: CREATE, GETATTR, SETATTR, and REMOVE. Expressed as operations per second.
Shown as operation
oci.filestorage.metadata_request_average_latency
(gauge)
Average metadata request latency for the following NFS operations: CREATE, GETATTR, SETATTR, and REMOVE. Expressed as average latency per second, grouped by operation.
Shown as second
oci.filestorage.mount_target_connections
(count)
Number of client connections for the mount target. Expressed as total connection count at the interval.
Shown as connection
oci.filestorage.mount_target_health
(gauge)
Number of successfully executed NFS API requests. Expressed as a percentage of total requests per interval.
Shown as percent
oci.filestorage.mount_target_read_throughput
(count)
Read throughput for the mount target. If the mount target exports multiple file systems, total throughput for all file systems is displayed. Expressed as bytes read per interval.
Shown as byte
oci.filestorage.mount_target_write_throughput
(count)
Write throughput for the mount target. If the mount target exports multiple file systems, total throughput for all file systems is displayed. Expressed as bytes written per interval.
Shown as byte
oci.filestorage.replication_egress_throughput
(count)
Data that has been copied out of the source region. Only applicable for cross-region replication. Expressed as a sum of bytes written per interval.
Shown as byte
oci.filestorage.replication_recovery_point_age
(gauge)
Age of the last fully copied snapshot that was applied to the target file system. Or, how much older the data on the target file system is than the source file system. Expressed as time since the source snapshot was taken. Monitor this metric to ensure that the data on the target file system isn't older than your requirements allow (RPO).
Shown as time
oci.filestorage.replication_throughput
(count)
Throughput of the data transferred out of the source file system. Expressed as bytes read per interval.
Shown as byte
oci.faas.allocated_provisioned_concurrency
(gauge)
Memory consumed by provisioned concurrency slots.
Shown as megabyte
oci.faas.allocated_total_concurrency
(gauge)
Total concurrent memory allocated.
Shown as megabyte
oci.faas.function_execution_duration
(count)
Total function execution duration. Expressed in milliseconds.
Shown as millisecond
oci.faas.function_invocation_count
(count)
Total number of function invocations.
oci.faas.function_response_count
(count)
Total number of function responses.
Shown as invocation
oci.lbaas.accepted_connections
(count)
The number of connections accepted by the load balancer.
Shown as connection
oci.lbaas.accepted_sslhandshake
(count)
The number of accepted SSL handshakes.
Shown as operation
oci.lbaas.active_connections
(count)
The number of active connections from clients to the load balancer.
Shown as connection
oci.lbaas.active_sslconnections
(count)
The number of active SSL connections.
Shown as connection
oci.lbaas.backend_servers
(gauge)
The number of backend servers in the backend set.
Shown as instance
oci.lbaas.backend_timeouts
(count)
The number of timeouts across all backend servers.
Shown as timeout
oci.lbaas.bytes_received
(count)
The number of bytes received by the load balancer.
Shown as byte
oci.lbaas.bytes_sent
(count)
The number of bytes sent across all backend servers.
Shown as byte
oci.lbaas.closed_connections
(count)
The number of connections closed between the load balancer and backend servers.
Shown as connection
oci.lbaas.failed_sslclient_cert_verify
(count)
The number of failed client SSL certificate verifications.
Shown as error
oci.lbaas.failed_sslhandshake
(count)
The number of failed SSL handshakes.
Shown as error
oci.lbaas.handled_connections
(count)
The number of connections handled by the load balancer.
Shown as connection
oci.lbaas.http_requests
(count)
The number of incoming client requests to the backend set.
Shown as request
oci.lbaas.http_responses
(count)
The number of HTTP responses across all backend servers.
Shown as response
oci.lbaas.http_responses_200
(count)
The number of HTTP 200 responses received from backend sets.
Shown as response
oci.lbaas.http_responses_2xx
(count)
The number of HTTP 2xx responses received from backend sets.
Shown as response
oci.lbaas.http_responses_3xx
(count)
The number of HTTP 3xx responses received from backend sets.
Shown as response
oci.lbaas.http_responses_4xx
(count)
The number of HTTP 4xx responses received from backend sets.
Shown as response
oci.lbaas.http_responses_502
(count)
The number of HTTP 502 responses received from backend sets.
Shown as response
oci.lbaas.http_responses_504
(count)
The number of HTTP 504 responses received from backend sets.
Shown as response
oci.lbaas.http_responses_5xx
(count)
The number of HTTP 5xx responses received from backend sets.
Shown as response
oci.lbaas.http_responses_200
(count)
The number of HTTP 200 responses received from backend servers.
Shown as response
oci.lbaas.http_responses_2xx
(count)
The number of HTTP 2xx responses received from backend servers.
Shown as response
oci.lbaas.http_responses_3xx
(count)
The number of HTTP 3xx responses received from backend servers.
Shown as response
oci.lbaas.http_responses_4xx
(count)
The number of HTTP 4xx responses received from backend servers.
Shown as response
oci.lbaas.http_responses_502
(count)
The number of HTTP 502 responses received from backend servers.
Shown as response
oci.lbaas.http_responses_504
(count)
The number of HTTP 504 responses received from backend servers.
Shown as response
oci.lbaas.http_responses_5xx
(count)
The number of HTTP 5xx responses received from backend servers.
Shown as response
oci.lbaas.invalid_header_responses
(count)
The number of invalid header responses across all backend servers.
Shown as response
oci.lbaas.keep_alive_connections
(count)
The number of keep-alive connections.
Shown as connection
oci.lbaas.peak_bandwidth
(gauge)
Maximum bits per second bandwidth used during the specified interval.
Shown as bit
oci.lbaas.response_time_first_byte
(gauge)
Average time to the first byte of response from backend servers. TCP only.
Shown as millisecond
oci.lbaas.response_time_http_header
(gauge)
Average response time of backend servers. HTTP only.
Shown as millisecond
oci.lbaas.unhealthy_backend_servers
(gauge)
The number of unhealthy backend servers in the backend set.
Shown as instance
oci.mysql_database.active_connections
(gauge)
The number of connections actively executing statements against the MySQL DB system.
Shown as connection
oci.mysql_database.backup_failure
(gauge)
Backup failure events observed over the last interval. 0 - OK 1 - FAILED
oci.mysql_database.backup_size
(gauge)
The aggregate size of all backups per DB system.
Shown as byte
oci.mysql_database.backup_time
(gauge)
The time taken to create a backup.
Shown as millisecond
oci.mysql_database.cpuutilization
(gauge)
CPU utilization for the MySQL DB system host or HeatWave nodes.
Shown as percent
oci.mysql_database.channel_failure
(gauge)
The channel health status observed over the last interval. One of the following values: 0 - HEALTHY 1 - FAILED To troubleshoot inbound replication failure, see Troubleshooting Inbound Replication.
oci.mysql_database.channel_lag
(gauge)
The channel lag, with respect to the immediate source of the channel, observed over the last interval. If the channel is configured with replication delay, the channel lag includes the replication delay. See Creating a Replication Channel.
Shown as millisecond
oci.mysql_database.current_connections
(gauge)
The number of current connections to the MySQL DB system.
Shown as connection
oci.mysql_database.db_volume_read_bytes
(count)
The total bytes read from the MySQL DB system volume(s).
Shown as byte
oci.mysql_database.db_volume_read_operations
(count)
The total number of read operations for the DB volume(s).
Shown as operation
oci.mysql_database.db_volume_utilization
(gauge)
The total space utilization of the MySQL DB system volume(s).
Shown as percent
oci.mysql_database.db_volume_write_bytes
(count)
The total bytes written to the MySQL DB system volume(s).
Shown as byte
oci.mysql_database.db_volume_write_operations
(count)
The total number of write operations for the MySQL DB volume(s).
Shown as operation
oci.mysql_database.heat_wave_data_load_progress
(gauge)
Progress of data load into HeatWave cluster memory.
Shown as percent
oci.mysql_database.heat_wave_health
(gauge)
HeatWave cluster health status. One of the following values: 0 - HEALTHY 0.5: RELOADING DATA 1 - RECOVERING 2 - FAILED See HeatWave Cluster Failure and Recovery.
oci.mysql_database.heat_wave_statements
(count)
The number of statements executed against the MySQL DB System and were executed on HeatWave cluster.
oci.mysql_database.memory_allocated
(gauge)
The total amount of memory allocated during the selected interval.
Shown as gigabyte
oci.mysql_database.memory_used
(gauge)
The maximum amount of memory used during the selected interval.
Shown as gigabyte
oci.mysql_database.memory_utilization
(gauge)
Memory utilization for the MySQL DB system host or HeatWave nodes.
Shown as percent
oci.mysql_database.network_receive_bytes
(count)
Network receive bytes for the MySQL DB system.
Shown as byte
oci.mysql_database.network_transmit_bytes
(count)
Network transmit bytes for the MySQL DB system.
Shown as byte
oci.mysql_database.ocpus_allocated
(gauge)
The actual number of OCPUs allocated during the selected interval.
oci.mysql_database.ocpus_used
(gauge)
The actual number of OCPUs used during the selected interval.
oci.mysql_database.statement_latency
(gauge)
Statement latency for all executed statements.
Shown as millisecond
oci.mysql_database.statements
(count)
The number of statements executed against the MySQL DB system.
oci.mysql_database.storage_allocated
(gauge)
The maximum amount of space allocated to the DB system during the interval.
Shown as gigabyte
oci.mysql_database.storage_used
(gauge)
The maximum amount of space used during the interval.
Shown as gigabyte
oci.nat_gateway.bytes_from_natgw
(count)
Number of bytes sent from NAT gateway to OCI resources.
Shown as byte
oci.nat_gateway.bytes_to_natgw
(count)
Number of bytes sent from Oracle Cloud Infrastructure (OCI) resources to NAT gateway.
Shown as byte
oci.nat_gateway.connections_closed
(count)
Number of connections via NAT gateway that were closed by the internet host
oci.nat_gateway.connections_established
(count)
Number of connections established via NAT gateway
oci.nat_gateway.connections_timed_out
(count)
Number of connections closed by NAT gateway due to idle time out
oci.nat_gateway.drops_to_natgw
(count)
Number of packets from OCI resources to NAT Gateway that were dropped by NAT Gateway.
Shown as packet
oci.nat_gateway.packets_from_natgw
(count)
Number of packets sent from NAT gateway to OCI resources.
Shown as packet
oci.nat_gateway.packets_to_natgw
(count)
Number of packets sent from OCI resources to NAT gateway.
Shown as packet
oci.objectstorage.all_requests
(count)
The total number of all HTTP requests made in a bucket. Emit frequency: every 100 ms
Shown as request
oci.objectstorage.client_errors
(count)
The total number of 4xx errors for requests made in a bucket. Emit frequency: every 100 ms
Shown as error
oci.objectstorage.enabled_olm
(gauge)
Indicates whether a bucket has any executable Object Lifecycle Management policies configured. EnabledOLM emits: 1 if policies are configured 0 if no policies are configured Emit frequency: every 3 hours
oci.objectstorage.first_byte_latency
(gauge)
The per-request time measured from the time Object Storage receives the complete request to when Object Storage returns the first byte of the response. Emit frequency: every 100 ms
Shown as millisecond
oci.objectstorage.object_count
(count)
The count of objects in the bucket, excluding any multipart upload parts that have not been discarded (aborted) or committed. Emit frequency: every hour
oci.objectstorage.post_requests
(count)
The total number of HTTP Post requests made in a bucket. Emit frequency: every 100 ms
Shown as request
oci.objectstorage.put_requests
(count)
The total number of PutObject requests made in a bucket. Emit frequency: every 100 ms
Shown as request
oci.objectstorage.stored_bytes
(gauge)
The size of the bucket, excluding any multipart upload parts that have not been discarded (aborted) or committed. Emit frequency: every hour
Shown as byte
oci.objectstorage.total_request_latency
(gauge)
The per-request time from the first byte received by Object Storage to the last byte sent from Object Storage. Emit frequency: every 100 ms
Shown as millisecond
oci.objectstorage.uncommitted_parts
(gauge)
The size of any multipart upload parts that have not been discarded (aborted) or committed. Emit frequency: every hour
Shown as byte
oci.oke.apiserver_request_count
(count)
Number of requests received by the Kubernetes API Server.
Shown as request
oci.oke.apiserver_response_count
(count)
Number of different non-200 responses (that is, error responses) sent from the Kubernetes API server.
Shown as response
oci.oke.kubernetes_node_condition
(gauge)
Number of worker nodes in different conditions, as indicated by the Kubernetes API server.
Shown as node
oci.oke.node_state
(gauge)
Number of compute nodes in different states.
Shown as node
oci.oke.unschedulable_pods
(gauge)
Number of pods that the Kubernetes scheduler is unable to schedule. Not available in clusters running versions of Kubernetes prior to version 1.15.x.
oci.queue.consumer_lag
(gauge)
Difference in time between the oldest message in the queue and the current time
Shown as minute
oci.queue.messages_count
(count)
Count of messages sent and received per queue
Shown as message
oci.queue.messages_in_queue_count
(gauge)
Count of messages in the queue
oci.queue.queue_size
(gauge)
Bytes in the queue
Shown as byte
oci.queue.request_success
(count)
Indicates the success of the requests sent and received per queue
oci.queue.requests_latency
(gauge)
Latency of the requests to the queue
Shown as millisecond
oci.queue.requests_throughput
(gauge)
Bytes sent and received per queue
Shown as byte
oci.service_connector_hub.bytes_read_from_source
(count)
Number of bytes read from the source. Note: This value is emitted each time Connector Hub reads data from the source. If failures occur at the task or destination and Connector Hub needs to reread data from the source, the value is emitted again.
Shown as byte
oci.service_connector_hub.bytes_read_from_task
(count)
Number of bytes moved from the task to Connector Hub.
Shown as byte
oci.service_connector_hub.bytes_written_to_target
(count)
Number of bytes written to the target. Note: Use this metric as a general indicator of success. BytesWrittenToTarget might not match BytesReadFromSource or BytesReadFromTask. For example, consider a 10MB read intended for an Object Storage target. Connector Hub might compress the data, converting 10MB read into 1MB written.
Shown as byte
oci.service_connector_hub.bytes_written_to_task
(count)
Number of bytes moved by Connector Hub to the task.
Shown as byte
oci.service_connector_hub.data_freshness
(gauge)
Indicates age of the oldest processed record of the most recent set.
Shown as millisecond
oci.service_connector_hub.errors_at_source
(count)
Number of errors that affect retrieving data from source. Tip: To troubleshoot errors, view the errorCode and errorType dimension values. For example, an errorCode value that starts with 5, such as 500, implies a partner service outage, while the errorCode value –1 implies a network outage or timeout.
Shown as error
oci.service_connector_hub.errors_at_target
(count)
Number of errors that affect writing data to target. Tip: To troubleshoot errors, view the errorCode and errorType dimension values. For example, an errorCode value that starts with 5, such as 500, implies a partner service outage, while the errorCode value –1 implies a network outage or timeout.
Shown as error
oci.service_connector_hub.errors_at_task
(count)
Number of errors while writing to the task. Tip: To troubleshoot errors, view the errorCode and errorType dimension values. For example, an errorCode value that starts with 5, such as 500, implies a partner service outage, while the errorCode value –1 implies a network outage or timeout.
Shown as error
oci.service_connector_hub.latency_at_source
(gauge)
Time-to-first-byte when retrieving data from source. Useful for customers to troubleshoot with complex tasks (log rules).
Shown as millisecond
oci.service_connector_hub.latency_at_target
(gauge)
Time-to-first-byte when writing data to target.
Shown as millisecond
oci.service_connector_hub.latency_at_task
(gauge)
Time-to-first-byte for task; includes latency reading from the source, errors at the task, and errors writing to the target.
Shown as millisecond
oci.service_connector_hub.messages_read_from_source
(count)
Number of records read from the source. Note: The value for this metric is cumulative.
Shown as message
oci.service_connector_hub.messages_read_from_task
(count)
Number of messages moved from the task to Connector Hub.
Shown as message
oci.service_connector_hub.messages_written_to_target
(count)
Number of records written to the target.
Shown as message
oci.service_connector_hub.messages_written_to_task
(count)
Number of messages moved by Connector Hub to the task.
Shown as message
oci.service_connector_hub.service_connector_hub_errors
(count)
Number of errors in Connector Hub that affect moving data from source to target.
Shown as error
oci.service_gateway.bytes_from_service
(count)
The number of bytes successfully sent from the service gateway toward customer instances.
Shown as byte
oci.service_gateway.bytes_to_service
(count)
The number of bytes successfully sent from the service gateway toward Oracle services.
Shown as byte
oci.service_gateway.packets_from_service
(count)
The number of packets successfully sent from the service gateway toward customer instances.
Shown as packet
oci.service_gateway.packets_to_service
(count)
The number of packets successfully sent from the service gateway toward Oracle services.
Shown as packet
oci.service_gateway.sgw_drops_from_service
(count)
The number of packets dropped while sending packets from the service gateway toward customer instances.
Shown as packet
oci.service_gateway.sgw_drops_to_service
(count)
The number of packets dropped while sending packets from the service gateway toward Oracle services.
Shown as packet
oci.vcn.smartnic_buffer_drops_from_host
(count)
Number of packets dropped in SmartNIC from host due to buffer exhaustion.
Shown as packet
oci.vcn.smartnic_buffer_drops_from_network
(count)
Number of packets dropped in SmartNIC from network due to buffer exhaustion.
Shown as packet
oci.vcn.vnic_conntrack_is_full
(gauge)
Boolean (0/false, 1/true) that indicates the connection tracking table is full.
oci.vcn.vnic_conntrack_util_percent
(gauge)
Total utilization percentage (0-100%) of the connection tracking table.
Shown as percent
oci.vcn.vnic_egress_drops_conntrack_full
(count)
Packets sent from the VNIC, destined for the network, dropped due to full connection tracking table.
Shown as packet
oci.vcn.vnic_egress_drops_security_list
(count)
Packets sent by the VNIC, destined for the network, dropped due to security rule violations.
Shown as packet
oci.vcn.vnic_egress_drops_throttle
(count)
Packets sent from the VNIC, destined for the network, dropped due to throttling.
Shown as packet
oci.vcn.vnic_from_network_bytes
(count)
Bytes received at the VNIC from the network, after drops.
Shown as byte
oci.vcn.vnic_from_network_packets
(count)
Packets received at the VNIC from the network, after drops.
Shown as packet
oci.vcn.vnic_ingress_drops_conntrack_full
(count)
Packets received from the network, destined for the VNIC, dropped due to full connection tracking table.
Shown as packet
oci.vcn.vnic_ingress_drops_security_list
(count)
Packets received from the network, destined for the VNIC, dropped due to security rule violations.
Shown as packet
oci.vcn.vnic_ingress_drops_throttle
(count)
Packets received from the network, destined for the VNIC, dropped due to throttling.
Shown as packet
oci.vcn.vnic_to_network_bytes
(count)
Bytes sent from the VNIC to the network, before drops.
Shown as byte
oci.vcn.vnic_to_network_packets
(count)
Packets sent from the VNIC to the network, before drops.
Shown as packet
oci.vpn.bytes_received
(count)
Number of bytes received at the Oracle end of the connection.
Shown as byte
oci.vpn.bytes_sent
(count)
Number of bytes sent from the Oracle end of the connection.
Shown as byte
oci.vpn.packets_error
(count)
Number of packets dropped at the Oracle end of the connection. Dropped packets indicate a misconfiguration in some part of the overall system. Check if there's been a change to the configuration of your VCN, Site-to-Site VPN, or your CPE.
Shown as packet
oci.vpn.packets_received
(count)
Number of packets received at the Oracle end of the connection.
Shown as packet
oci.vpn.packets_sent
(count)
Number of packets sent from the Oracle end of the connection.
Shown as packet
oci.vpn.tunnel_state
(gauge)
Whether the tunnel is up (1) or down (0).
oci.waf.bandwidth
(gauge)
Bandwidth rate calculated by dividing total data egress in a minute by 60.
Shown as byte
oci.waf.number_of_requests
(count)
The total number of requests serviced by the WAF.
Shown as request
oci.waf.number_of_requests_detected
(count)
The number of requests that triggered a detect (alert) for a WAF policy.
Shown as request
oci.waf.traffic
(gauge)
Data egress from the WAF (compressed by default) measured in one minute intervals.
Shown as byte

Service Checks

The OCI integration does not include any service checks.

Events

The OCI integration does not include any events.

Troubleshooting

Need help? Contact Datadog support.

Further Reading

Additional helpful documentation, links, and articles: