- Agents
- Essentials
- Getting Started
- Agent
- API
- APM Tracing
- Containers
- Dashboards
- Database Monitoring
- Datadog
- Datadog Site
- DevSecOps
- Incident Management
- Integrations
- Internal Developer Portal
- Logs
- Monitors
- Notebooks
- OpenTelemetry
- Profiler
- Search
- Session Replay
- Security
- Serverless for AWS Lambda
- Software Delivery
- Synthetic Monitoring and Testing
- Tags
- Workflow Automation
- Learning Center
- Support
- Glossary
- Standard Attributes
- Guides
- Agent
- Integrations
- Extend Datadog
- Authorization
- DogStatsD
- Custom Checks
- Integrations
- Build an Integration with Datadog
- Create an Agent-based Integration
- Create an API-based Integration
- Create a Log Pipeline
- Integration Assets Reference
- Build a Marketplace Offering
- Create an Integration Dashboard
- Create a Monitor Template
- Create a Cloud SIEM Detection Rule
- Install Agent Integration Developer Tool
- Service Checks
- Community
- Guides
- OpenTelemetry
- Administrator's Guide
- API
- Partners
- Datadog Mobile App
- DDSQL Reference
- CoScreen
- CoTerm
- Remote Configuration
- Cloudcraft (Standalone)
- In The App
- Dashboards
- Notebooks
- DDSQL Editor
- Reference Tables
- Sheets
- Monitors and Alerting
- Service Level Objectives
- Metrics
- Watchdog
- Bits AI
- Internal Developer Portal
- Error Tracking
- Change Tracking
- Event Management
- Incident Response
- Actions & Remediations
- Infrastructure
- Cloudcraft
- Resource Catalog
- Universal Service Monitoring
- End User Device Monitoring
- Hosts
- Containers
- Processes
- Serverless
- Network Monitoring
- Storage Management
- Cloud Cost
- Application Performance
- APM
- Continuous Profiler
- Database Monitoring
- Agent Integration Overhead
- Setup Architectures
- Setting Up Postgres
- Setting Up MySQL
- Setting Up SQL Server
- Setting Up Oracle
- Setting Up Amazon DocumentDB
- Setting Up MongoDB
- Setting Up ClickHouse
- Connecting DBM and Traces
- Data Collected
- Exploring Database Hosts
- Exploring Query Metrics
- Exploring Query Samples
- Exploring Database Schemas
- Exploring Recommendations
- Troubleshooting
- Guides
- Data Streams Monitoring
- Data Observability
- Digital Experience
- Real User Monitoring
- Synthetic Testing and Monitoring
- Continuous Testing
- Experiments
- Product Analytics
- Session Replay
- Software Delivery
- CI Visibility
- CD Visibility
- Deployment Gates
- Test Optimization
- Code Coverage
- PR Gates
- DORA Metrics
- Feature Flags
- Developer Integrations
- Security
- Security Overview
- Cloud SIEM
- Code Security
- Cloud Security
- App and API Protection
- AI Guard
- Workload Protection
- Sensitive Data Scanner
- AI Observability
- Log Management
- Observability Pipelines
- Configuration
- Sources
- Processors
- Destinations
- Packs
- Akamai CDN
- Amazon CloudFront
- Amazon VPC Flow Logs
- AWS Application Load Balancer Logs
- AWS CloudTrail
- AWS Elastic Load Balancer Logs
- AWS Network Load Balancer Logs
- Cisco ASA
- Cloudflare
- F5
- Fastly
- Fortinet Firewall
- HAProxy Ingress
- Istio Proxy
- Juniper SRX Firewall Traffic Logs
- Netskope
- NGINX
- Okta
- Palo Alto Firewall
- Windows XML
- ZScaler ZIA DNS
- Zscaler ZIA Firewall
- Zscaler ZIA Tunnel
- Zscaler ZIA Web Logs
- Search Syntax
- Scaling and Performance
- Monitoring and Troubleshooting
- Guides and Resources
- Log Management
- CloudPrem
- Administration
- Account Management
- Data Security
- Help
Setup
Overview
Network Device Monitoring helps you gain insights into the health and performance of your on-prem routers, switches, and firewalls. After the Datadog Agent is installed on a host that has access to the network, the Agent can automatically detect network devices and collect metrics right out of the box.
This guide covers configuring Network Device Monitoring on your hosts, enriching device tags, setting up and viewing device profiles, viewing data in NetFlow Monitoring, and validating data in the provided dashboards and Device Topology Map.
How it works
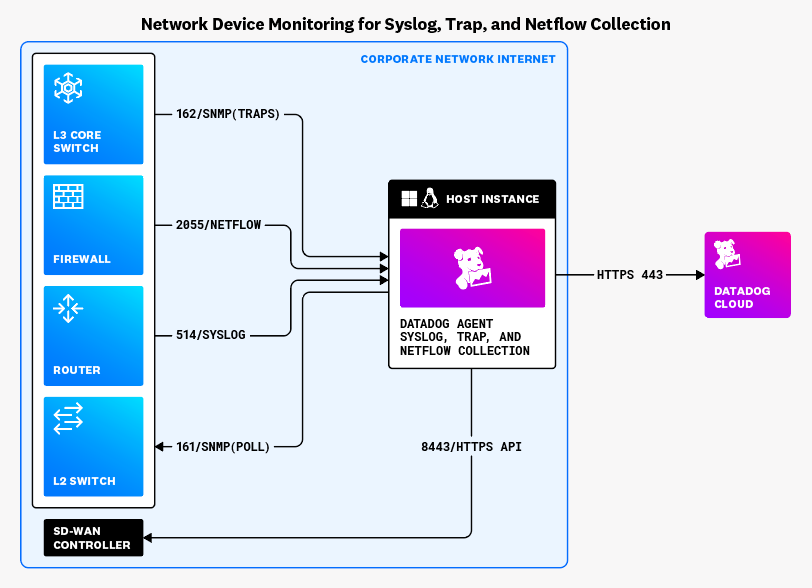
The following diagram illustrates the data flow between Syslog, SNMP traps, and NetFlow information. The devices send the relevant information to the Datadog Agent over the ports as shown in the diagram (ports can be changed if needed by configuration in the Agent). For API based integrations, the Datadog Agent connects with the network device vendor software controllers or managers on-premise or in the cloud based on specific https API integrations instructions per vendor. The Datadog Agent, configured with NDM and deployed on-premises or in the cloud, consolidates all collected device and network data from your network and sends it to Datadog over HTTPS on port 443. This provides unified, full-stack observability of metrics, logs, traces, monitors, and dashboards.
Next steps
Follow the instructions below to configure Datadog to monitor your network devices.
Prerequisites
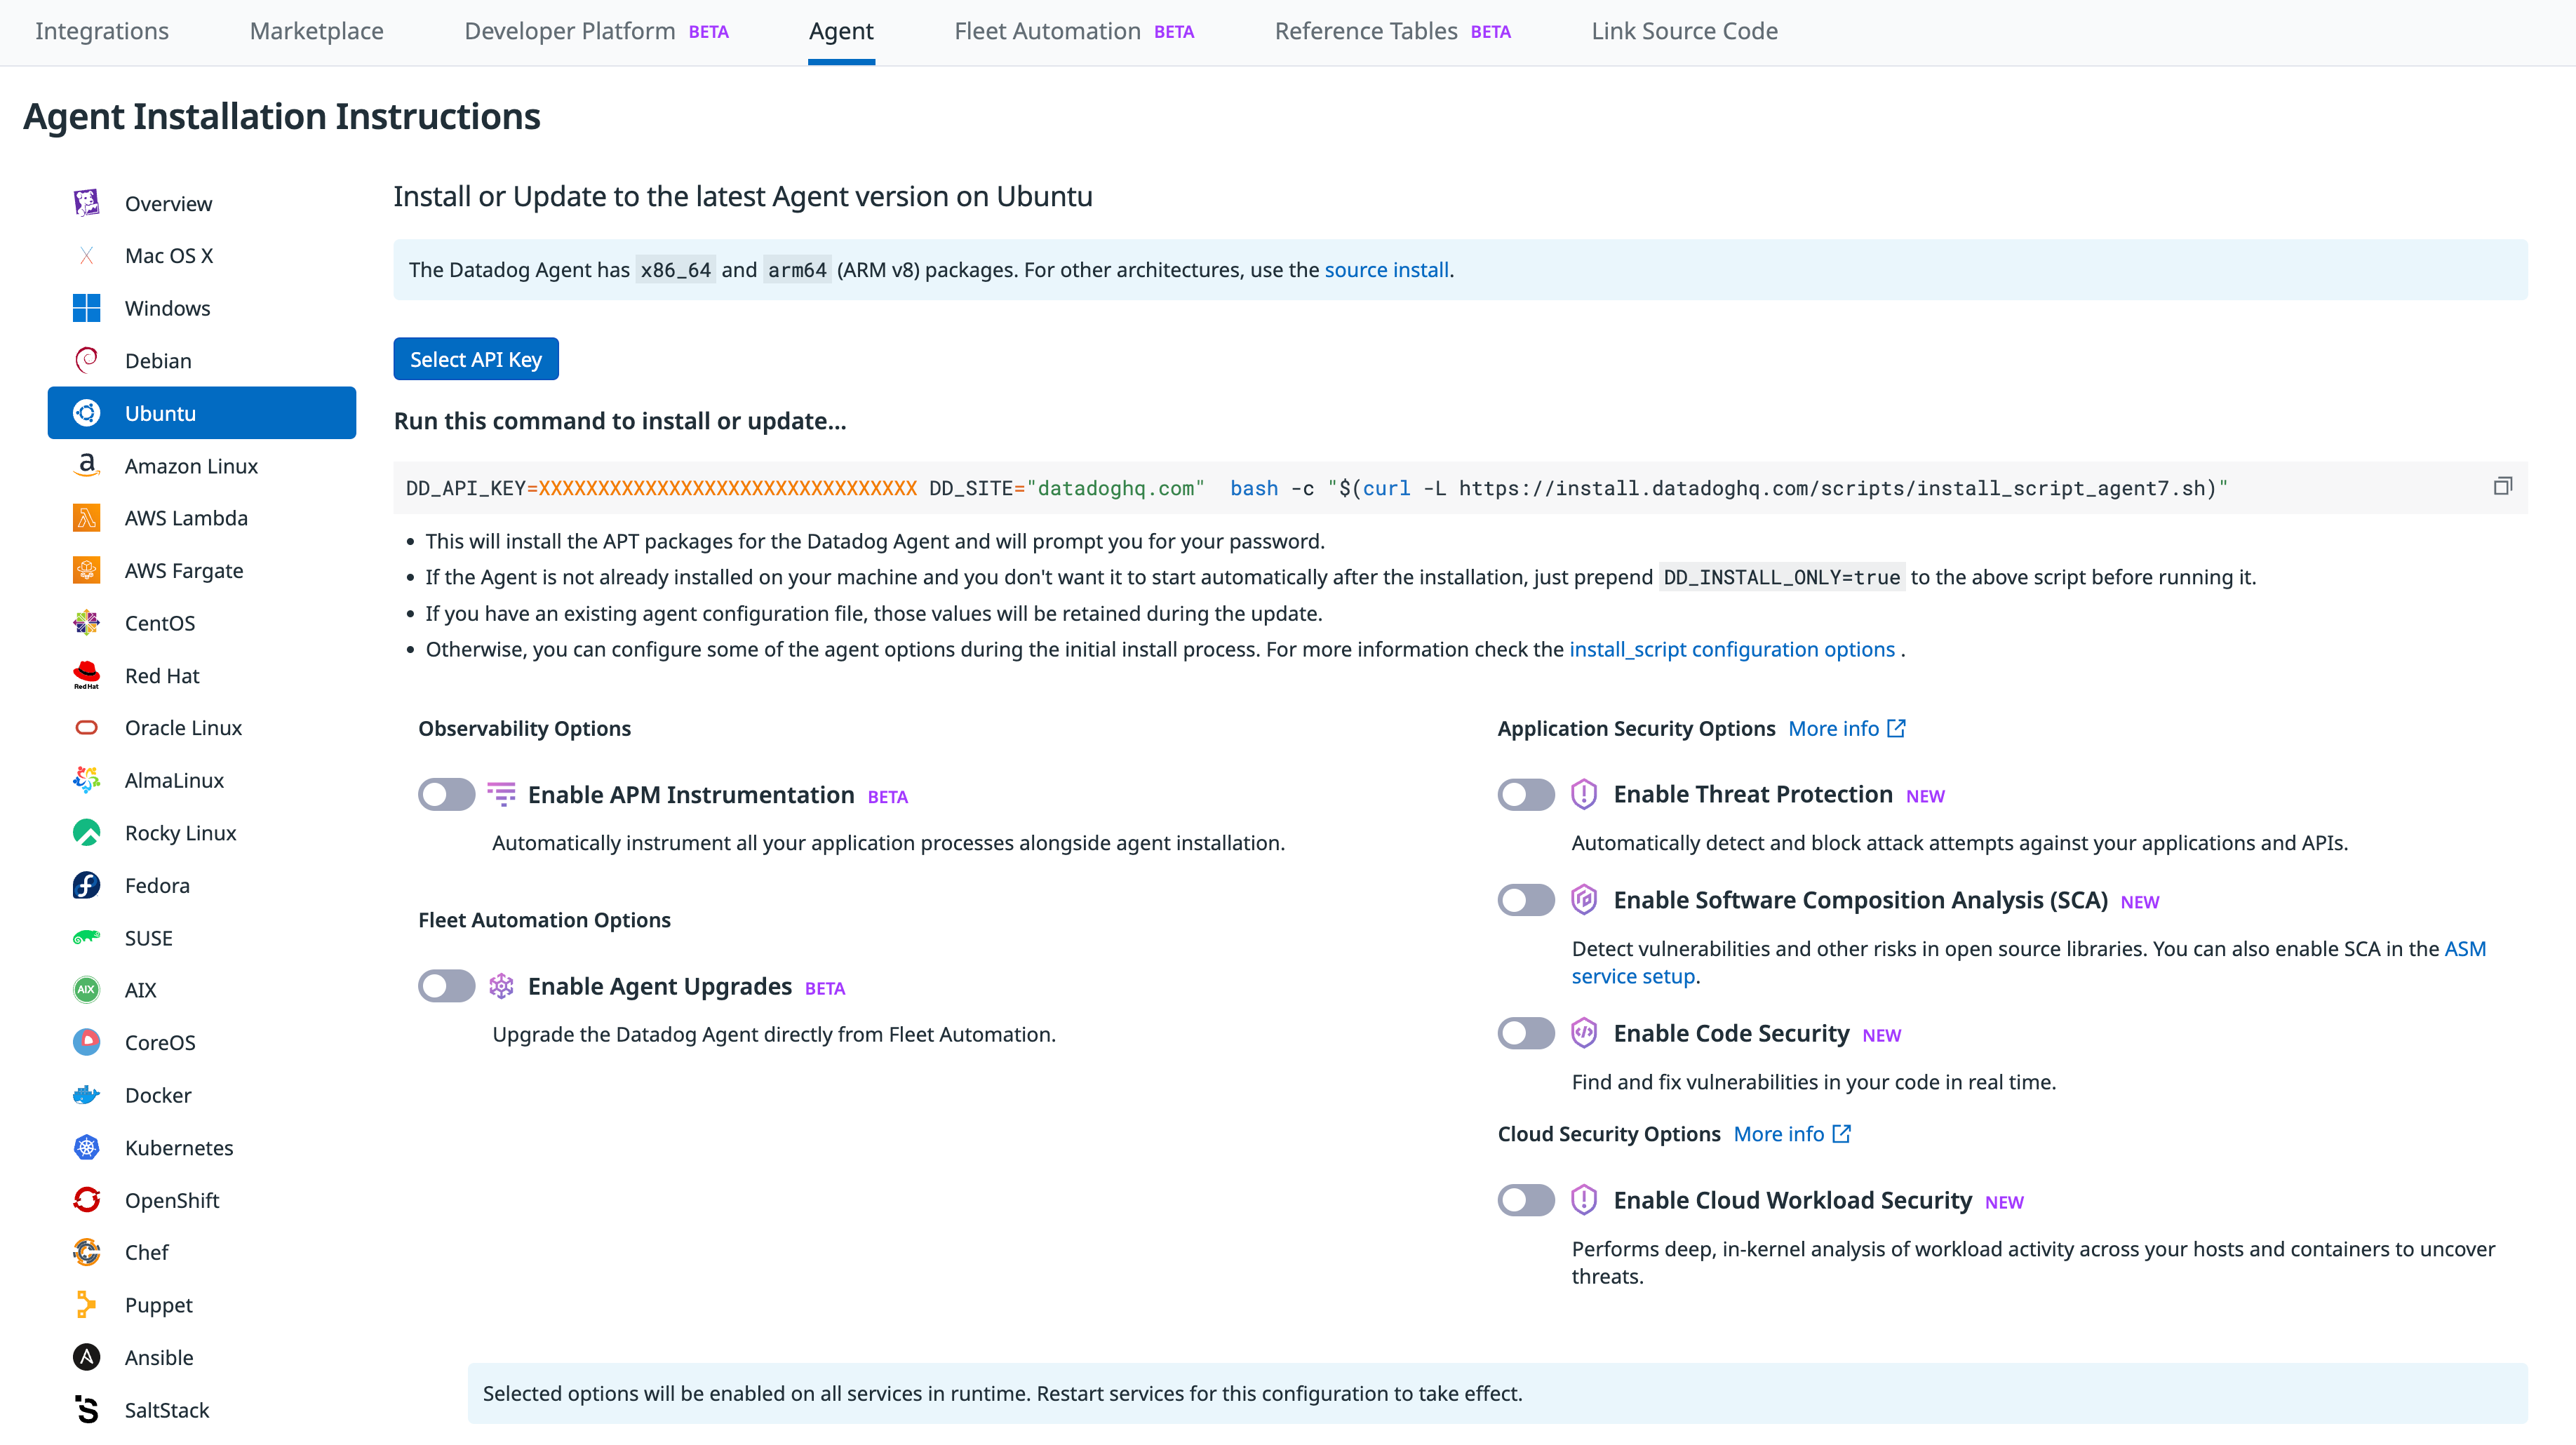
Install the Agent
Navigate to the Agent installation page, and install the Datadog Agent on your host (usually a server that is not the monitored device).
Setup
High Availability
High Availability support of the Datadog Agent is in not supported for your selected Datadog site ().
High Availability (HA) support of the Datadog Agent in Network Device Monitoring allows you to designate an active Agent and a standby Agent, ensuring automatic failover if the active Agent encounters an issue. This setup eliminates the Agent as a single point of failure, maintaining continuous monitoring during unexpected incidents or planned maintenance, such as OS updates and Agent upgrades.
You can configure active and standby Agents to function as an HA pair in NDM. If the active Agent goes down, the standby Agent takes over within 90 seconds, becoming the new active Agent. Additionally, you can designate a preferred active Agent, allowing NDM to automatically revert to it once it becomes available again. This feature allows for proactive Agent switching ahead of scheduled maintenance.
For more information, see High Availability support of the Datadog Agent.
Configuration
To begin monitoring your network devices, enable SNMP monitoring using one of the following methods:
- Individual devices
- Configure SNMP monitoring on your individual devices.
- Autodiscovery
- Configure SNMP monitoring using Autodiscovery.
- Ping
- Configure the SNMP check to send ICMP pings to your devices.
- Syslog
- Configure your devices to send Syslog messages.
- VPN Monitoring
- Configure VPN monitoring to start monitoring your devices’ VPN tunnels.
Enrich network devices with tags
After NDM is configured on your devices, you can further enrich them by adding network device tags using the following methods:
- Datadog Agent
- The Agent can collect device tags when configuring individual devices or with Autodiscovery.
- Device profiles
- Configure the Agent to collect and customize specific metrics and tags by creating device profiles directly in the app.
- ServiceNow integration
- Dynamically enrich network devices monitored by Datadog Network Device Monitoring with data defined in ServiceNow’s CMDB (Configuration Management Database).
- Network Device Monitoring API
- Utilize the Network Device Monitoring API to programmatically add tags to your network devices.
Customize metrics and tags
Customize metrics and tags on your devices by viewing the Supported Devices page to view out-of-the-box device profiles. If you would like to edit or add more metrics, the following options are available:
- Device profiles
- Directly edit metrics and tags in the Datadog Agent
yamlfile with device profiles. - GUI based profile authoring
- Take advantage of Datadog Network Monitoring’s GUI based device onboarding experience where you can add custom metrics and tags to your devices.
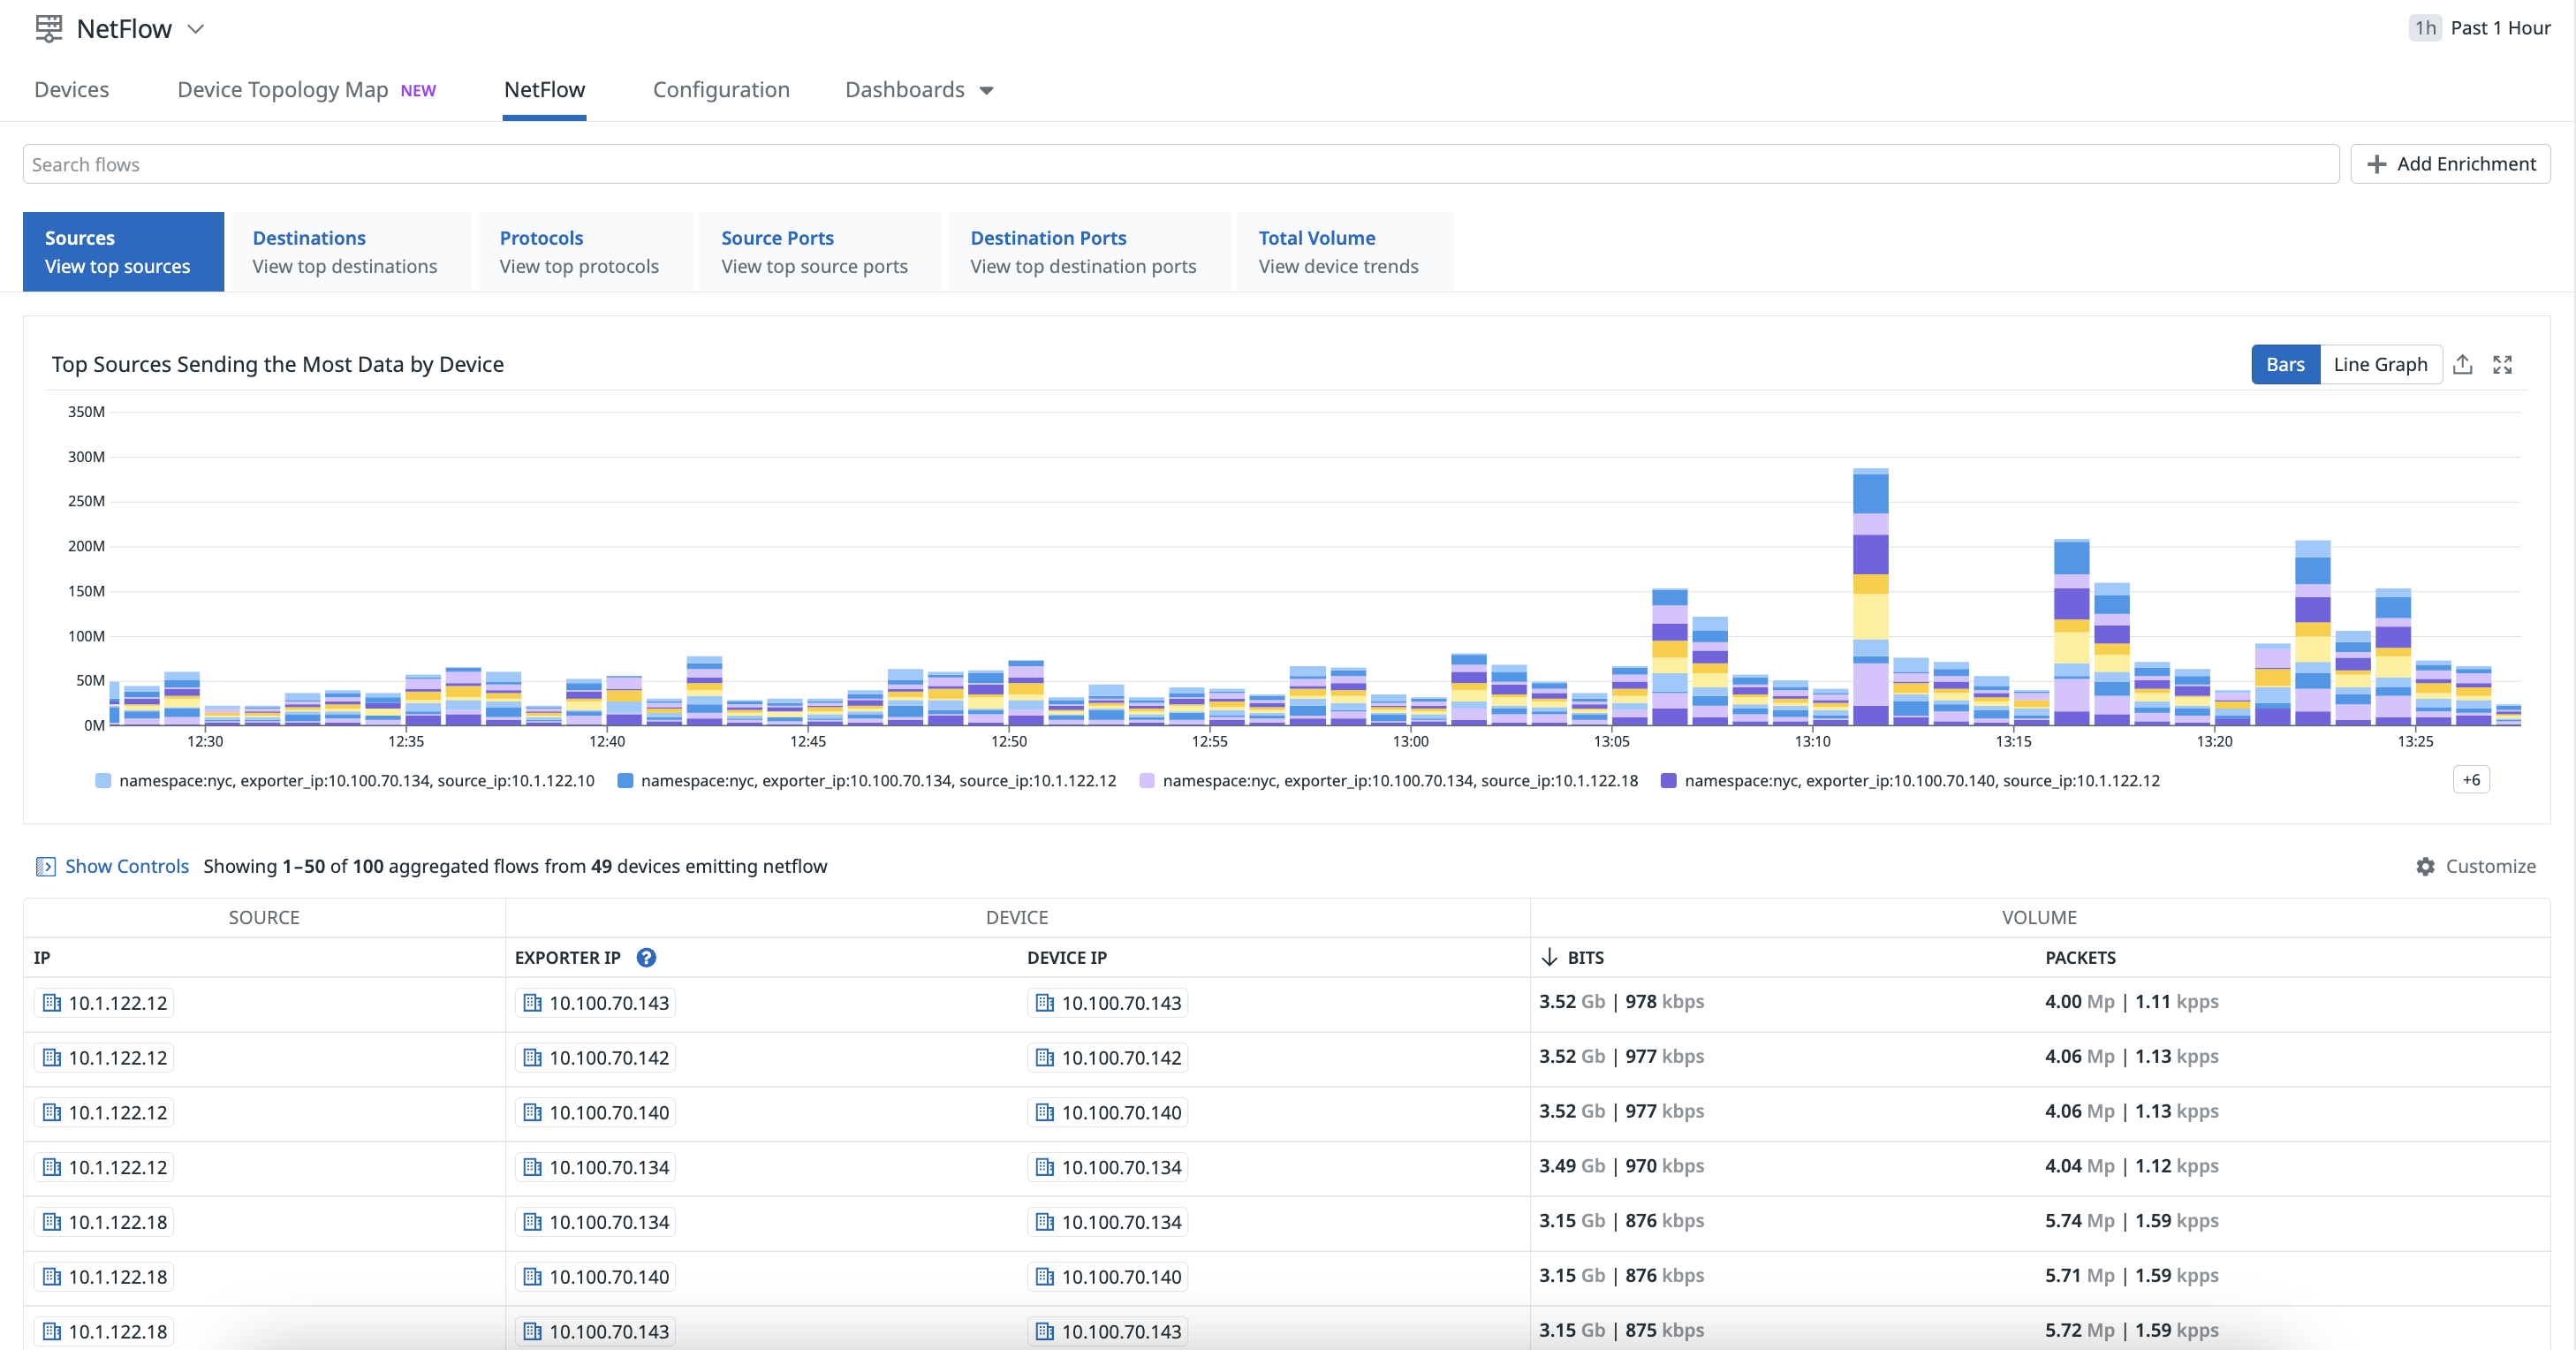
NetFlow Monitoring
Configure NetFlow Monitoring to visualize and monitor your flow records from your NetFlow-enabled devices.
Validate your data
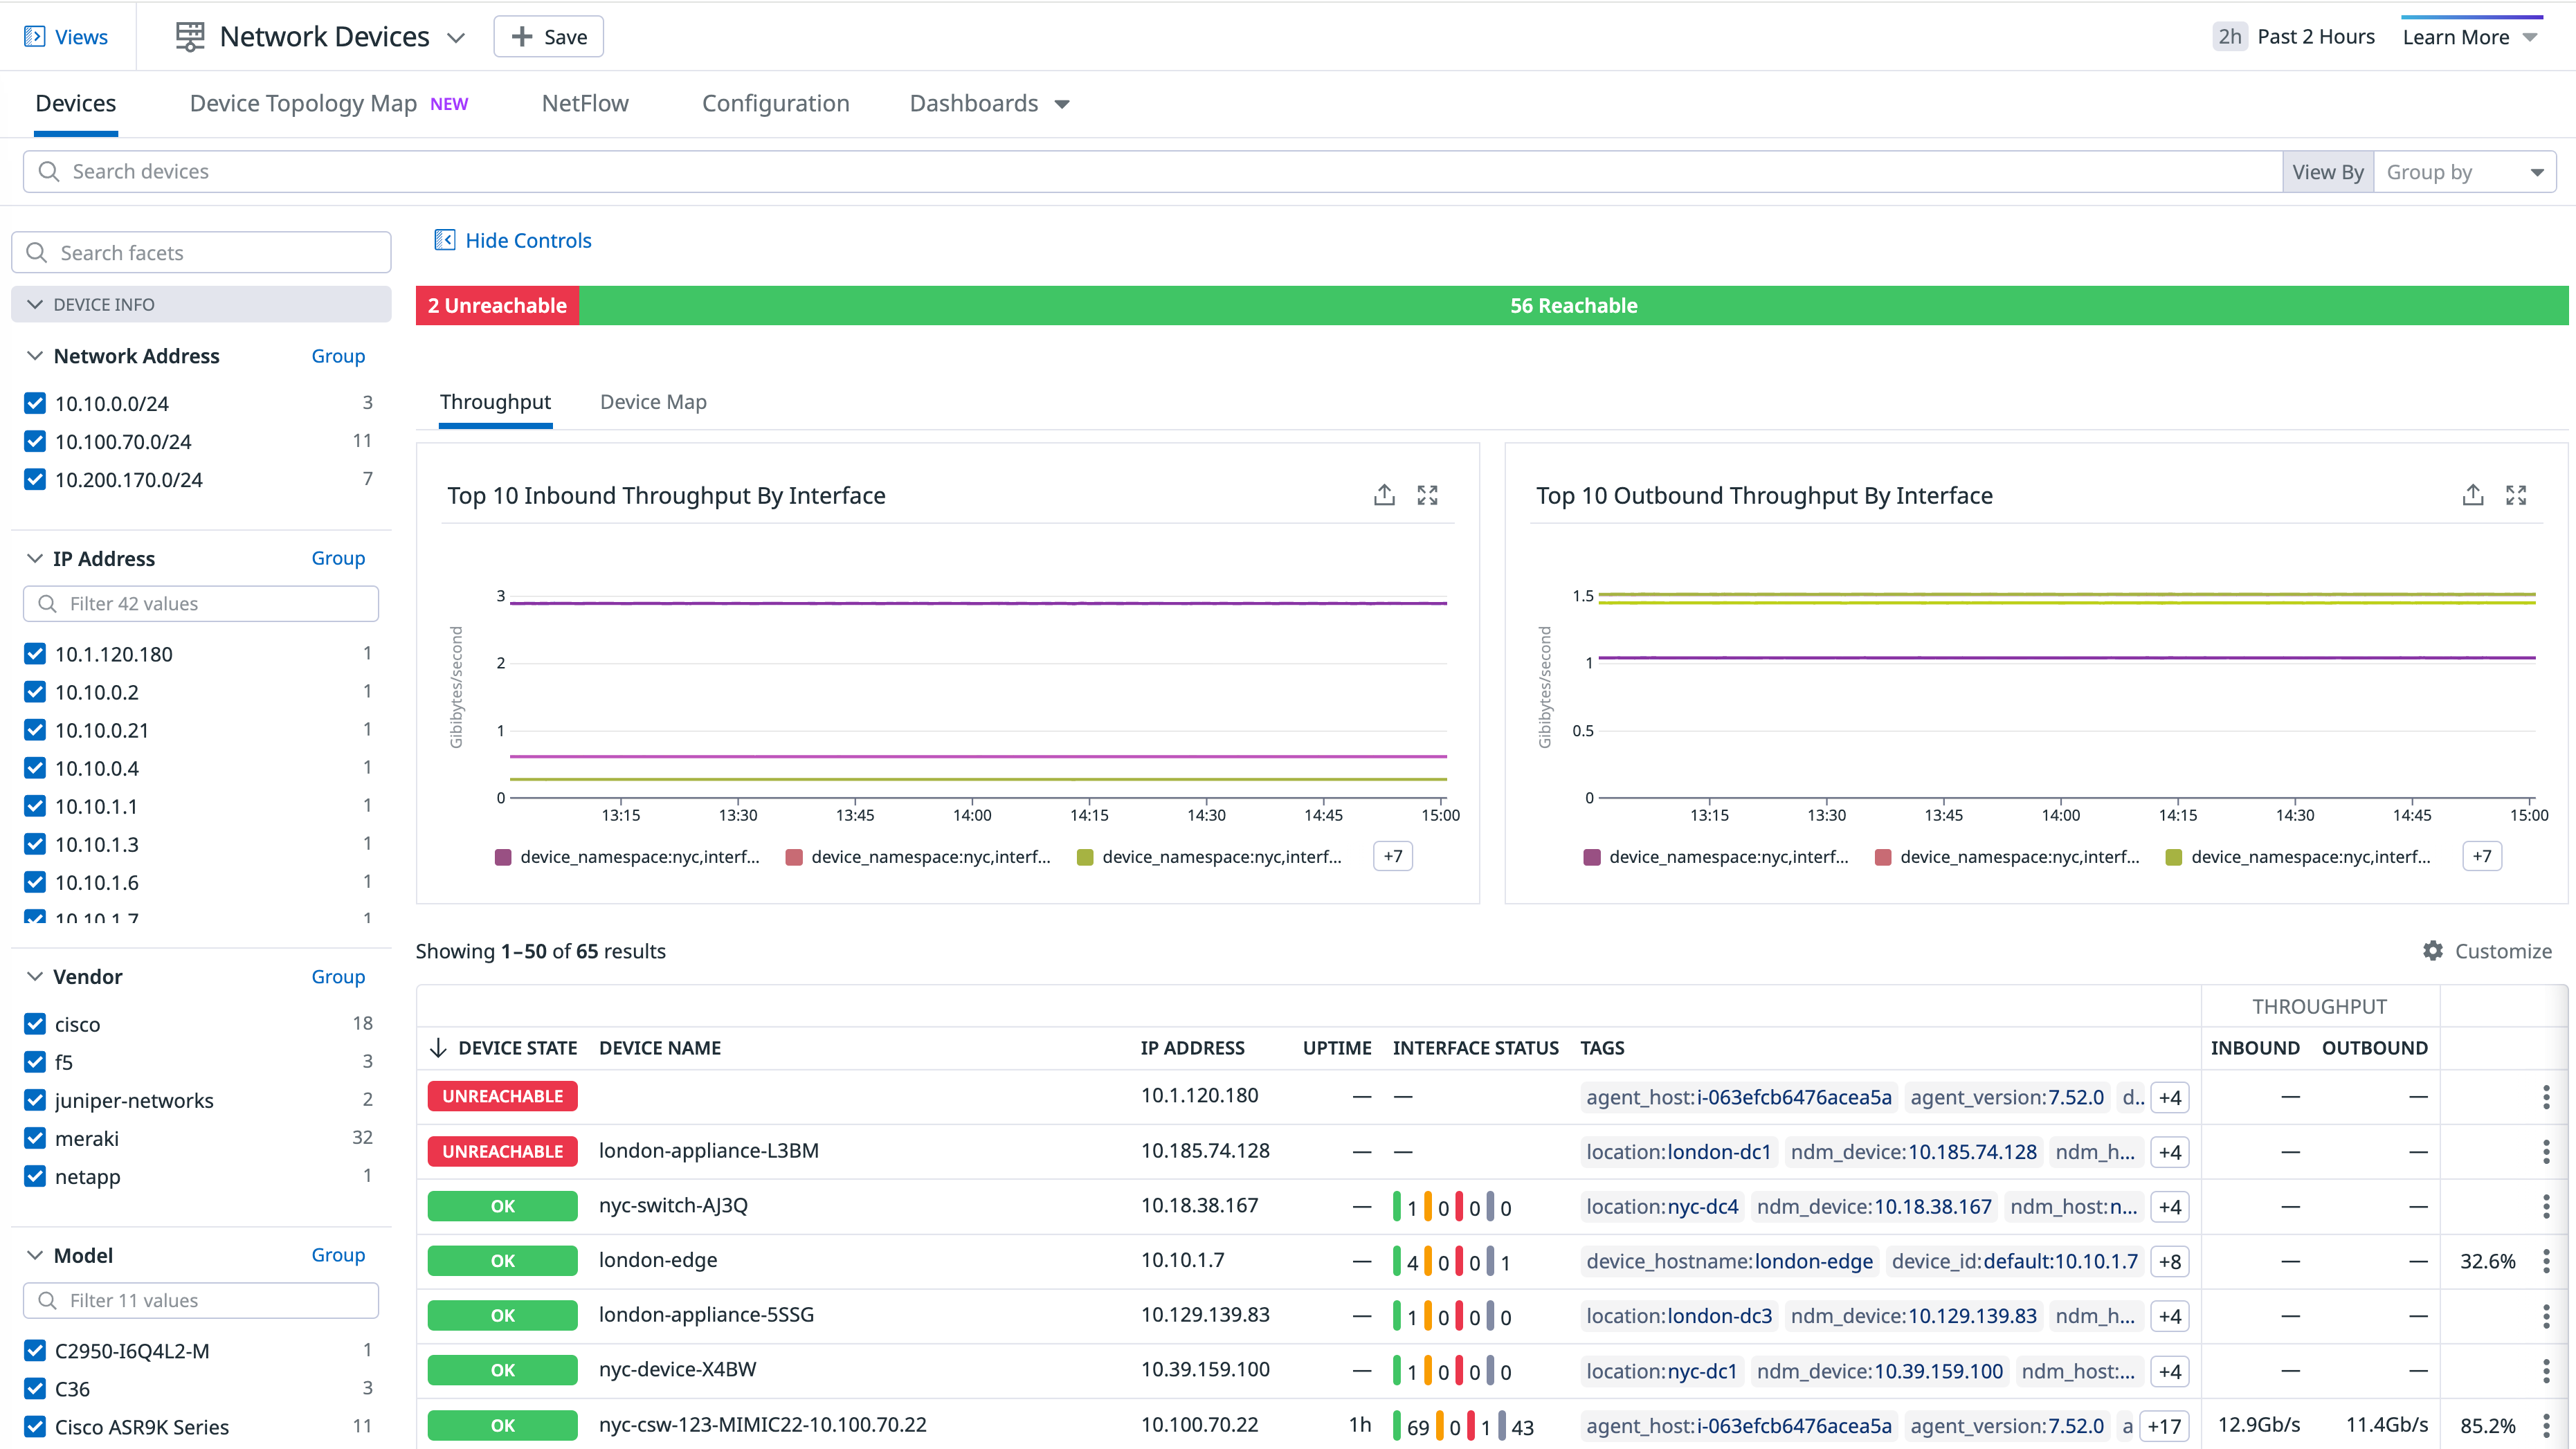
- Start monitoring your entire network infrastructure on the Network Devices page.
- View metrics collected on Datadog’s out-of-the-box dashboards:
- Use the Network Device Topology Map to identify and troubleshoot issues with your devices.
Use the Network API
- Use the Network API to extract the following information about your network devices:
Troubleshooting
- See the Network Device Troubleshooting page for more information on troubleshooting your NDM issues.
Further Reading
Additional helpful documentation, links, and articles:


