- Essentials
- Getting Started
- Agent
- API
- APM Tracing
- Containers
- Dashboards
- Database Monitoring
- Datadog
- Datadog Site
- DevSecOps
- Incident Management
- Integrations
- Internal Developer Portal
- Logs
- Monitors
- Notebooks
- OpenTelemetry
- Profiler
- Search
- Session Replay
- Security
- Serverless for AWS Lambda
- Software Delivery
- Synthetic Monitoring and Testing
- Tags
- Workflow Automation
- Learning Center
- Support
- Glossary
- Standard Attributes
- Guides
- Agent
- Integrations
- Extend Datadog
- Authorization
- DogStatsD
- Custom Checks
- Integrations
- Build an Integration with Datadog
- Create an Agent-based Integration
- Create an API-based Integration
- Create a Log Pipeline
- Integration Assets Reference
- Build a Marketplace Offering
- Create an Integration Dashboard
- Create a Monitor Template
- Create a Cloud SIEM Detection Rule
- Install Agent Integration Developer Tool
- Service Checks
- Community
- Guides
- OpenTelemetry
- Administrator's Guide
- API
- Partners
- Datadog Mobile App
- DDSQL Reference
- CoScreen
- CoTerm
- Remote Configuration
- Cloudcraft (Standalone)
- In The App
- Dashboards
- Notebooks
- DDSQL Editor
- Reference Tables
- Sheets
- Monitors and Alerting
- Service Level Objectives
- Metrics
- Watchdog
- Bits AI
- Internal Developer Portal
- Error Tracking
- Change Tracking
- Event Management
- Incident Response
- Actions & Remediations
- Infrastructure
- Cloudcraft
- Resource Catalog
- Universal Service Monitoring
- End User Device Monitoring
- Hosts
- Containers
- Processes
- Serverless
- Network Monitoring
- Storage Management
- Cloud Cost
- Application Performance
- APM
- Continuous Profiler
- Database Monitoring
- Agent Integration Overhead
- Setup Architectures
- Setting Up Postgres
- Setting Up MySQL
- Setting Up SQL Server
- Setting Up Oracle
- Setting Up Amazon DocumentDB
- Setting Up MongoDB
- Setting Up ClickHouse
- Connecting DBM and Traces
- Data Collected
- Exploring Database Hosts
- Exploring Query Metrics
- Exploring Query Samples
- Exploring Database Schemas
- Exploring Recommendations
- Troubleshooting
- Guides
- Data Streams Monitoring
- Data Observability
- Digital Experience
- Real User Monitoring
- Synthetic Testing and Monitoring
- Continuous Testing
- Product Analytics
- Session Replay
- Software Delivery
- CI Visibility
- CD Visibility
- Deployment Gates
- Test Optimization
- Code Coverage
- PR Gates
- DORA Metrics
- Feature Flags
- Developer Integrations
- Security
- Security Overview
- Cloud SIEM
- Code Security
- Cloud Security
- App and API Protection
- AI Guard
- Workload Protection
- Sensitive Data Scanner
- AI Observability
- Log Management
- Observability Pipelines
- Configuration
- Sources
- Processors
- Destinations
- Packs
- Akamai CDN
- Amazon CloudFront
- Amazon VPC Flow Logs
- AWS Application Load Balancer Logs
- AWS CloudTrail
- AWS Elastic Load Balancer Logs
- AWS Network Load Balancer Logs
- Cisco ASA
- Cloudflare
- F5
- Fastly
- Fortinet Firewall
- HAProxy Ingress
- Istio Proxy
- Juniper SRX Firewall Traffic Logs
- Netskope
- NGINX
- Okta
- Palo Alto Firewall
- Windows XML
- ZScaler ZIA DNS
- Zscaler ZIA Firewall
- Zscaler ZIA Tunnel
- Zscaler ZIA Web Logs
- Search Syntax
- Scaling and Performance
- Monitoring and Troubleshooting
- Guides and Resources
- Log Management
- CloudPrem
- Administration
- Account Management
- Data Security
- Help
- feature_flags_client
Notifications
Overview
Notifications are a key component of monitors that keep your team informed of issues and support troubleshooting. When creating your monitor, configure your response to:
- Craft an actionable message.
- Trigger a workflow or create a workflow from a monitor.
- Automatically create a case.
- Automatically create an incident.
Constructing effective titles and messages
This approach helps ensure your monitor titles and messages are clear, actionable, and tailored to your audience’s needs.
- Unique titles: Add a unique title to your monitor (this is required). For multi alert monitors, some tags identifying your triggering scope are automatically inserted. You can use tag variables to enhance specificity.
- Message field: The message field supports standard Markdown formatting and variables. Use conditional variables to modulate the notification text sent to different contacts with @notifications. Use synthetics template variables to enrich the alert message with synthetics failure context.
Markdown formatting support differs by notification method. Some channels support only a subset of Markdown syntax.
- Slack notifications: Support basic formatting (bold, italics, inline code, links). Markdown headers (for example,
#,##) and tables are not rendered; they appear as plain text. - Email notifications: Support basic formatting (bold, italics, inline code, links). Tables are not rendered as Markdown tables and appear as plain text in the message body.
Example monitor message
Example monitor message
A common use-case for the monitor message is to include a step-by-step way to resolve the problem, for example:
{{#is_alert}} <-- conditional variable

Steps to free up disk space on {{host.name}}: <-- tag variable

1. Remove unused packages
2. Clear APT cache
3. Uninstall unnecessary applications
4. Remove duplicate files

@slack-incident-response <-- channel to send notification

{{/is_alert}}
Notification recipients
Datadog recommends using monitor notification rules to manage monitor notifications. With notification rules you can automate which notification recipients are added to a monitor based on predefined sets of conditions. Create different rules to route monitor alerts based on the tags of the monitor notification so you don’t have to manually set up recipients nor notification routing logic for each individual monitor.
In both notification rules and individual monitors, you can use an @notification to add a team member, integration, workflow, or case to your notification. As you type, Datadog auto-recommends existing options in a drop-down menu. Click an option to add it to your notification. Alternatively, click @ Add Mention, Add Workflow, or Add Case.
An @notification must have a space between it and the last line character:
| Correct Format | Incorrect Format |
|---|---|
Disk space is low @ops-team@company.com | Disk space is low@ops-team@company.com |
Email
Notify an active Datadog user by email with
@<DD_USER_EMAIL_ADDRESS>.Note: An email address associated with a pending Datadog user invitation or a disabled user is considered inactive and does not receive notifications. Blocklists, IP or domain filtering, spam filtering, or email security tools may also cause missing notifications.
Notify any non-Datadog user by email with
@<EMAIL>.
Note: Email notifications don’t support addresses that contain slashes /, for example, @DevOpS/West@example.com.
Teams
Teams
If a notification channel is set, you can route notifications to a specific Team. Monitor alerts targeting @team-handle are redirected to the selected communication channel. For more information on setting a notification channel to your Team, see the Teams documentation.
Integrations
Integrations
Notify your team through connected integrations by using the format @<INTEGRATION_NAME>-<VALUES>.
This table lists prefixes and example links:
| Integration | Prefix | Examples |
|---|---|---|
| Jira | @jira | Examples |
| PagerDuty | @pagerduty | Examples |
| Slack | @slack | Examples |
| Webhooks | @webhook | Examples |
| Microsoft Teams | @teams | Examples |
| ServiceNow | @servicenow | Examples |
Handles that include parentheses ((, )) are not supported. When a handle with parentheses is used, the handle is not parsed and no alert is created.
Bulk editing monitor @-handles
Datadog supports editing alert message recipients across multiple monitors at once. Use this feature to efficiently add, remove, or replace @-handles in the monitor message body. Use cases include:
- Swap a handle: Replace one handle with another across multiple monitors. For example, change
@pagerduty-sreto@oncall-sre. You can also swap a single handle with multiple handles, such as replacing@pagerduty-srewith both@pagerduty-sreand@oncall-sre, to support dual paging or expanded alerting coverage. - Add a handle: Add a new recipient without removing existing ones. For example, add
@slack-infra-leadsto all selected monitors. - Remove a handle: Remove a specific handle from monitor messages. For example, remove
@webhook-my-legacy-event-intake.
Workflows
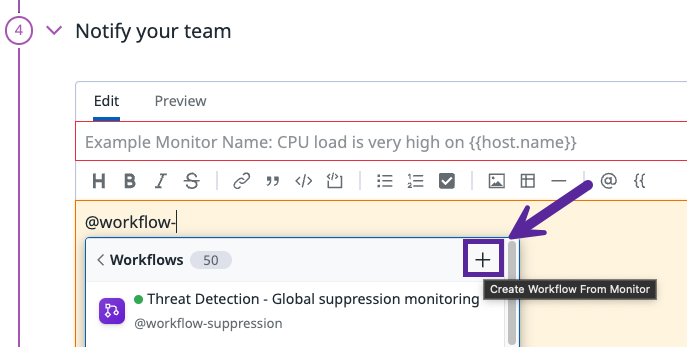
You can trigger a workflow automation or create a new workflow from a monitor.
Before you add a workflow to a monitor, add a monitor trigger to the workflow.
After you add the monitor trigger, add an existing workflow to your monitor or create a new workflow. To create a new workflow from the monitors page:
- Click Add Workflow.
- Click the + icon and select a Blueprint, or select Start From Scratch.
For more information on building a workflow, see Build workflows.
Incidents
Incidents can be automatically created from a monitor when the monitor transitions to an alert, warn, or no data status. Click on Add Incident and select an @incident- option. Admins can create @incident- options in Incident Settings.
When an incident is created from a monitor, the incident’s field values are automatically populated based on the monitor’s tags. For example, if your monitor has a tag service:payments, the incident’s service field will be set to “payments”. To receive notifications for these incidents, make sure the monitor’s tags align with your incident notification rules. Note: Incident notification rules are configured separately from monitor notification rules and need to be set up independently. For more information, see Incident Notification.
Toggle additional content
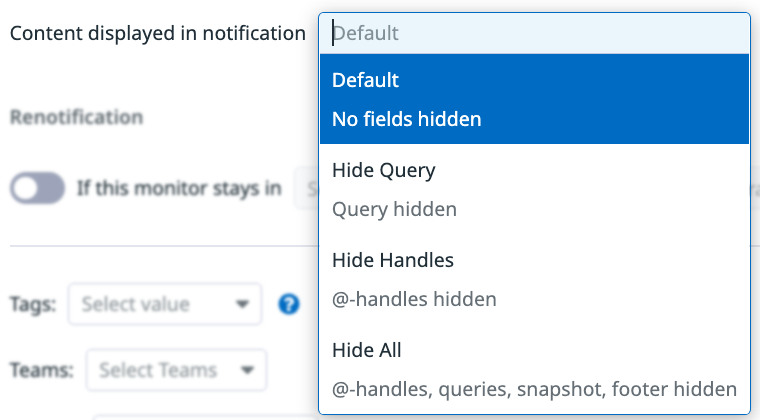
Monitor notifications include content such as the monitor’s query, the @-mentions used, metric snapshots (for metric monitors), and links back to relevant pages in Datadog. You have the option to choose which content you would like to include or exclude from notifications for individual monitors.
Distribution metrics with percentile aggregators (such as `p50`, `p75`, `p95`, or `p99`) do not generate a snapshot graph in notifications.
The options are:
- Default: No content is hidden.
- Hide Query: Remove the monitor’s query from the notification message.
- Hide Handles: Remove the @-mentions that are used in the notification message.
- Hide All: Notification message does not include query, handles, any snapshots (for metric monitors), or additional links in footers.
Note: Depending on the integration, some content may not be displayed by default.
Renotify
Enable monitor renotification (optional) to remind your team that a problem is not solved.
Configure the renotify interval, the monitor states from which the monitor renotifies (within alert, no data, and warn) and optionally set a limit to the number of renotification messages sent.
For example, configure the monitor to stop renotifying after 1 occurrence to receive a single escalation message after the main alert.
Note: Attribute and tag variables in the renotification are populated with the data available to the monitor during the time period of the renotification.
If renotification is enabled, you are given the option to include an escalation message that is sent if the monitor remains in one of the chosen states for the specified time period.
The escalation message can be added in the following ways:
- In the
{{#is_renotify}}block in the original notification message (recommended). - In the Renotification message field in the
Configure notifications and automationssection. - With the
escalation_messageattribute in the API.
If you use the {{#is_renotify}} block, the original notification message is also included in the renotification, so:
- Include only extra details in the
{{#is_renotify}}block and don’t repeat the original message details. - Send the escalation message to a subset of groups.
Learn how to configure your monitors for those use cases in the example section.
Metadata
Add metadata (Priority, Tags, Datadog Team) to your monitor. Monitor Priority allows you to set the importance of your monitor through P-level (P1 to P5). Monitor tag–which are different from metric tags–are used in the UI to group and search for monitors. If tag policies are configured, the required tags and tag values need to be added. To learn more, see Tag Policies. Datadog Teams allows you to set a layer of ownership to this monitor and view all the monitors linked to your team. To learn more, see Datadog Teams.
Priority
Priority
Add a priority (optional) associated with your monitors. Values range from P1 through P5, with P1 being the highest priority and the P5 being the lowest.
To override the monitor priority in the notification message, use {{override_priority 'Pi'}} where Pi is between P1 and P5.
For example, you can set different priorities for alert and warning notifications:
{{#is_alert}}
{{override_priority 'P1'}}
 ...
{{/is_alert}}
{{#is_warning}}
{{override_priority 'P4'}}
...
{{/is_warning}}
Aggregation
If the monitor’s query is grouped, you can remove one or more of the dimensions from the notification grouping, or remove them all and notify as a Simple Alert.
Find more information on this feature in Configure Monitors
Test notifications
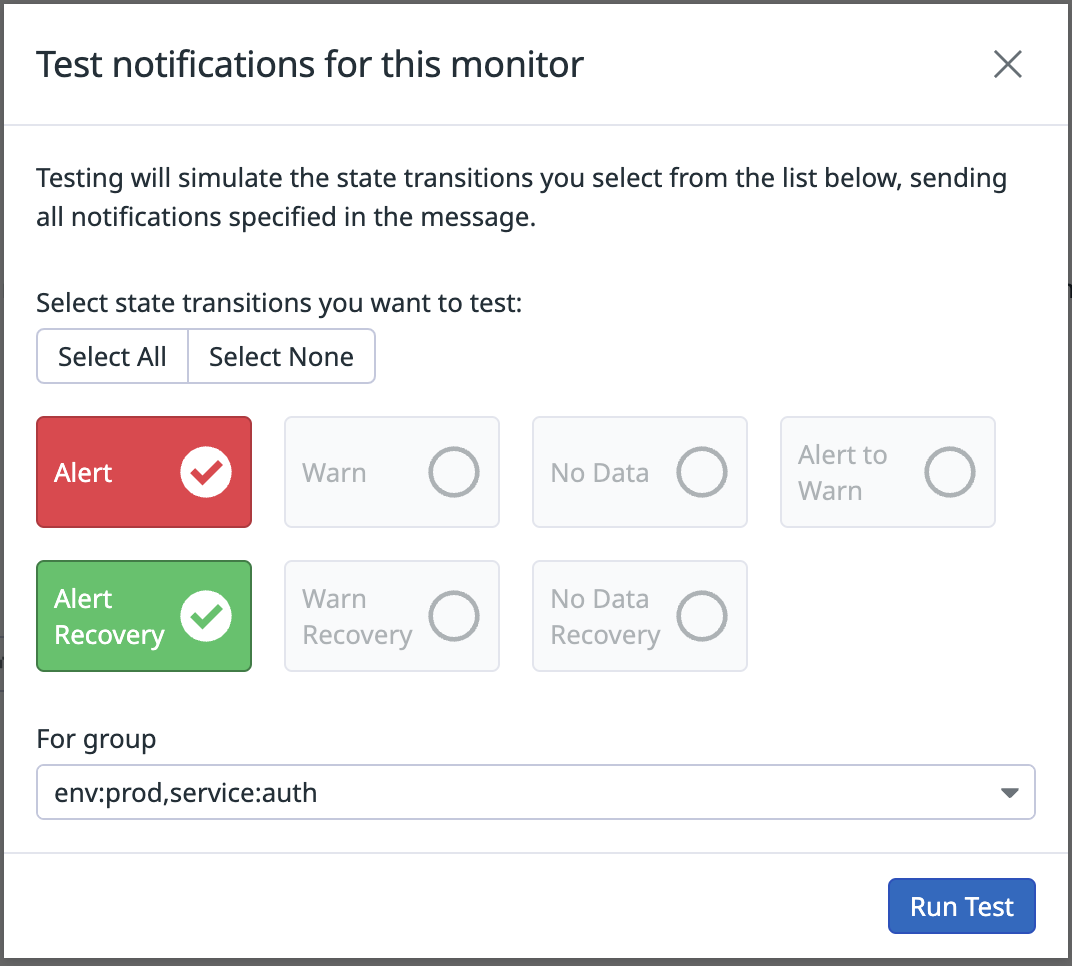
After defining your monitor, test the notifications with the Test Notifications button at the bottom right of the monitor page.
Test notifications are supported for the monitor types: host, metric, anomaly, outlier, forecast, logs, rum, apm, integration (check only), process (check only), network (check only), custom check, event, and composite.
From the test notifications pop-up, choose the monitor transition to test and the group (available only if the query has grouping). You can only test states that are available in the monitor’s configuration for the thresholds specified in the alerting conditions. Recovery thresholds are an exception, as Datadog sends a recovery notification once the monitor either is no longer in alert, or it has no warn conditions.
Click Run Test to send notifications to the people and services listed in the monitor.
Events
Test notifications produce events that can be searched within the event explorer. These notifications indicate who initiated the test in the message body with [TEST] in notification title.
Tag variables are only populated in the text of Datadog child events. The parent event only displays an aggregation summary.
Variables
Message variables auto-populate with a randomly selected group based on the scope of your monitor’s definition, for example:
{{#is_alert}}
{{host.name}} <-- will populate
{{/is_alert}}
Further Reading
Additional helpful documentation, links, and articles:


