概要
Real User Monitoring (RUM) エクスプローラーは、このサイドパネル形式を含む個々のイベントを表示します。
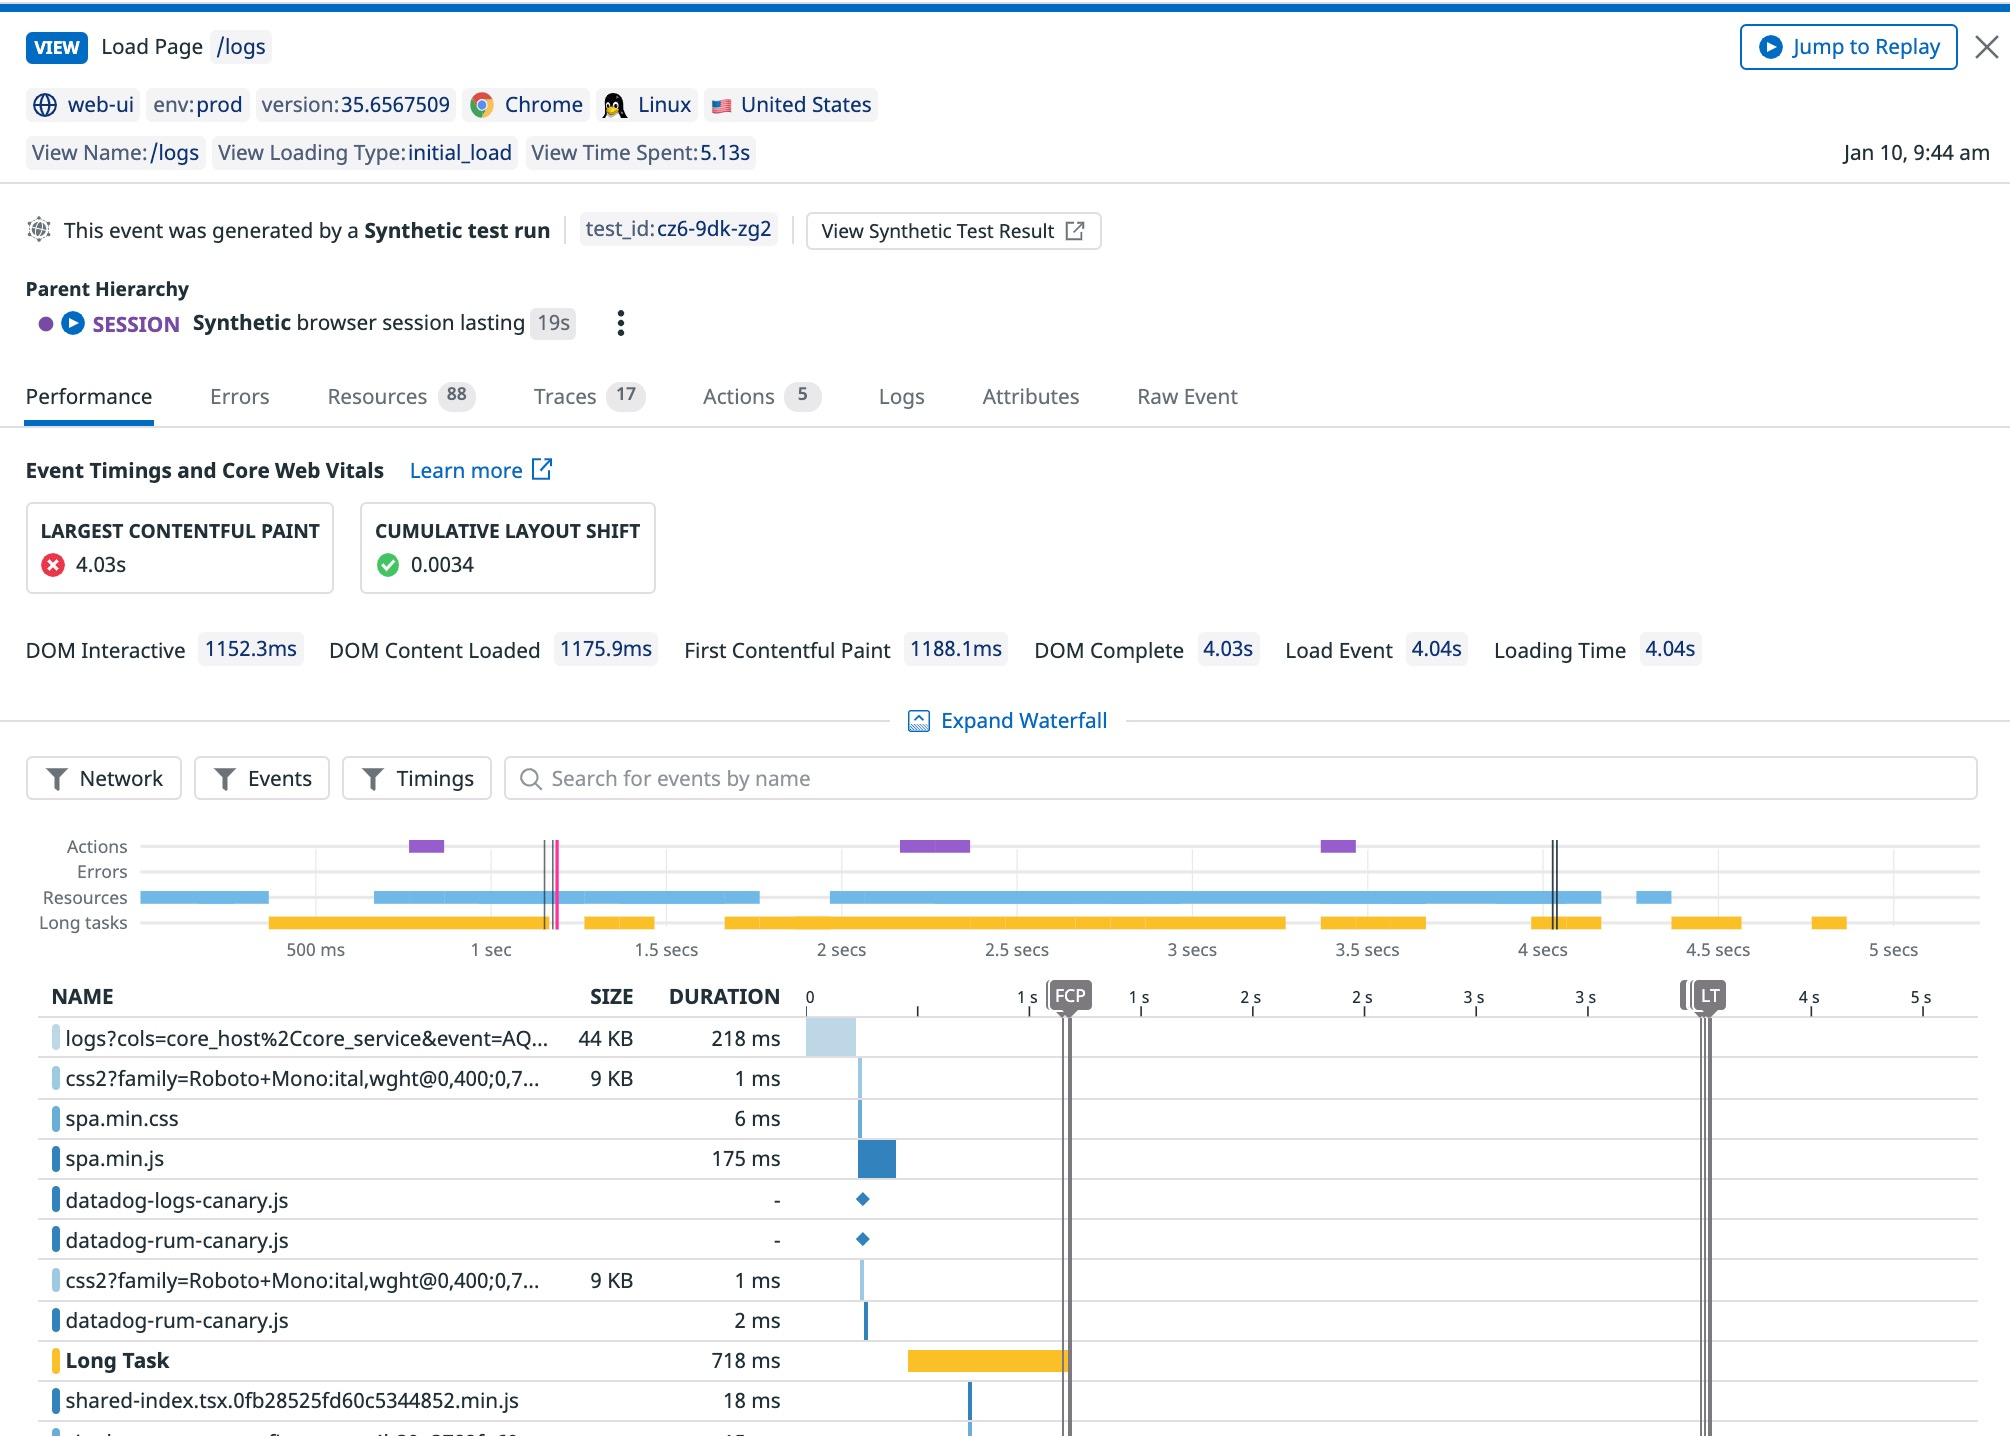
一般的なコンテキスト情報は、上部に記載されています。実際のイベントの内容を見るには、ウォーターフォールにスクロールしてください。
OS、国、コードバージョンなど、ユーザーとそのアプリケーションに関するコンテキストは、イベント発生時に取得されます。また、コンテキストはイベントそのものを指し、イベントタイプに応じた情報が含まれます。例えば、イベントサイドパネルにはビューパスが表示され、Errors サイドパネルにはエラーメッセージが表示されます。
イベントのサイドパネル
RUM エクスプローラーでイベントサイドパネルを開くには、List 可視化タイプのテーブル行をクリックします。
イベントサイドパネルには、RUM のイベントに関連するすべての情報が表示されます。ウォーターフォールは、関連するリソース、エラー、ビュー、アクションを表示し、エラーが発生したイベントやロード時間が長すぎるイベントをタイムライン形式で可視化します (ビューミニマップ)。
また、ウォーターフォールの時間セレクターをドラッグアンドドロップすることで、時間軸を拡大し、関心のあるイベントに焦点を当てることができます。
属性
RUM は、デフォルトでコンテキスト情報を収集します。また、その他のコンテキスト属性は、グローバルテキスト API と一緒に追加できます。
その他の参考資料