- 重要な情報
- はじめに
- 用語集
- Standard Attributes
- ガイド
- インテグレーション
- エージェント
- OpenTelemetry
- 開発者
- Administrator's Guide
- API
- Partners
- DDSQL Reference
- モバイルアプリケーション
- CoScreen
- CoTerm
- Remote Configuration
- Cloudcraft
- アプリ内
- ダッシュボード
- ノートブック
- DDSQL Editor
- Reference Tables
- Sheets
- Watchdog
- アラート設定
- メトリクス
- Bits AI
- Internal Developer Portal
- Error Tracking
- Change Tracking
- Service Management
- Actions & Remediations
- インフラストラクチャー
- Cloudcraft
- Resource Catalog
- ユニバーサル サービス モニタリング
- Hosts
- コンテナ
- Processes
- サーバーレス
- ネットワークモニタリング
- Cloud Cost
- アプリケーションパフォーマンス
- APM
- Continuous Profiler
- データベース モニタリング
- Data Streams Monitoring
- Data Jobs Monitoring
- Data Observability
- Digital Experience
- RUM & セッションリプレイ
- Synthetic モニタリング
- Continuous Testing
- Product Analytics
- Software Delivery
- CI Visibility (CI/CDの可視化)
- CD Visibility
- Deployment Gates
- Test Visibility
- Code Coverage
- Quality Gates
- DORA Metrics
- Feature Flags
- セキュリティ
- セキュリティの概要
- Cloud SIEM
- Code Security
- クラウド セキュリティ マネジメント
- Application Security Management
- Workload Protection
- Sensitive Data Scanner
- AI Observability
- ログ管理
- Observability Pipelines(観測データの制御)
- ログ管理
- CloudPrem
- 管理
k6
Supported OS
概要
k6 は、パフォーマンスの問題と回帰を早期に把握するのに役立つオープンソースの負荷テストツールです。
k6 インテグレーションを使用すると、k6 テストのパフォーマンスメトリクスを追跡して次のことができます。
- アプリケーションの性能と負荷試験メトリクスを関連付けます。
- 性能試験メトリクスに基づきアラートを作成します。
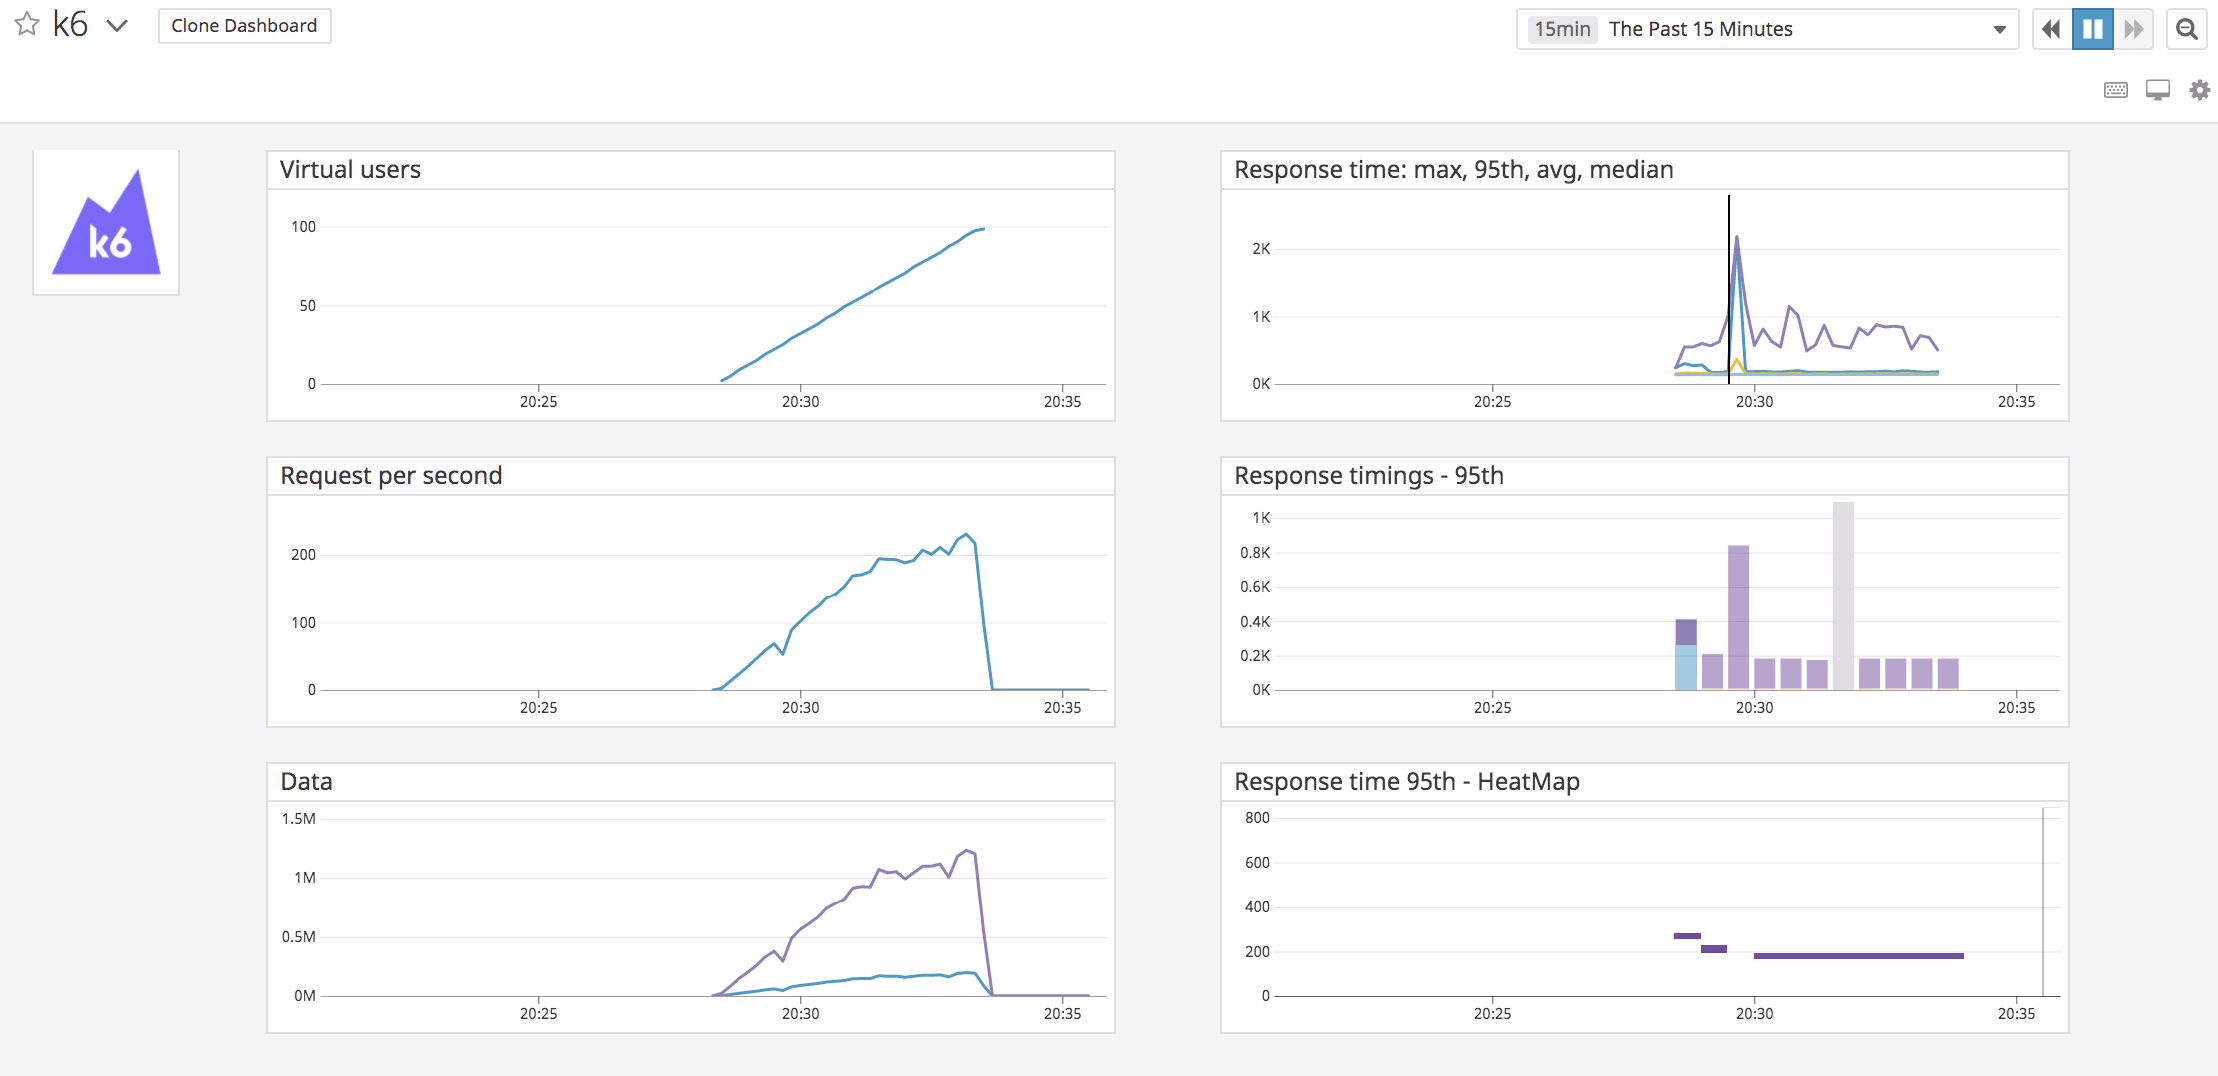
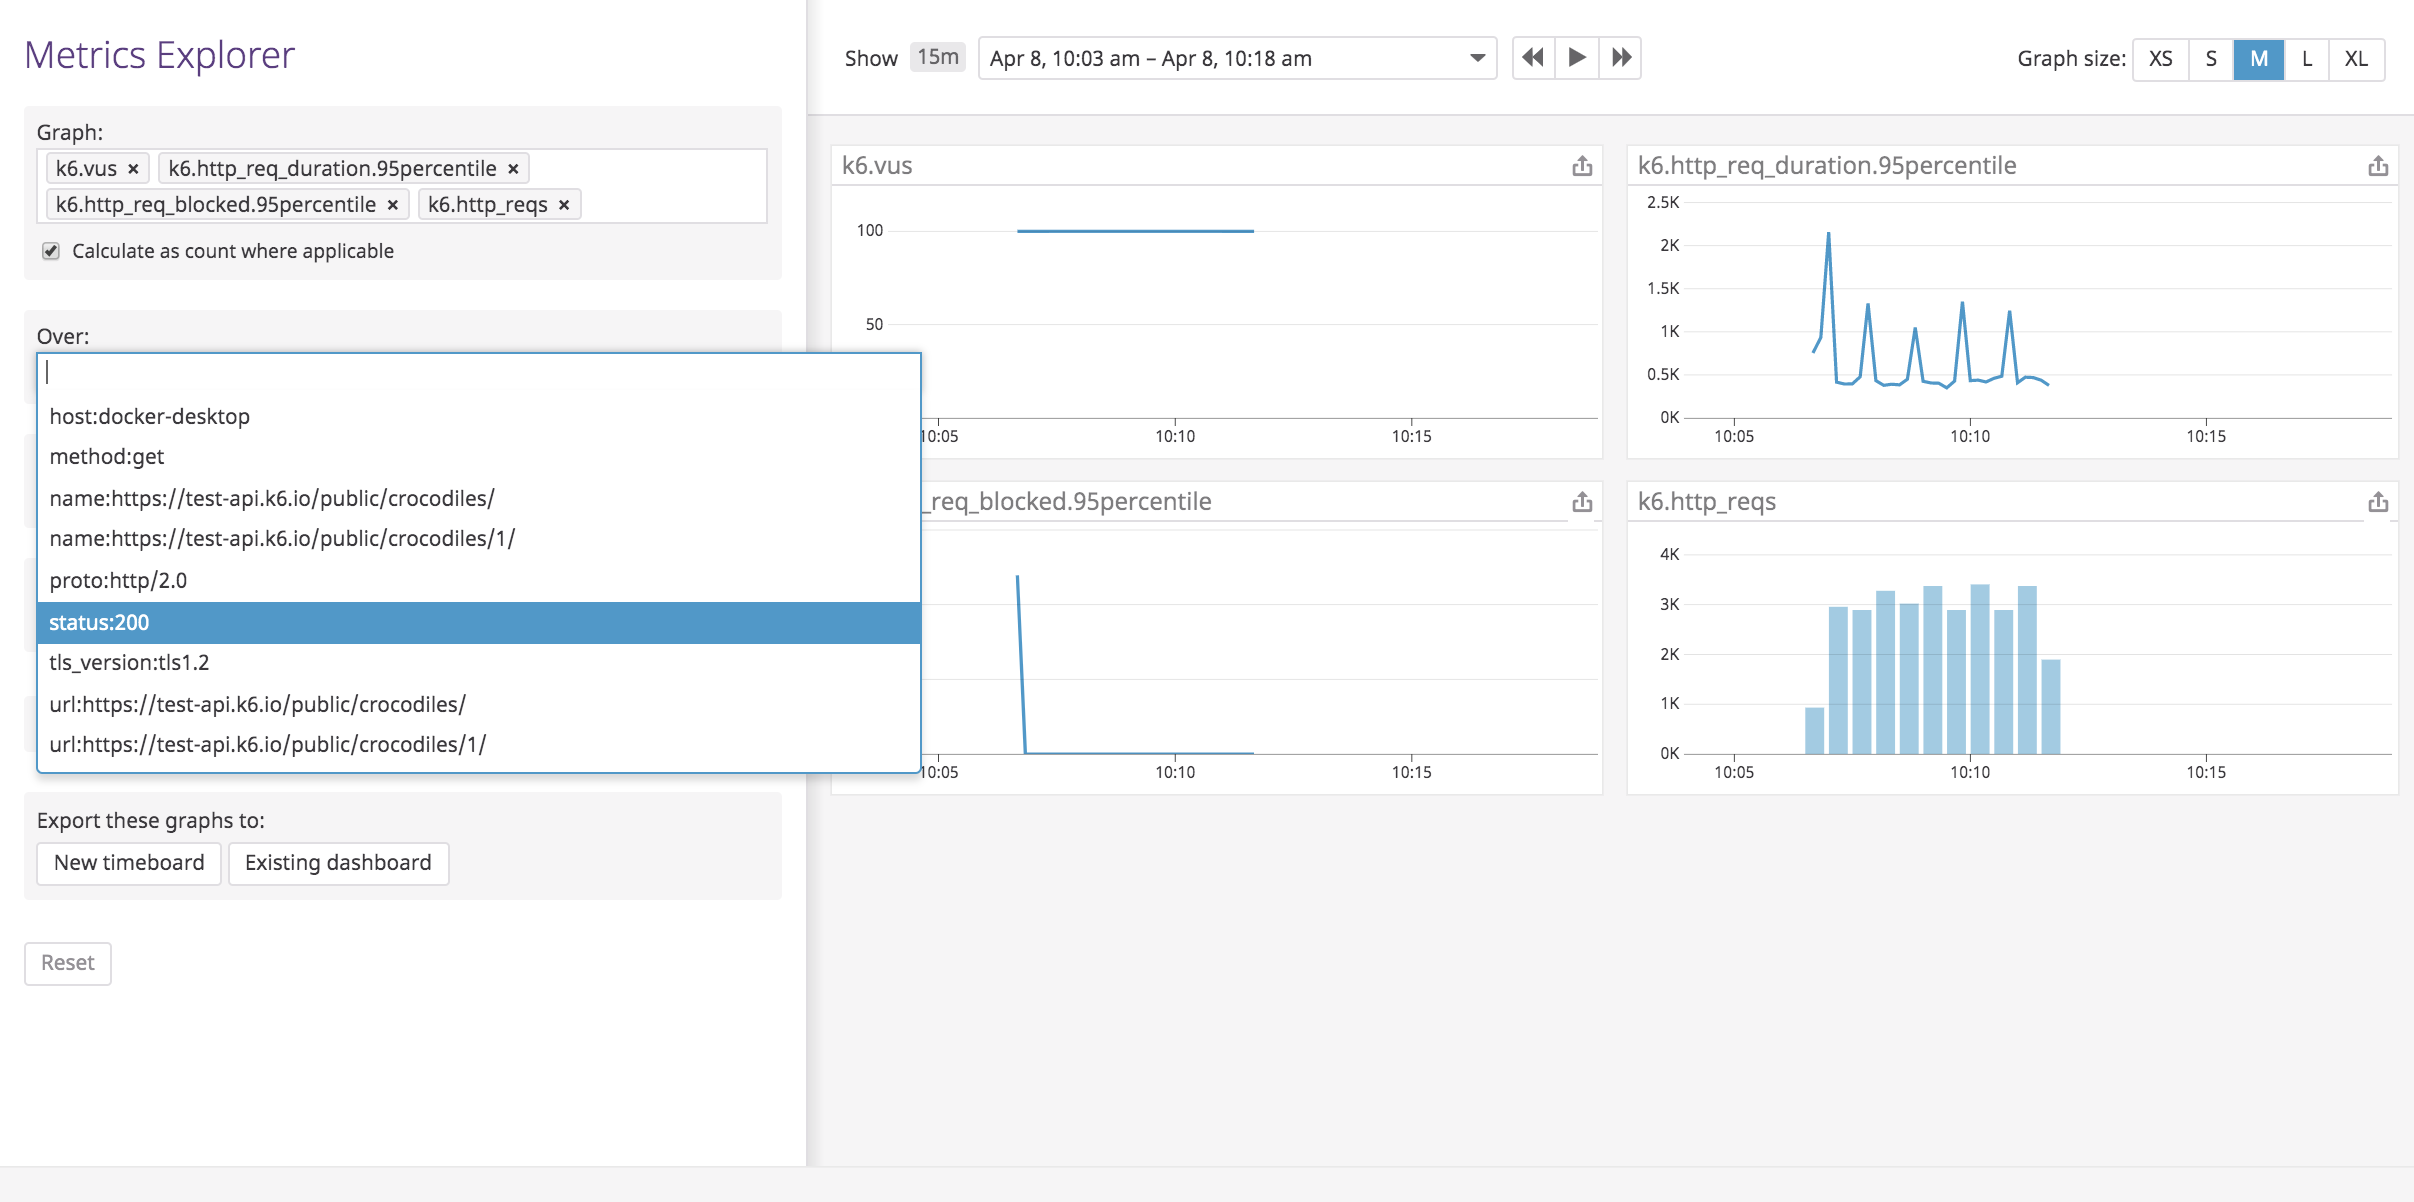
- k6 Datadog ダッシュボードやメトリクスエクスプローラーを使用して、k6 メトリクスを分析および視覚化します。

セットアップ
詳細な手順については、k6 に関するドキュメントを参照してください。
インストール
Datadog で、Integrations > API に移動して、API キーをコピーします。
Datadog Agent を実行します。
k6 メトリクスを Datadog に取り込むため、メトリクスを収集して集約し Datadog プラットフォームに転送する Datadog Agent を介して、k6 はメトリクスを送信します。
次のコマンドを使用して、Datadog Agent サービスを Docker コンテナとして実行します。
DOCKER_CONTENT_TRUST=1 \ docker run -d \ --name datadog \ -v /var/run/docker.sock:/var/run/docker.sock:ro \ -v /proc/:/host/proc/:ro \ -v /sys/fs/cgroup/:/host/sys/fs/cgroup:ro \ -e DD_SITE="datadoghq.com" \ -e DD_API_KEY=<YOUR_DATADOG_API_KEY> \ -e DD_DOGSTATSD_NON_LOCAL_TRAFFIC=1 \ -p 8125:8125/udp \ datadog/agent:latest注:
<Datadog API キー>を API キーに置き換えます。アカウントが Datadog EU に登録されている場合は、DD_SITEをdatadoghq.euにします。k6 試験を実行し、結果を Datadog に出力します。
Datadog Agent サービスを実行したら、k6 試験を実行し、以下を使用してメトリクスを Agent に送信します。
K6_STATSD_ENABLE_TAGS=true k6 run --out xk6-output-statsd script.jsDatadog で k6 メトリクスを視覚化する。
試験を実行中に k6 はメトリクスを定期的に DataDog 送信します。デフォルトでは、これらのメトリクスには名前のプレフィックスとして
k6.が含まれます。メトリクスエクスプローラー、モニター、カスタムダッシュボードで、k6 メトリクスをリアルタイムで視覚化できます。

さらに、Datadog が初めて
k6.http_reqsメトリクスを検出すると、k6 インテグレーションタイルが自動的にインストールされ、デフォルトの k6 ダッシュボードがダッシュボードリストに追加されます。
収集データ
メトリクス
| k6.data_sent (count) | The amount of data sent Shown as byte |
| k6.data_received (count) | The amount of received data Shown as byte |
| k6.http_req_blocked.avg (gauge) | Average time spent blocked before initiating the request Shown as millisecond |
| k6.http_req_blocked.max (gauge) | Max time spent blocked before initiating the request Shown as millisecond |
| k6.http_req_blocked.median (gauge) | Median time spent blocked before initiating the request Shown as millisecond |
| k6.http_req_blocked.95percentile (gauge) | 95th time spent blocked before initiating the request Shown as millisecond |
| k6.http_req_blocked.99percentile (gauge) | 99th time spent blocked before initiating the request Shown as millisecond |
| k6.http_req_blocked.count (rate) | The number of http_req_blocked values submitted during the interval Shown as unit |
| k6.http_req_connecting.avg (gauge) | Average time spent establishing TCP connection Shown as millisecond |
| k6.http_req_connecting.max (gauge) | Max time spent establishing TCP connection Shown as millisecond |
| k6.http_req_connecting.median (gauge) | Median time spent establishing TCP connection Shown as millisecond |
| k6.http_req_connecting.95percentile (gauge) | 95th time spent blocked before initiating the request Shown as millisecond |
| k6.http_req_connecting.99percentile (gauge) | 99th time spent blocked before initiating the request Shown as millisecond |
| k6.http_req_connecting.count (rate) | The number of http_req_connecting values submitted during the interval Shown as unit |
| k6.http_req_duration.avg (gauge) | Average request time Shown as millisecond |
| k6.http_req_duration.max (gauge) | Max request time Shown as millisecond |
| k6.http_req_duration.median (gauge) | Median request time Shown as millisecond |
| k6.http_req_duration.95percentile (gauge) | 95th request time Shown as millisecond |
| k6.http_req_duration.99percentile (gauge) | 99th request time Shown as millisecond |
| k6.http_req_duration.count (rate) | The number of http_req_duration values submitted during the interval Shown as unit |
| k6.http_reqs (count) | Total number of HTTP requests Shown as request |
| k6.http_req_receiving.avg (gauge) | Average time spent receiving response data Shown as millisecond |
| k6.http_req_receiving.max (gauge) | Max time spent receiving response data Shown as millisecond |
| k6.http_req_receiving.median (gauge) | Median time spent receiving response data Shown as millisecond |
| k6.http_req_receiving.95percentile (gauge) | 95th time spent receiving response data Shown as millisecond |
| k6.http_req_receiving.99percentile (gauge) | 99th time spent receiving response data Shown as millisecond |
| k6.http_req_receiving.count (rate) | The number of http_req_receiving values submitted during the interval Shown as unit |
| k6.http_req_sending.avg (gauge) | Average time spent sending data Shown as millisecond |
| k6.http_req_sending.max (gauge) | Max time spent sending data Shown as millisecond |
| k6.http_req_sending.median (gauge) | Median time spent sending data Shown as millisecond |
| k6.http_req_sending.95percentile (gauge) | 95th time spent sending data Shown as millisecond |
| k6.http_req_sending.99percentile (gauge) | 99th time spent sending data Shown as millisecond |
| k6.http_req_sending.count (rate) | The number of http_req_sending values submitted during the interval Shown as unit |
| k6.http_req_tls_handshaking.avg (gauge) | Average time spent handshaking TLS session Shown as millisecond |
| k6.http_req_tls_handshaking.max (gauge) | Max time spent handshaking TLS session Shown as millisecond |
| k6.http_req_tls_handshaking.median (gauge) | Median time spent handshaking TLS session Shown as millisecond |
| k6.http_req_tls_handshaking.95percentile (gauge) | 95th time spent handshaking TLS session Shown as millisecond |
| k6.http_req_tls_handshaking.99percentile (gauge) | 99th time spent handshaking TLS session Shown as millisecond |
| k6.http_req_tls_handshaking.count (rate) | The number of http_req_tls_handshaking values submitted during the interval Shown as unit |
| k6.http_req_waiting.avg (gauge) | Average time spent waiting for response (TTFB) Shown as millisecond |
| k6.http_req_waiting.max (gauge) | Max time spent waiting for response (TTFB) Shown as millisecond |
| k6.http_req_waiting.median (gauge) | Median time spent waiting for response (TTFB) Shown as millisecond |
| k6.http_req_waiting.95percentile (gauge) | 95th time spent waiting for response (TTFB) Shown as millisecond |
| k6.http_req_waiting.99percentile (gauge) | 99th time spent waiting for response (TTFB) Shown as millisecond |
| k6.http_req_waiting.count (rate) | The number of http_req_waiting values submitted during the interval Shown as unit |
| k6.iteration_duration.avg (gauge) | Average time spent for a VU iteration Shown as millisecond |
| k6.iteration_duration.max (gauge) | Max time spent for a VU iteration Shown as millisecond |
| k6.iteration_duration.median (gauge) | Median time spent for a VU iteration Shown as millisecond |
| k6.iteration_duration.95percentile (gauge) | 95th time spent for a VU iteration Shown as millisecond |
| k6.iteration_duration.99percentile (gauge) | 99th time spent for a VU iteration Shown as millisecond |
| k6.iteration_duration.count (rate) | The number of iteration_duration values submitted during the interval Shown as unit |
| k6.iterations (count) | Aggregated number of VU iterations Shown as unit |
| k6.vus (gauge) | Current number of active virtual users Shown as user |
| k6.vus_max (gauge) | Max possible number of virtual users Shown as user |
サービスチェック
k6 インテグレーションには、サービスのチェック機能は含まれません。
イベント
k6 インテグレーションには、イベントは含まれません。
トラブルシューティング
ご不明な点は、k6 Datadog ドキュメントをご覧いただくか、k6 サポートまでお問い合わせください。
