- Principales informations
- Getting Started
- Agent
- API
- Tracing
- Conteneurs
- Dashboards
- Database Monitoring
- Datadog
- Site Datadog
- DevSecOps
- Incident Management
- Intégrations
- Internal Developer Portal
- Logs
- Monitors
- OpenTelemetry
- Profileur
- Session Replay
- Security
- Serverless for AWS Lambda
- Software Delivery
- Surveillance Synthetic
- Tags
- Workflow Automation
- Learning Center
- Support
- Glossary
- Standard Attributes
- Guides
- Agent
- Intégrations
- Développeurs
- OpenTelemetry
- Administrator's Guide
- API
- Partners
- Application mobile
- DDSQL Reference
- CoScreen
- CoTerm
- Remote Configuration
- Cloudcraft
- In The App
- Dashboards
- Notebooks
- DDSQL Editor
- Reference Tables
- Sheets
- Alertes
- Watchdog
- Métriques
- Bits AI
- Internal Developer Portal
- Error Tracking
- Change Tracking
- Service Management
- Actions & Remediations
- Infrastructure
- Cloudcraft
- Resource Catalog
- Universal Service Monitoring
- Hosts
- Conteneurs
- Processes
- Sans serveur
- Surveillance réseau
- Cloud Cost
- Application Performance
- APM
- Termes et concepts de l'APM
- Sending Traces to Datadog
- APM Metrics Collection
- Trace Pipeline Configuration
- Connect Traces with Other Telemetry
- Trace Explorer
- Recommendations
- Code Origin for Spans
- Observabilité des services
- Endpoint Observability
- Dynamic Instrumentation
- Live Debugger
- Suivi des erreurs
- Sécurité des données
- Guides
- Dépannage
- Profileur en continu
- Database Monitoring
- Agent Integration Overhead
- Setup Architectures
- Configuration de Postgres
- Configuration de MySQL
- Configuration de SQL Server
- Setting Up Oracle
- Setting Up Amazon DocumentDB
- Setting Up MongoDB
- Connecting DBM and Traces
- Données collectées
- Exploring Database Hosts
- Explorer les métriques de requête
- Explorer des échantillons de requêtes
- Exploring Database Schemas
- Exploring Recommendations
- Dépannage
- Guides
- Data Streams Monitoring
- Data Jobs Monitoring
- Data Observability
- Digital Experience
- RUM et Session Replay
- Surveillance Synthetic
- Continuous Testing
- Product Analytics
- Software Delivery
- CI Visibility
- CD Visibility
- Deployment Gates
- Test Visibility
- Code Coverage
- Quality Gates
- DORA Metrics
- Feature Flags
- Securité
- Security Overview
- Cloud SIEM
- Code Security
- Cloud Security Management
- Application Security Management
- Workload Protection
- Sensitive Data Scanner
- AI Observability
- Log Management
- Pipelines d'observabilité
- Log Management
- CloudPrem
- Administration
k6
Supported OS
Présentation
k6 est un outil de test de charge open source qui vous permet d’identifier les problèmes de performance et les ralentissements plus rapidement.
Grâce à l’intégration k6, vous pouvez surveiller les métriques de performance liées à vos tests k6 pour :
- Corréler les performances de votre application avec les métriques d’évaluation de la charge système
- Créer des alertes en fonction des métriques d’évaluation des performances
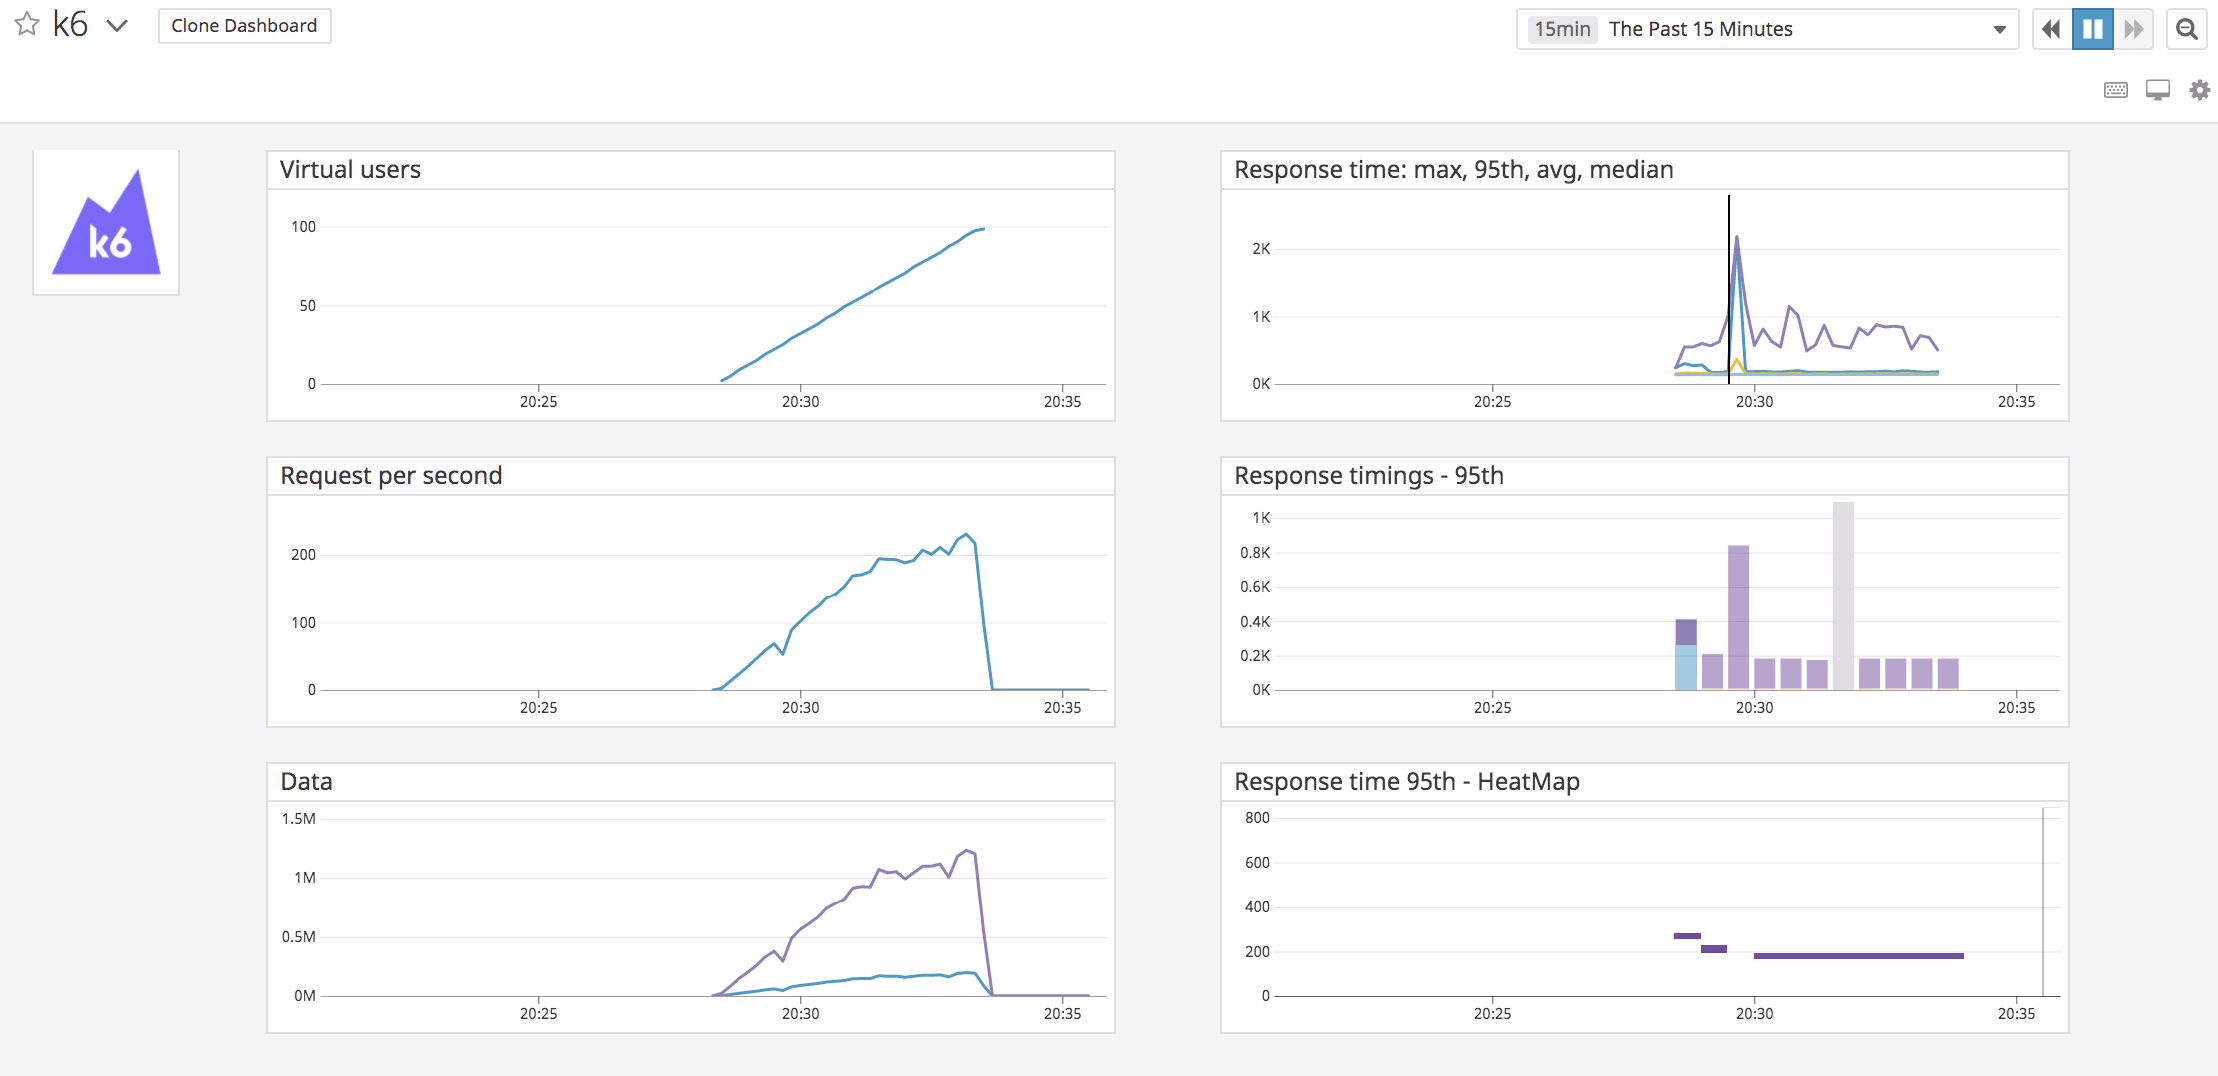
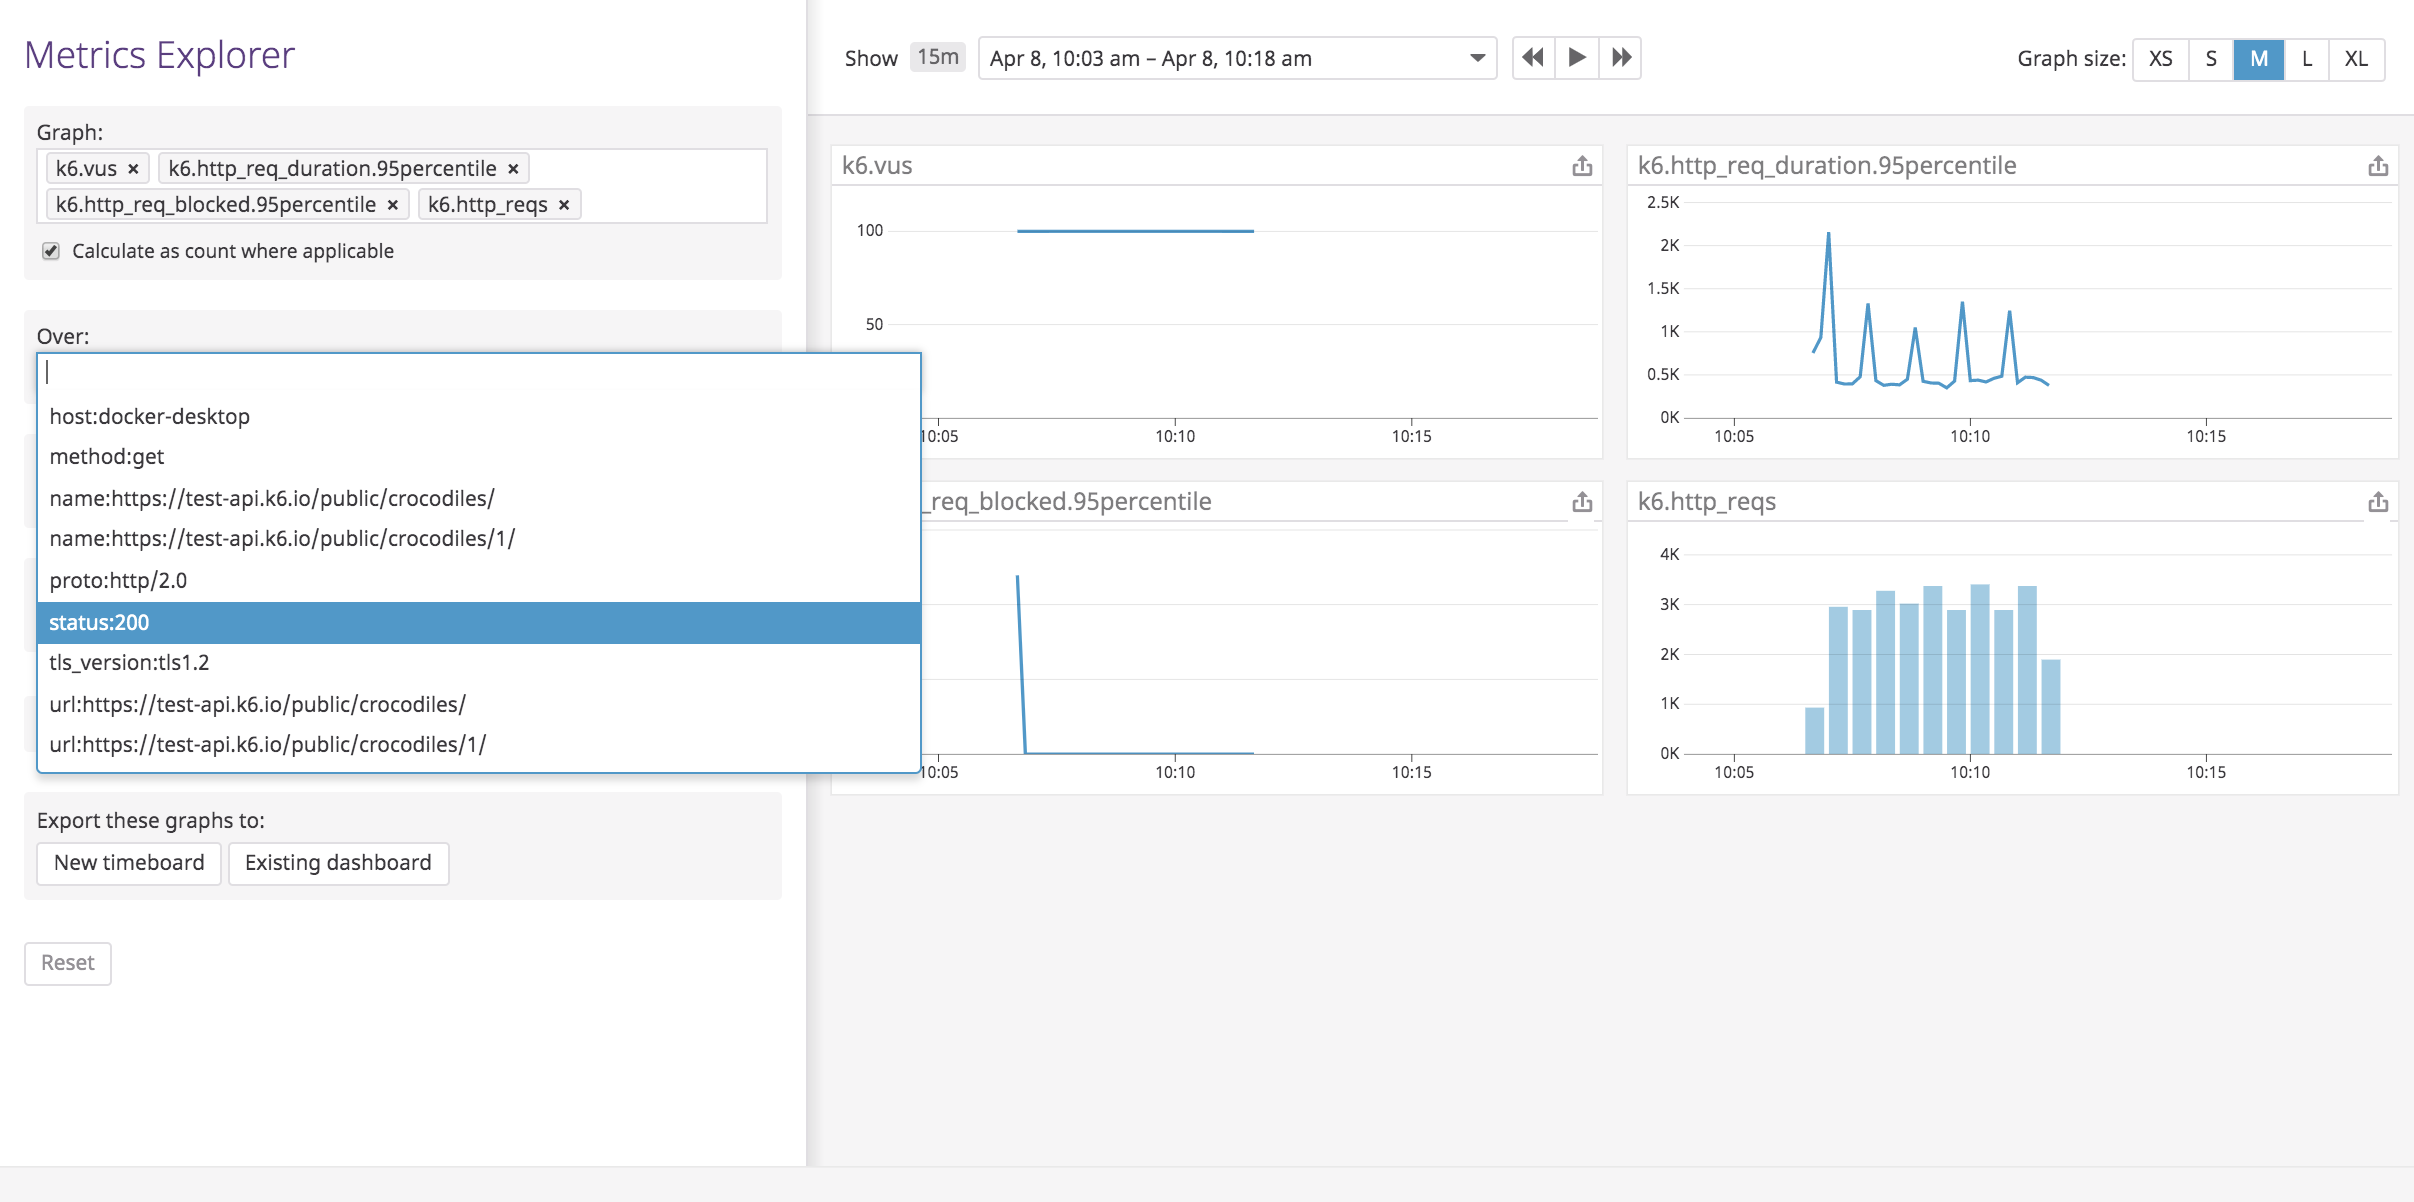
- Analyser et visualiser les métriques k6 à l’aide du dashboard k6 de Datadog ou depuis le Metrics Explorer

Configuration
Pour obtenir des instructions détaillées, consultez la documentation de k6.
Installation
Dans Datadog, accédez à Integrations > API et copiez votre clé d’API.
Exécutez l’Agent Datadog :
k6 envoie ses métriques à l’Agent Datadog, qui se charge ensuite de les recueillir, les agréger et les transmettre à la plateforme Datadog.
Exécutez l’Agent Datadog en tant que conteneur Docker avec la commande suivante :
DOCKER_CONTENT_TRUST=1 \
docker run -d \
    --name datadog \
    -v /var/run/docker.sock:/var/run/docker.sock:ro \
    -v /proc/:/host/proc/:ro \
    -v /sys/fs/cgroup/:/host/sys/fs/cgroup:ro \
    -e DD_SITE="datadoghq.com" \
    -e DD_API_KEY=<YOUR_DATADOG_API_KEY> \
    -e DD_DOGSTATSD_NON_LOCAL_TRAFFIC=1 \
    -p 8125:8125/udp \
    datadog/agent:latest
Remarque : remplacez
<YOUR_DATADOG_API_KEY>par votre clé d’API. Si votre compte utilise le site européen de Datadog, définissezDD_SITEsurdatadoghq.eu.Exécutez le test k6, puis envoyez les résultats à Datadog.
Après avoir lancé l’Agent Datadog, exécutez le test k6 et envoyez les métriques à l’Agent avec la commande suivante :
K6_STATSD_ENABLE_TAGS=true k6 run --out statsd script.jsVisualisez les métriques k6 dans Datadog.
Pendant l’exécution du test, k6 envoie les métriques de façon périodique à Datadog. Par défaut, le nom de ces métriques commence par
k6..Pour visualiser les métriques k6 en temps réel, utilisez le Metrics Explorer, les monitors ou un dashboard personnalisé.

La première fois que Datadog détecte la métrique
k6.http_reqs, le carré d’intégration k6 est automatiquement installé et le dashboard k6 par défaut est ajouté à votre liste de dashboards.
Données collectées
Métriques
| k6.data_sent (count) | The amount of data sent Shown as byte |
| k6.data_received (count) | The amount of received data Shown as byte |
| k6.http_req_blocked.avg (gauge) | Average time spent blocked before initiating the request Shown as millisecond |
| k6.http_req_blocked.max (gauge) | Max time spent blocked before initiating the request Shown as millisecond |
| k6.http_req_blocked.median (gauge) | Median time spent blocked before initiating the request Shown as millisecond |
| k6.http_req_blocked.95percentile (gauge) | 95th time spent blocked before initiating the request Shown as millisecond |
| k6.http_req_blocked.99percentile (gauge) | 99th time spent blocked before initiating the request Shown as millisecond |
| k6.http_req_blocked.count (rate) | The number of http_req_blocked values submitted during the interval Shown as unit |
| k6.http_req_connecting.avg (gauge) | Average time spent establishing TCP connection Shown as millisecond |
| k6.http_req_connecting.max (gauge) | Max time spent establishing TCP connection Shown as millisecond |
| k6.http_req_connecting.median (gauge) | Median time spent establishing TCP connection Shown as millisecond |
| k6.http_req_connecting.95percentile (gauge) | 95th time spent blocked before initiating the request Shown as millisecond |
| k6.http_req_connecting.99percentile (gauge) | 99th time spent blocked before initiating the request Shown as millisecond |
| k6.http_req_connecting.count (rate) | The number of http_req_connecting values submitted during the interval Shown as unit |
| k6.http_req_duration.avg (gauge) | Average request time Shown as millisecond |
| k6.http_req_duration.max (gauge) | Max request time Shown as millisecond |
| k6.http_req_duration.median (gauge) | Median request time Shown as millisecond |
| k6.http_req_duration.95percentile (gauge) | 95th request time Shown as millisecond |
| k6.http_req_duration.99percentile (gauge) | 99th request time Shown as millisecond |
| k6.http_req_duration.count (rate) | The number of http_req_duration values submitted during the interval Shown as unit |
| k6.http_reqs (count) | Total number of HTTP requests Shown as request |
| k6.http_req_receiving.avg (gauge) | Average time spent receiving response data Shown as millisecond |
| k6.http_req_receiving.max (gauge) | Max time spent receiving response data Shown as millisecond |
| k6.http_req_receiving.median (gauge) | Median time spent receiving response data Shown as millisecond |
| k6.http_req_receiving.95percentile (gauge) | 95th time spent receiving response data Shown as millisecond |
| k6.http_req_receiving.99percentile (gauge) | 99th time spent receiving response data Shown as millisecond |
| k6.http_req_receiving.count (rate) | The number of http_req_receiving values submitted during the interval Shown as unit |
| k6.http_req_sending.avg (gauge) | Average time spent sending data Shown as millisecond |
| k6.http_req_sending.max (gauge) | Max time spent sending data Shown as millisecond |
| k6.http_req_sending.median (gauge) | Median time spent sending data Shown as millisecond |
| k6.http_req_sending.95percentile (gauge) | 95th time spent sending data Shown as millisecond |
| k6.http_req_sending.99percentile (gauge) | 99th time spent sending data Shown as millisecond |
| k6.http_req_sending.count (rate) | The number of http_req_sending values submitted during the interval Shown as unit |
| k6.http_req_tls_handshaking.avg (gauge) | Average time spent handshaking TLS session Shown as millisecond |
| k6.http_req_tls_handshaking.max (gauge) | Max time spent handshaking TLS session Shown as millisecond |
| k6.http_req_tls_handshaking.median (gauge) | Median time spent handshaking TLS session Shown as millisecond |
| k6.http_req_tls_handshaking.95percentile (gauge) | 95th time spent handshaking TLS session Shown as millisecond |
| k6.http_req_tls_handshaking.99percentile (gauge) | 99th time spent handshaking TLS session Shown as millisecond |
| k6.http_req_tls_handshaking.count (rate) | The number of http_req_tls_handshaking values submitted during the interval Shown as unit |
| k6.http_req_waiting.avg (gauge) | Average time spent waiting for response (TTFB) Shown as millisecond |
| k6.http_req_waiting.max (gauge) | Max time spent waiting for response (TTFB) Shown as millisecond |
| k6.http_req_waiting.median (gauge) | Median time spent waiting for response (TTFB) Shown as millisecond |
| k6.http_req_waiting.95percentile (gauge) | 95th time spent waiting for response (TTFB) Shown as millisecond |
| k6.http_req_waiting.99percentile (gauge) | 99th time spent waiting for response (TTFB) Shown as millisecond |
| k6.http_req_waiting.count (rate) | The number of http_req_waiting values submitted during the interval Shown as unit |
| k6.iteration_duration.avg (gauge) | Average time spent for a VU iteration Shown as millisecond |
| k6.iteration_duration.max (gauge) | Max time spent for a VU iteration Shown as millisecond |
| k6.iteration_duration.median (gauge) | Median time spent for a VU iteration Shown as millisecond |
| k6.iteration_duration.95percentile (gauge) | 95th time spent for a VU iteration Shown as millisecond |
| k6.iteration_duration.99percentile (gauge) | 99th time spent for a VU iteration Shown as millisecond |
| k6.iteration_duration.count (rate) | The number of iteration_duration values submitted during the interval Shown as unit |
| k6.iterations (count) | Aggregated number of VU iterations Shown as unit |
| k6.vus (gauge) | Current number of active virtual users Shown as user |
| k6.vus_max (gauge) | Max possible number of virtual users Shown as user |
Checks de service
L’intégration k6 n’inclut aucun check de service.
Événements
L’intégration k6 n’inclut aucun événement.
Dépannage
Besoin d’aide ? Consultez la documentation de k6 sur Datadog ou contactez l’assistance k6.
