Supported OS Linux Windows Mac OS

概要

k6 は、パフォーマンスの問題と回帰を早期に把握するのに役立つオープンソースの負荷テストツールです。

k6 インテグレーションを使用すると、k6 テストのパフォーマンスメトリクスを追跡して次のことができます。

  • アプリケーションの性能と負荷試験メトリクスを関連付けます。
  • 性能試験メトリクスに基づきアラートを作成します。
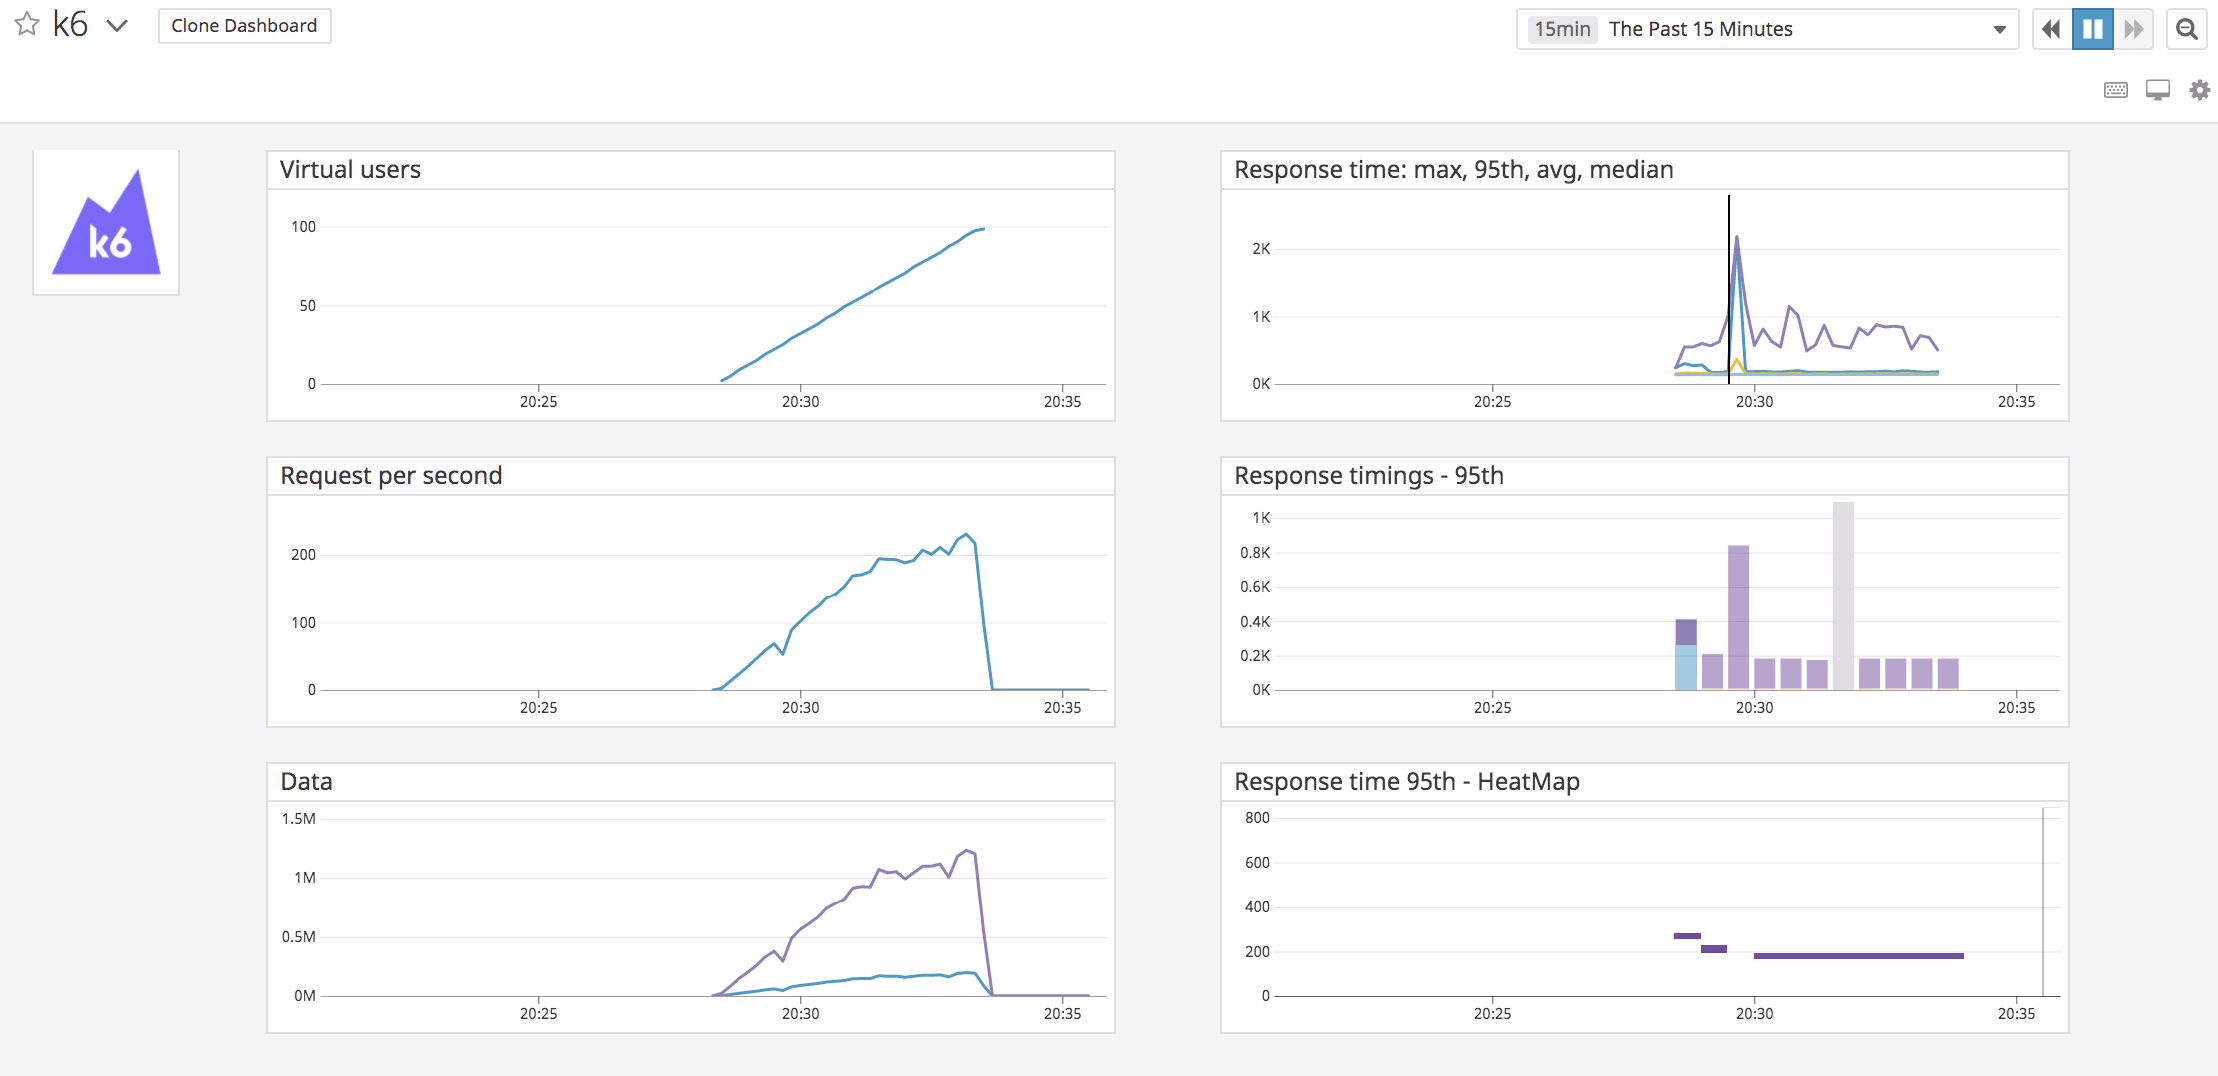
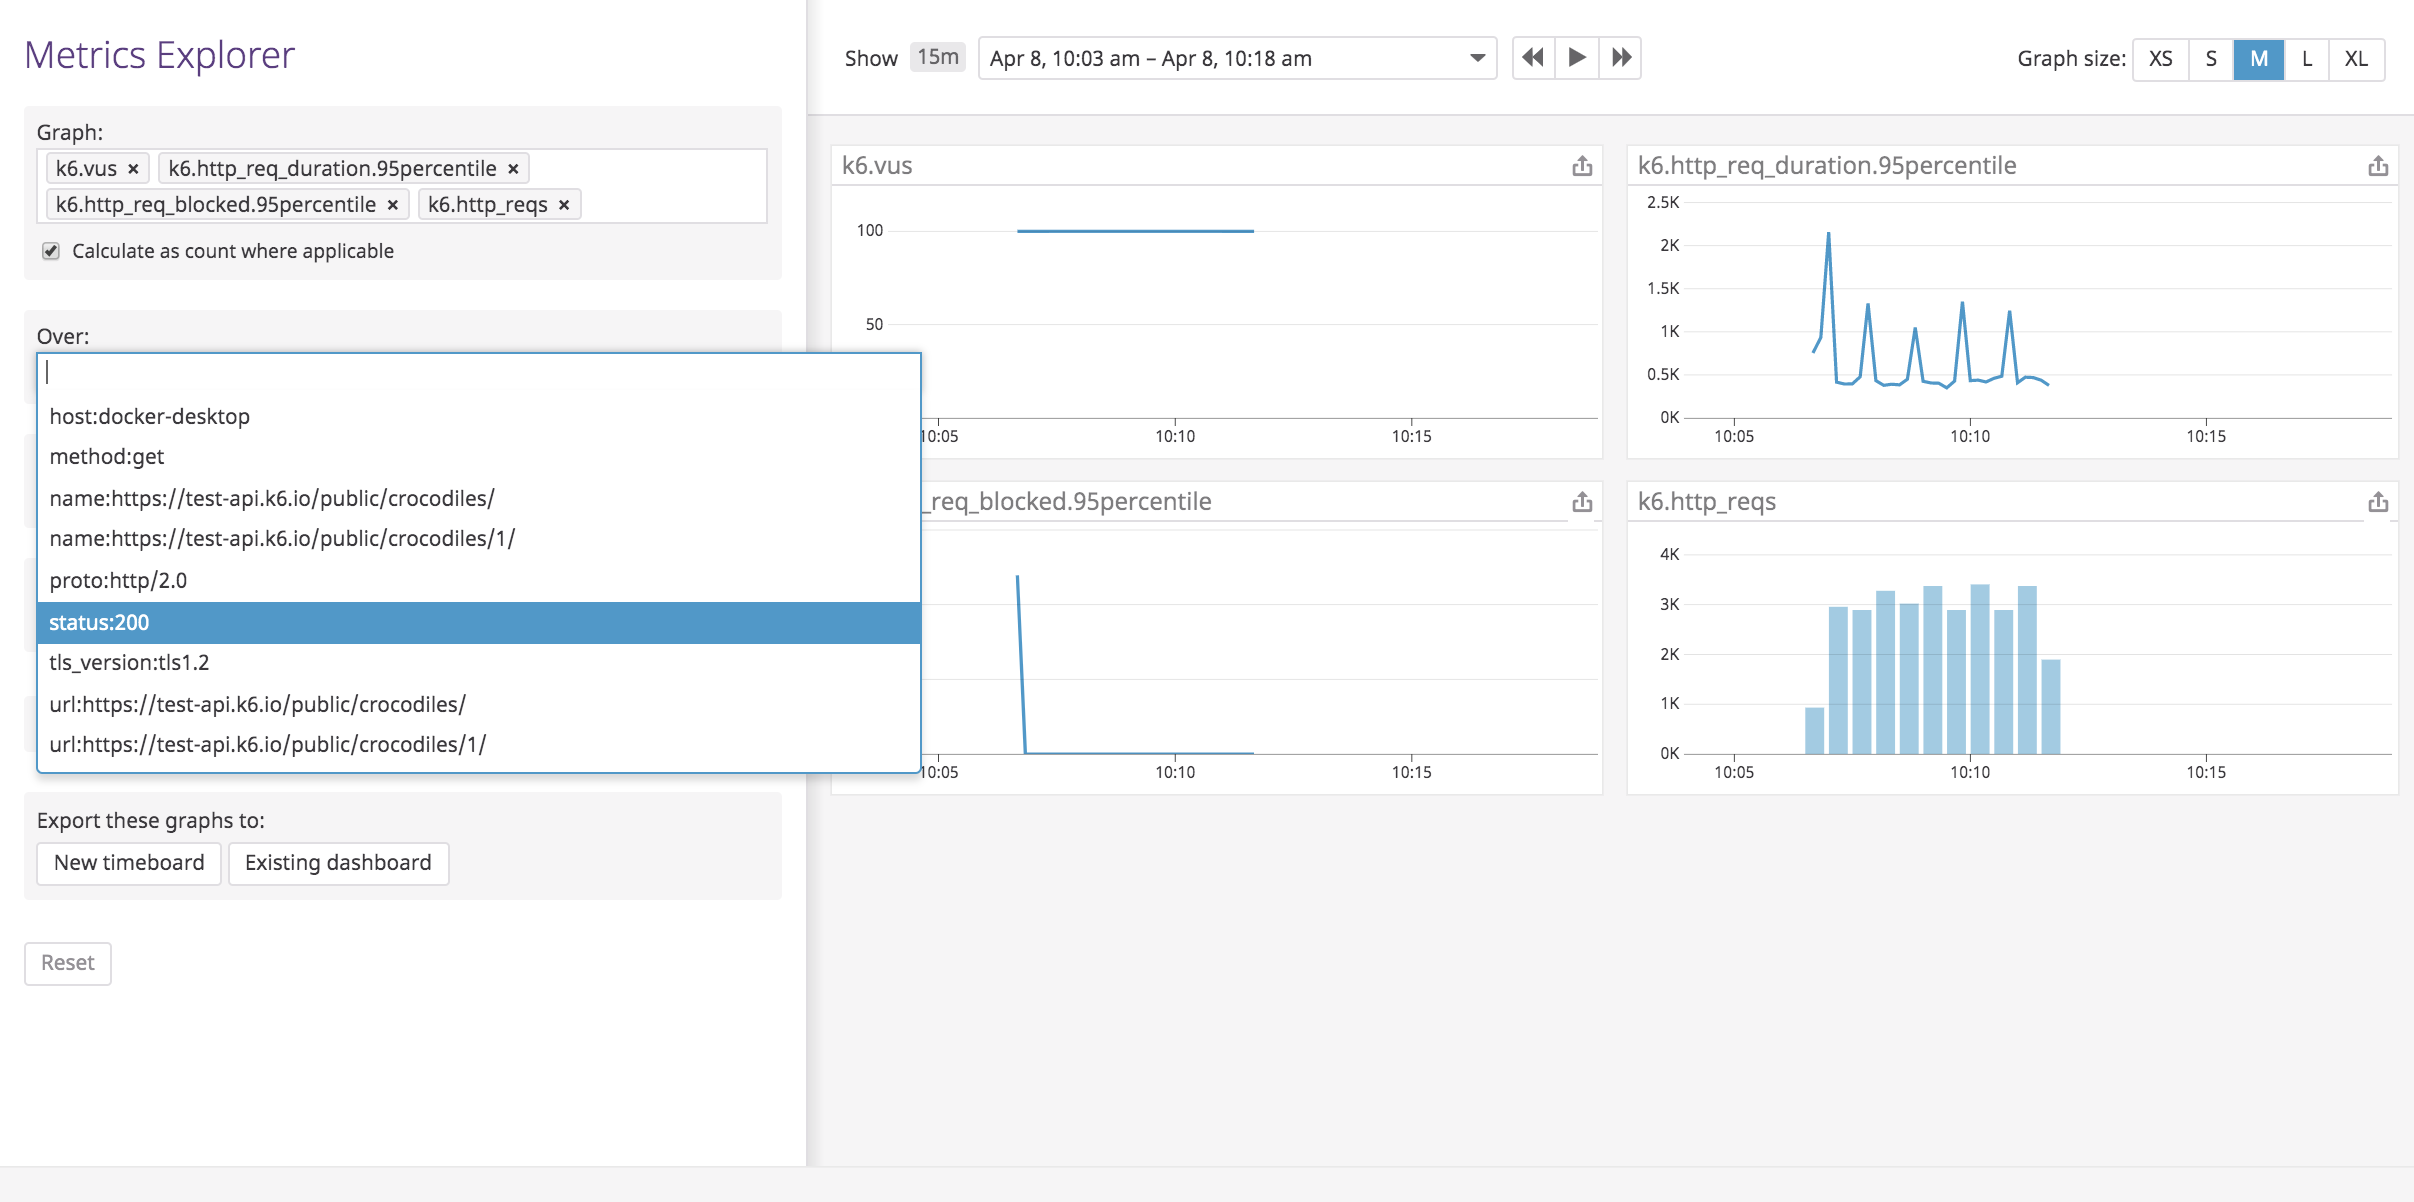
  • k6 Datadog ダッシュボードやメトリクスエクスプローラーを使用して、k6 メトリクスを分析および視覚化します。

k6 Datadog ダッシュボード

計画と使用

詳細な手順については、k6 に関するドキュメントを参照してください。

インフラストラクチャーリスト

  1. Datadog で、Integrations > API に移動して、API キーをコピーします。

  2. Datadog Agent を実行します。

    k6 メトリクスを Datadog に取り込むため、メトリクスを収集して集約し Datadog プラットフォームに転送する Datadog Agent を介して、k6 はメトリクスを送信します。

    次のコマンドを使用して、Datadog Agent サービスを Docker コンテナとして実行します。

    DOCKER_CONTENT_TRUST=1 \
    docker run -d \
        --name datadog \
        -v /var/run/docker.sock:/var/run/docker.sock:ro \
        -v /proc/:/host/proc/:ro \
        -v /sys/fs/cgroup/:/host/sys/fs/cgroup:ro \
        -e DD_SITE="datadoghq.com" \
        -e DD_API_KEY=<YOUR_DATADOG_API_KEY> \
        -e DD_DOGSTATSD_NON_LOCAL_TRAFFIC=1 \
        -p 8125:8125/udp \
        datadog/agent:latest
    

    : <Datadog API キー>API キーに置き換えます。アカウントが Datadog EU に登録されている場合は、DD_SITEdatadoghq.eu にします。

  3. k6 試験を実行し、結果を Datadog に出力します。

    Datadog Agent サービスを実行したら、k6 試験を実行し、以下を使用してメトリクスを Agent に送信します。

    K6_STATSD_ENABLE_TAGS=true k6 run --out statsd script.js
    
  4. Datadog で k6 メトリクスを視覚化する。

    試験を実行中に k6 はメトリクスを定期的に DataDog 送信します。デフォルトでは、これらのメトリクスには名前のプレフィックスとして k6.が含まれます。

    メトリクスエクスプローラーモニターカスタムダッシュボードで、k6 メトリクスをリアルタイムで視覚化できます。

    k6 Datadog メトリクスエクスプローラー

    さらに、Datadog が初めて k6.http_reqs メトリクスを検出すると、k6 インテグレーションタイルが自動的にインストールされ、デフォルトの k6 ダッシュボードがダッシュボードリストに追加されます。

    k6 Datadog ダッシュボード

リアルユーザーモニタリング

データセキュリティ

k6.data_sent
(count)
The amount of data sent
Shown as byte
k6.data_received
(count)
The amount of received data
Shown as byte
k6.http_req_blocked.avg
(gauge)
Average time spent blocked before initiating the request
Shown as millisecond
k6.http_req_blocked.max
(gauge)
Max time spent blocked before initiating the request
Shown as millisecond
k6.http_req_blocked.median
(gauge)
Median time spent blocked before initiating the request
Shown as millisecond
k6.http_req_blocked.95percentile
(gauge)
95th time spent blocked before initiating the request
Shown as millisecond
k6.http_req_blocked.99percentile
(gauge)
99th time spent blocked before initiating the request
Shown as millisecond
k6.http_req_blocked.count
(rate)
The number of httpreqblocked values submitted during the interval
Shown as unit
k6.http_req_connecting.avg
(gauge)
Average time spent establishing TCP connection
Shown as millisecond
k6.http_req_connecting.max
(gauge)
Max time spent establishing TCP connection
Shown as millisecond
k6.http_req_connecting.median
(gauge)
Median time spent establishing TCP connection
Shown as millisecond
k6.http_req_connecting.95percentile
(gauge)
95th time spent blocked before initiating the request
Shown as millisecond
k6.http_req_connecting.99percentile
(gauge)
99th time spent blocked before initiating the request
Shown as millisecond
k6.http_req_connecting.count
(rate)
The number of httpreqconnecting values submitted during the interval
Shown as unit
k6.http_req_duration.avg
(gauge)
Average request time
Shown as millisecond
k6.http_req_duration.max
(gauge)
Max request time
Shown as millisecond
k6.http_req_duration.median
(gauge)
Median request time
Shown as millisecond
k6.http_req_duration.95percentile
(gauge)
95th request time
Shown as millisecond
k6.http_req_duration.99percentile
(gauge)
99th request time
Shown as millisecond
k6.http_req_duration.count
(rate)
The number of httpreqduration values submitted during the interval
Shown as unit
k6.http_reqs
(count)
Total number of HTTP requests
Shown as request
k6.http_req_receiving.avg
(gauge)
Average time spent receiving response data
Shown as millisecond
k6.http_req_receiving.max
(gauge)
Max time spent receiving response data
Shown as millisecond
k6.http_req_receiving.median
(gauge)
Median time spent receiving response data
Shown as millisecond
k6.http_req_receiving.95percentile
(gauge)
95th time spent receiving response data
Shown as millisecond
k6.http_req_receiving.99percentile
(gauge)
99th time spent receiving response data
Shown as millisecond
k6.http_req_receiving.count
(rate)
The number of httpreqreceiving values submitted during the interval
Shown as unit
k6.http_req_sending.avg
(gauge)
Average time spent sending data
Shown as millisecond
k6.http_req_sending.max
(gauge)
Max time spent sending data
Shown as millisecond
k6.http_req_sending.median
(gauge)
Median time spent sending data
Shown as millisecond
k6.http_req_sending.95percentile
(gauge)
95th time spent sending data
Shown as millisecond
k6.http_req_sending.99percentile
(gauge)
99th time spent sending data
Shown as millisecond
k6.http_req_sending.count
(rate)
The number of httpreqsending values submitted during the interval
Shown as unit
k6.http_req_tls_handshaking.avg
(gauge)
Average time spent handshaking TLS session
Shown as millisecond
k6.http_req_tls_handshaking.max
(gauge)
Max time spent handshaking TLS session
Shown as millisecond
k6.http_req_tls_handshaking.median
(gauge)
Median time spent handshaking TLS session
Shown as millisecond
k6.http_req_tls_handshaking.95percentile
(gauge)
95th time spent handshaking TLS session
Shown as millisecond
k6.http_req_tls_handshaking.99percentile
(gauge)
99th time spent handshaking TLS session
Shown as millisecond
k6.http_req_tls_handshaking.count
(rate)
The number of httpreqtls_handshaking values submitted during the interval
Shown as unit
k6.http_req_waiting.avg
(gauge)
Average time spent waiting for response (TTFB)
Shown as millisecond
k6.http_req_waiting.max
(gauge)
Max time spent waiting for response (TTFB)
Shown as millisecond
k6.http_req_waiting.median
(gauge)
Median time spent waiting for response (TTFB)
Shown as millisecond
k6.http_req_waiting.95percentile
(gauge)
95th time spent waiting for response (TTFB)
Shown as millisecond
k6.http_req_waiting.99percentile
(gauge)
99th time spent waiting for response (TTFB)
Shown as millisecond
k6.http_req_waiting.count
(rate)
The number of httpreqwaiting values submitted during the interval
Shown as unit
k6.iteration_duration.avg
(gauge)
Average time spent for a VU iteration
Shown as millisecond
k6.iteration_duration.max
(gauge)
Max time spent for a VU iteration
Shown as millisecond
k6.iteration_duration.median
(gauge)
Median time spent for a VU iteration
Shown as millisecond
k6.iteration_duration.95percentile
(gauge)
95th time spent for a VU iteration
Shown as millisecond
k6.iteration_duration.99percentile
(gauge)
99th time spent for a VU iteration
Shown as millisecond
k6.iteration_duration.count
(rate)
The number of iteration_duration values submitted during the interval
Shown as unit
k6.iterations
(count)
Aggregated number of VU iterations
Shown as unit
k6.vus
(gauge)
Current number of active virtual users
Shown as user
k6.vus_max
(gauge)
Max possible number of virtual users
Shown as user

ヘルプ

k6 インテグレーションには、サービスのチェック機能は含まれません。

ヘルプ

k6 インテグレーションには、イベントは含まれません。

ヘルプ

ご不明な点は、k6 Datadog ドキュメントをご覧いただくか、k6 サポートまでお問い合わせください。