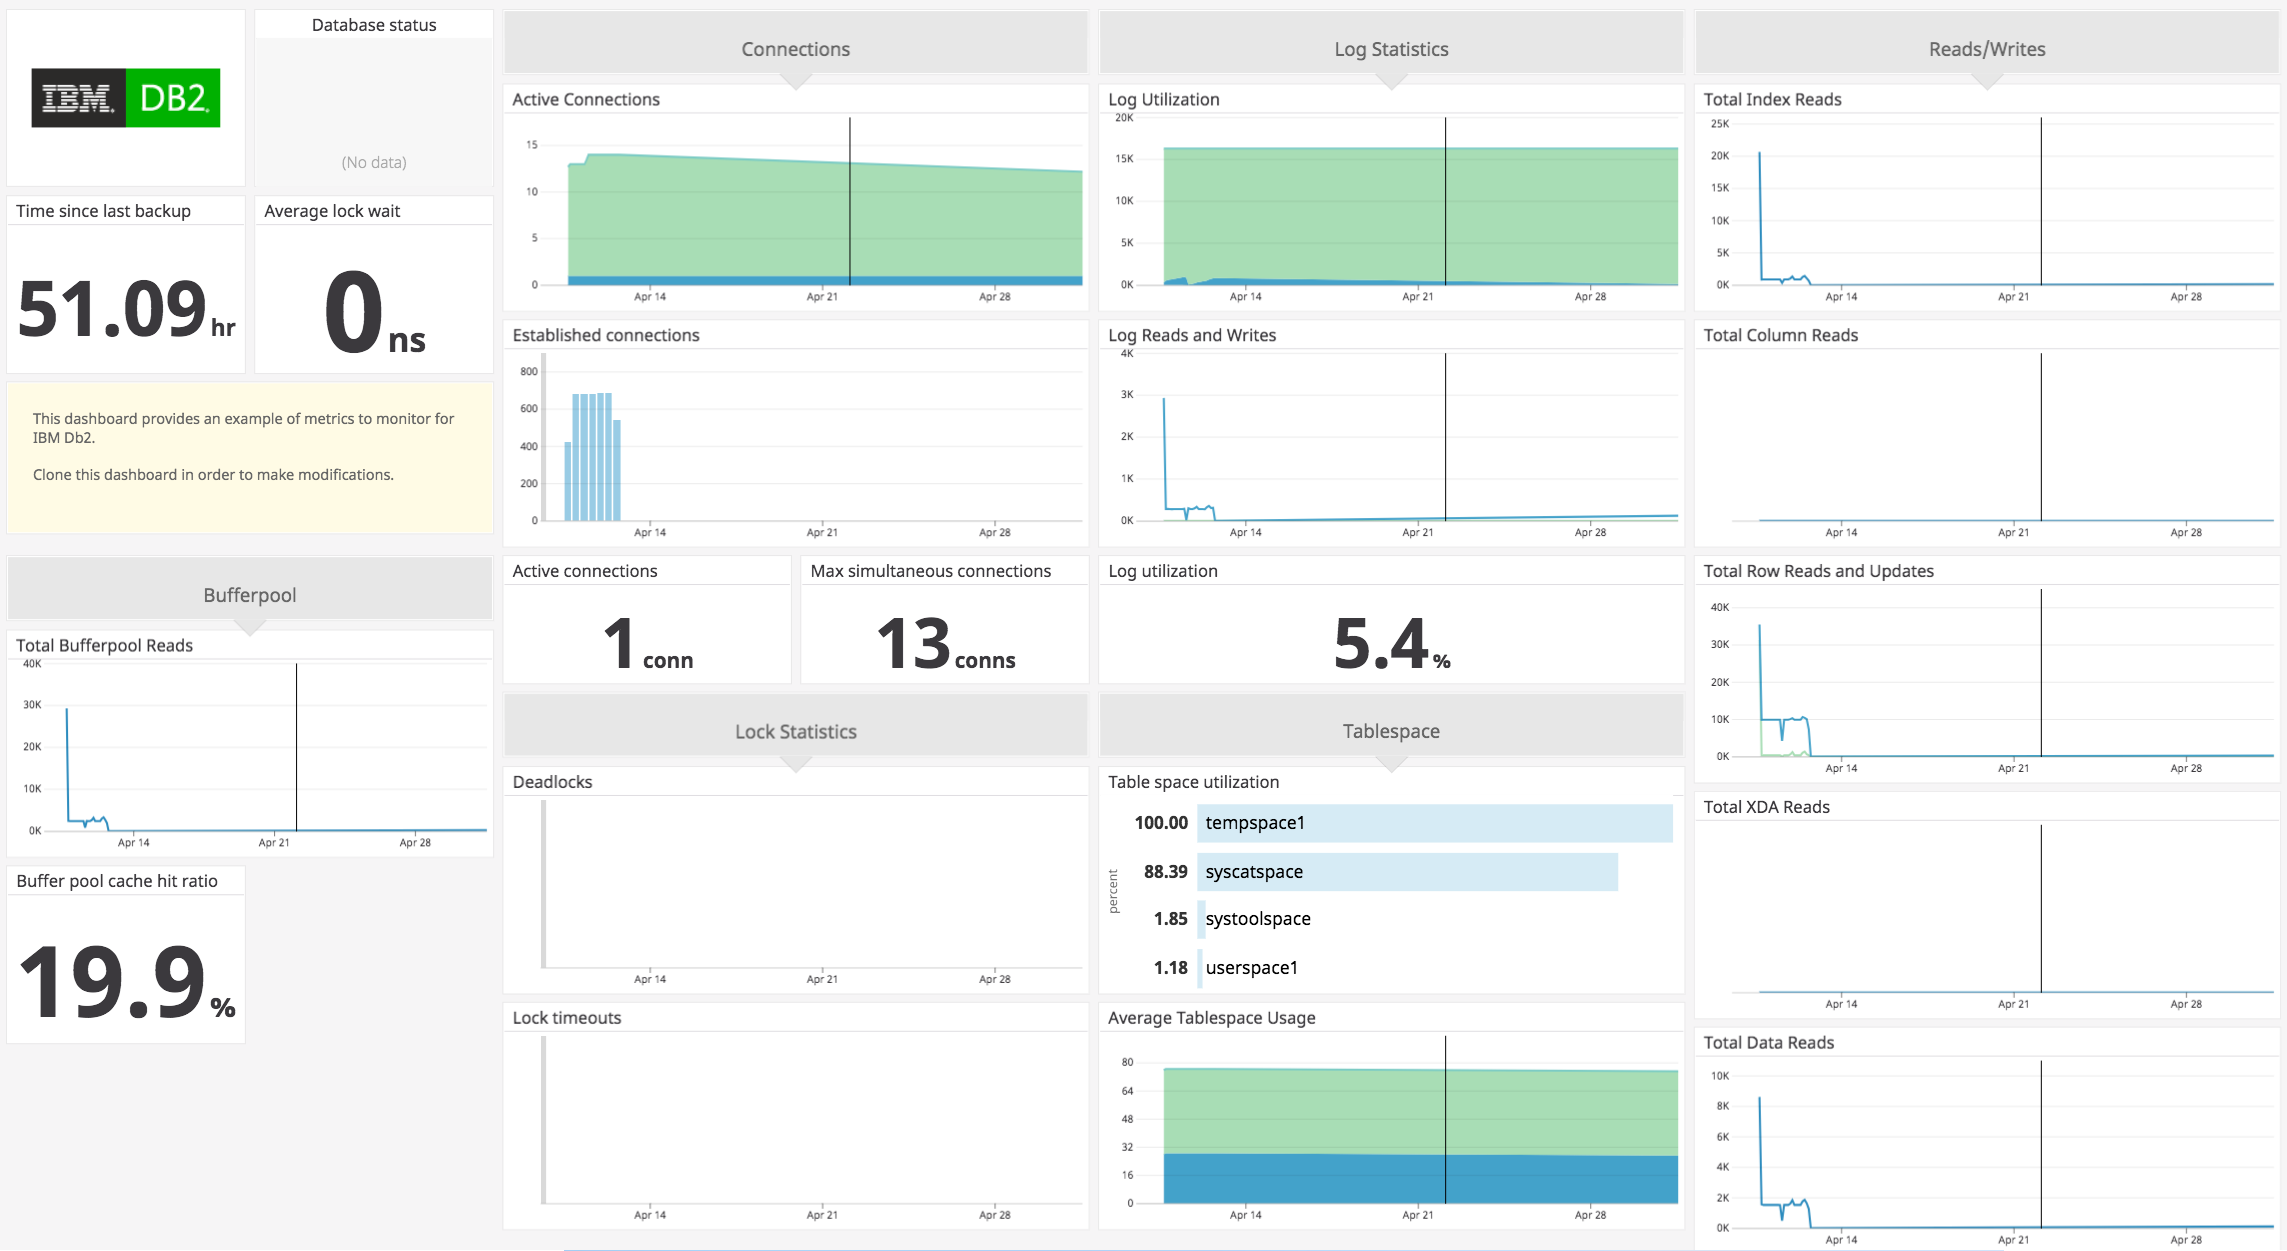
ibm_db2.application.active
(gauge) | The number of applications that are currently connected to the database.
Shown as connection |
ibm_db2.application.executing
(gauge) | The number of applications for which the database manager is currently processing a request.
Shown as connection |
ibm_db2.backup.latest
(gauge) | The time elapsed since the latest database backup was completed.
Shown as second |
ibm_db2.bufferpool.column.hit_percent
(gauge) | The percentage of time that the database manager did not need to load a page from disk to service a column-organized table data page request.
Shown as percent |
ibm_db2.bufferpool.column.reads.logical
(count) | The number of column-organized table data pages read from the logical table space containers for temporary, regular, and large table spaces.
Shown as get |
ibm_db2.bufferpool.column.reads.physical
(count) | The number of column-organized table data pages read from the physical table space containers for temporary, regular, and large table spaces.
Shown as get |
ibm_db2.bufferpool.column.reads.total
(count) | The total number of column-organized table data pages read from the table space containers for temporary, regular, and large table spaces.
Shown as get |
ibm_db2.bufferpool.data.hit_percent
(gauge) | The percentage of time that the database manager did not need to load a page from disk to service a data page request.
Shown as percent |
ibm_db2.bufferpool.data.reads.logical
(count) | The number of data pages read from the logical table space containers for temporary, regular and large table spaces.
Shown as get |
ibm_db2.bufferpool.data.reads.physical
(count) | The number of data pages read from the physical table space containers for temporary, regular and large table spaces.
Shown as get |
ibm_db2.bufferpool.data.reads.total
(count) | The total number of data pages read from the table space containers for temporary, regular and large table spaces.
Shown as get |
ibm_db2.bufferpool.group.column.hit_percent
(gauge) | The percentage of time that the group database manager did not need to load a page from disk to service a column-organized table data page request.
Shown as percent |
ibm_db2.bufferpool.group.data.hit_percent
(gauge) | The percentage of time that the group database manager did not need to load a page from disk to service a data page request.
Shown as percent |
ibm_db2.bufferpool.group.hit_percent
(gauge) | The percentage of time that the group database manager did not need to load a page from disk to service a page request.
Shown as percent |
ibm_db2.bufferpool.group.index.hit_percent
(gauge) | The percentage of time that the group database manager did not need to load a page from disk to service an index page request.
Shown as percent |
ibm_db2.bufferpool.group.xda.hit_percent
(gauge) | The percentage of time that the group database manager did not need to load a page from disk to service an index page request.
Shown as percent |
ibm_db2.bufferpool.hit_percent
(gauge) | The percentage of time that the database manager did not need to load a page from disk to service a page request.
Shown as percent |
ibm_db2.bufferpool.index.hit_percent
(gauge) | The percentage of time that the database manager did not need to load a page from disk to service an index page request.
Shown as percent |
ibm_db2.bufferpool.index.reads.logical
(count) | The number of index pages read from the logical table space containers for temporary, regular and large table spaces.
Shown as get |
ibm_db2.bufferpool.index.reads.physical
(count) | The number of index pages read from the physical table space containers for temporary, regular and large table spaces.
Shown as get |
ibm_db2.bufferpool.index.reads.total
(count) | The total number of index pages read from the table space containers for temporary, regular and large table spaces.
Shown as get |
ibm_db2.bufferpool.reads.logical
(count) | The number of pages read from the logical table space containers for temporary, regular and large table spaces.
Shown as get |
ibm_db2.bufferpool.reads.physical
(count) | The number of pages read from the physical table space containers for temporary, regular and large table spaces.
Shown as get |
ibm_db2.bufferpool.reads.total
(count) | The total number of pages read from the table space containers for temporary, regular and large table spaces.
Shown as get |
ibm_db2.bufferpool.xda.hit_percent
(gauge) | The percentage of time that the database manager did not need to load a page from disk to service an index page request.
Shown as percent |
ibm_db2.bufferpool.xda.reads.logical
(count) | The number of data pages for XML storage objects (XDAs) read from the logical table space containers for temporary, regular and large table spaces.
Shown as get |
ibm_db2.bufferpool.xda.reads.physical
(count) | The number of data pages for XML storage objects (XDAs) read from the physical table space containers for temporary, regular and large table spaces.
Shown as get |
ibm_db2.bufferpool.xda.reads.total
(count) | The total number of data pages for XML storage objects (XDAs) read from the table space containers for temporary, regular and large table spaces.
Shown as get |
ibm_db2.connection.active
(gauge) | The current number of connections.
Shown as connection |
ibm_db2.connection.max
(gauge) | The highest number of simultaneous connections to the database since the database was activated.
Shown as connection |
ibm_db2.connection.total
(count) | The total number of connections to the database since the first connect, activate, or last reset (coordinator agents).
Shown as connection |
ibm_db2.lock.active
(gauge) | The number of locks currently held.
Shown as lock |
ibm_db2.lock.dead
(count) | The total number of deadlocks that have occurred.
Shown as lock |
ibm_db2.lock.pages
(gauge) | The memory pages (4 KiB each) currently in use by the lock list.
Shown as page |
ibm_db2.lock.timeouts
(count) | The number of times that a request to lock an object timed out instead of being granted.
Shown as lock |
ibm_db2.lock.wait
(gauge) | The average wait time for a lock.
Shown as millisecond |
ibm_db2.lock.waiting
(gauge) | The number of agents waiting on a lock.
Shown as lock |
ibm_db2.log.available
(gauge) | The disk blocks (4 KiB each) of active log space in the database that is not being used by uncommitted transactions.
Shown as block |
ibm_db2.log.reads
(count) | The number of log pages read from disk by the logger.
Shown as read |
ibm_db2.log.used
(gauge) | The disk blocks (4 KiB each) of active log space currently used in the database.
Shown as block |
ibm_db2.log.utilized
(gauge) | The utilization of active log space as a percentage.
Shown as percent |
ibm_db2.log.writes
(count) | The number of log pages written to disk by the logger.
Shown as write |
ibm_db2.row.modified.total
(count) | The total number of rows inserted, updated, or deleted.
Shown as row |
ibm_db2.row.reads.total
(count) | The total number of rows that had to be read in order to return result sets.
Shown as row |
ibm_db2.row.returned.total
(count) | The total number of rows that have been selected by and returned to applications.
Shown as row |
ibm_db2.tablespace.size
(gauge) | The total size of the table space in bytes.
Shown as byte |
ibm_db2.tablespace.usable
(gauge) | The total usable size of the table space in bytes.
Shown as byte |
ibm_db2.tablespace.used
(gauge) | The total used size of the table space in bytes.
Shown as byte |
ibm_db2.tablespace.utilized
(gauge) | The utilization of the table space as a percentage.
Shown as percent |