- 重要な情報
- はじめに
- 用語集
- Standard Attributes
- ガイド
- インテグレーション
- エージェント
- OpenTelemetry
- 開発者
- Administrator's Guide
- API
- Partners
- DDSQL Reference
- モバイルアプリケーション
- CoScreen
- CoTerm
- Remote Configuration
- Cloudcraft
- アプリ内
- ダッシュボード
- ノートブック
- DDSQL Editor
- Reference Tables
- Sheets
- Watchdog
- アラート設定
- メトリクス
- Bits AI
- Internal Developer Portal
- Error Tracking
- Change Tracking
- Service Management
- Actions & Remediations
- インフラストラクチャー
- Cloudcraft
- Resource Catalog
- ユニバーサル サービス モニタリング
- Hosts
- コンテナ
- Processes
- サーバーレス
- ネットワークモニタリング
- Cloud Cost
- アプリケーションパフォーマンス
- APM
- Continuous Profiler
- データベース モニタリング
- Data Streams Monitoring
- Data Jobs Monitoring
- Data Observability
- Digital Experience
- RUM & セッションリプレイ
- Synthetic モニタリング
- Continuous Testing
- Product Analytics
- Software Delivery
- CI Visibility (CI/CDの可視化)
- CD Visibility
- Deployment Gates
- Test Visibility
- Code Coverage
- Quality Gates
- DORA Metrics
- Feature Flags
- セキュリティ
- セキュリティの概要
- Cloud SIEM
- Code Security
- クラウド セキュリティ マネジメント
- Application Security Management
- Workload Protection
- Sensitive Data Scanner
- AI Observability
- ログ管理
- Observability Pipelines(観測データの制御)
- ログ管理
- CloudPrem
- 管理
Retention Widget
このページは日本語には対応しておりません。随時翻訳に取り組んでいます。
翻訳に関してご質問やご意見ございましたら、お気軽にご連絡ください。
翻訳に関してご質問やご意見ございましたら、お気軽にご連絡ください。
The Retention widget is not available in the Datadog site ().
The Retention widget is available in Preview for Product Analytics customers. To request access, complete the form.
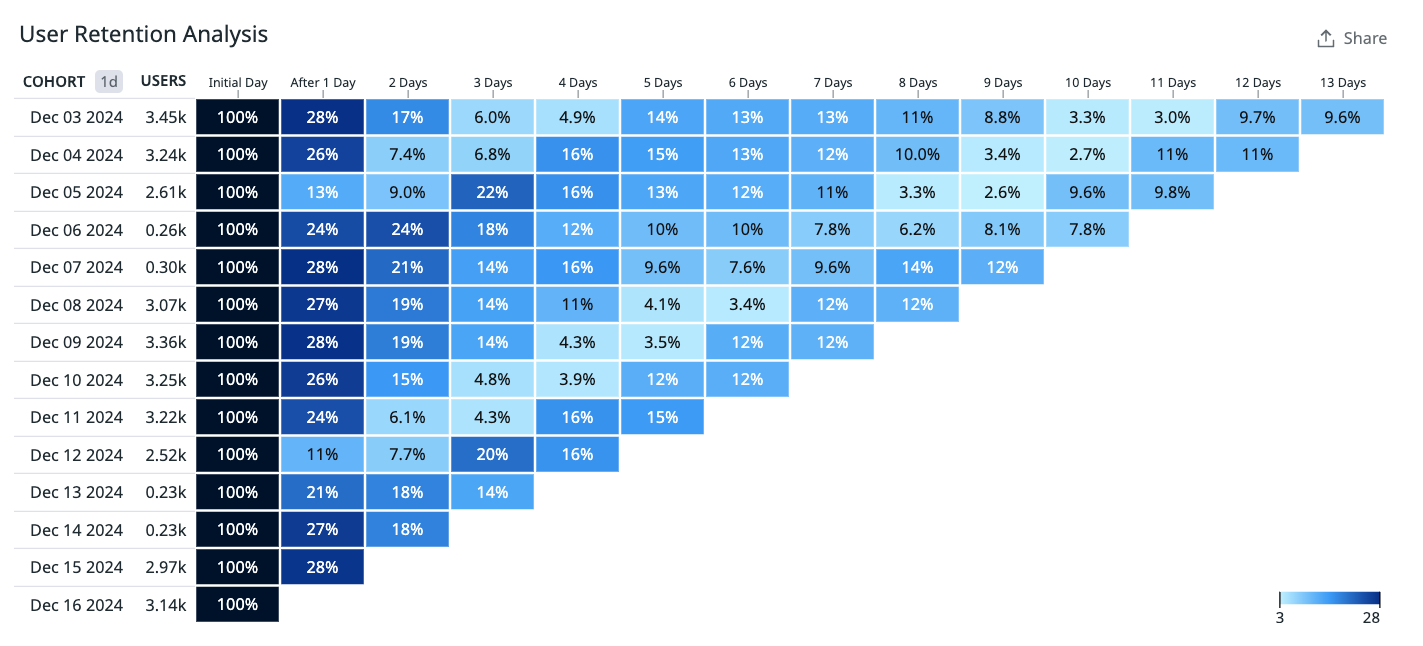
Request AccessRetention Analysis allows you to measure how often users are successfully returning to a page or performing an action. By tracking user retention over time, you can gain insights into overall user satisfaction. Use Retention Analysis to answer questions like the following:
- After visiting the checkout page and purchasing one item, what percentage of people come back and continue to do that in the following weeks?
- During the holiday season, how many people look at the catalog page once and never return?
- On a ride share app, how many people open up the app and then order a ride?
Setup
To populate user retention data, you must set the usr.id attribute in your SDK. See the instructions for sending unique user attributes.
Configuration
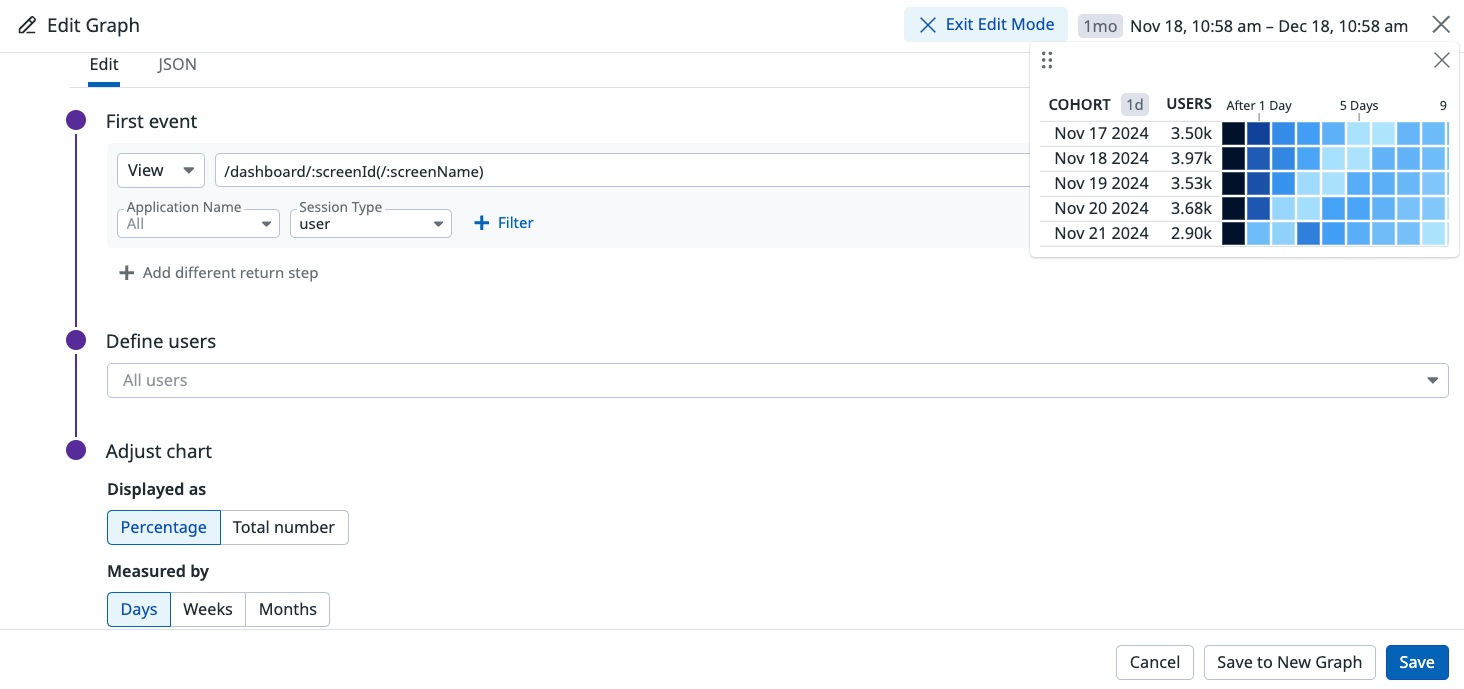
- Define the initial event by selecting View or Action and choose a query from the dropdown menu.
- (Optional) Click + Add different return step to configure a different return event from the original event.
- Define users by selecting from users or segments in the dropdown.
- Customize the chart to display either as a percentage or total number, and to measure by days, weeks, or months.
Options
Global time
On screenboards and notebooks, choose whether your widget has a custom timeframe or uses the global timeframe.


