- 重要な情報
- はじめに
- 用語集
- Standard Attributes
- ガイド
- インテグレーション
- エージェント
- OpenTelemetry
- 開発者
- Administrator's Guide
- API
- Partners
- DDSQL Reference
- モバイルアプリケーション
- CoScreen
- CoTerm
- Remote Configuration
- Cloudcraft
- アプリ内
- ダッシュボード
- ノートブック
- DDSQL Editor
- Reference Tables
- Sheets
- Watchdog
- アラート設定
- メトリクス
- Bits AI
- Internal Developer Portal
- Error Tracking
- Change Tracking
- Service Management
- Actions & Remediations
- インフラストラクチャー
- Cloudcraft
- Resource Catalog
- ユニバーサル サービス モニタリング
- Hosts
- コンテナ
- Processes
- サーバーレス
- ネットワークモニタリング
- Cloud Cost
- アプリケーションパフォーマンス
- APM
- Continuous Profiler
- データベース モニタリング
- Data Streams Monitoring
- Data Jobs Monitoring
- Data Observability
- Digital Experience
- RUM & セッションリプレイ
- Synthetic モニタリング
- Continuous Testing
- Product Analytics
- Software Delivery
- CI Visibility (CI/CDの可視化)
- CD Visibility
- Deployment Gates
- Test Visibility
- Code Coverage
- Quality Gates
- DORA Metrics
- Feature Flags
- セキュリティ
- セキュリティの概要
- Cloud SIEM
- Code Security
- クラウド セキュリティ マネジメント
- Application Security Management
- Workload Protection
- Sensitive Data Scanner
- AI Observability
- ログ管理
- Observability Pipelines(観測データの制御)
- ログ管理
- CloudPrem
- 管理
アラートグラフウィジェット
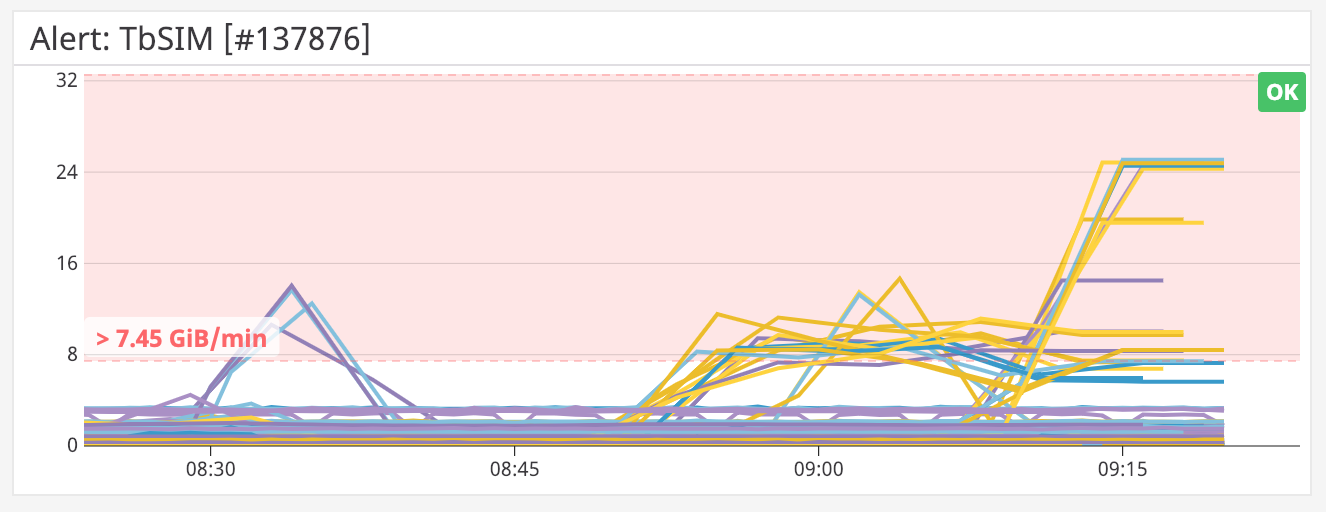
アラートグラフは、システムで定義されているほとんどのモニターの現在のステータスを表示する時系列グラフです。
このウィジェットは、メトリクス、異常値、外れ値、予測、APM メトリクス、インテグレーションなどのデフォルトのスケジュール済みクエリアラートモニターでサポートされています。
セットアップ
構成
- これまでに作成したモニターから、グラフ化するモニターを選択します。
- タイムフレームを選択します。
- 次のいずれかの可視化方法を選択します。
- Timeseries
- Toplist
API
このウィジェットは Dashboards API で使用できます。ウィジェット JSON スキーマ定義については、以下の表を参照してください。
フィールド
種類
説明
alert_id [required]
string
ID of the alert to use in the widget.
time
<oneOf>
Time setting for the widget.
Option 1
object
Wrapper for live span
hide_incomplete_cost_data
boolean
Whether to hide incomplete cost data in the widget.
live_span
enum
The available timeframes depend on the widget you are using.
Allowed enum values: 1m,5m,10m,15m,30m,1h,4h,1d,2d,1w,1mo,3mo,6mo,week_to_date,month_to_date,1y,alert
Option 2
object
Used for arbitrary live span times, such as 17 minutes or 6 hours.
hide_incomplete_cost_data
boolean
Whether to hide incomplete cost data in the widget.
type [required]
enum
Type "live" denotes a live span in the new format.
Allowed enum values: live
unit [required]
enum
Unit of the time span.
Allowed enum values: minute,hour,day,week,month,year
value [required]
int64
Value of the time span.
Option 3
object
Used for fixed span times, such as 'March 1 to March 7'.
from [required]
int64
Start time in seconds since epoch.
hide_incomplete_cost_data
boolean
Whether to hide incomplete cost data in the widget.
to [required]
int64
End time in seconds since epoch.
type [required]
enum
Type "fixed" denotes a fixed span.
Allowed enum values: fixed
title
string
The title of the widget.
title_align
enum
How to align the text on the widget.
Allowed enum values: center,left,right
title_size
string
Size of the title.
type [required]
enum
Type of the alert graph widget.
Allowed enum values: alert_graph
default: alert_graph
viz_type [required]
enum
Whether to display the Alert Graph as a timeseries or a top list.
Allowed enum values: timeseries,toplist
{
  "alert_id": "",
  "time": {
    "hide_incomplete_cost_data": false,
    "live_span": "5m"
  },
  "title": "string",
  "title_align": "string",
  "title_size": "string",
  "type": "alert_graph",
  "viz_type": "timeseries"
}
その他の参考資料
お役に立つドキュメント、リンクや記事:

