- Essentials
- Getting Started
- Agent
- API
- APM Tracing
- Containers
- Dashboards
- Database Monitoring
- Datadog
- Datadog Site
- DevSecOps
- Incident Management
- Integrations
- Internal Developer Portal
- Logs
- Monitors
- Notebooks
- OpenTelemetry
- Profiler
- Search
- Session Replay
- Security
- Serverless for AWS Lambda
- Software Delivery
- Synthetic Monitoring and Testing
- Tags
- Workflow Automation
- Learning Center
- Support
- Glossary
- Standard Attributes
- Guides
- Agent
- Integrations
- Developers
- Authorization
- DogStatsD
- Custom Checks
- Integrations
- Build an Integration with Datadog
- Create an Agent-based Integration
- Create an API-based Integration
- Create a Log Pipeline
- Integration Assets Reference
- Build a Marketplace Offering
- Create an Integration Dashboard
- Create a Monitor Template
- Create a Cloud SIEM Detection Rule
- Install Agent Integration Developer Tool
- Service Checks
- IDE Plugins
- Community
- Guides
- OpenTelemetry
- Administrator's Guide
- API
- Partners
- Datadog Mobile App
- DDSQL Reference
- CoScreen
- CoTerm
- Remote Configuration
- Cloudcraft (Standalone)
- In The App
- Dashboards
- Notebooks
- DDSQL Editor
- Reference Tables
- Sheets
- Monitors and Alerting
- Service Level Objectives
- Metrics
- Watchdog
- Bits AI
- Internal Developer Portal
- Error Tracking
- Change Tracking
- Event Management
- Incident Response
- Actions & Remediations
- Infrastructure
- Cloudcraft
- Resource Catalog
- Universal Service Monitoring
- End User Device Monitoring
- Hosts
- Containers
- Processes
- Serverless
- Network Monitoring
- Storage Management
- Cloud Cost
- Application Performance
- APM
- Continuous Profiler
- Database Monitoring
- Agent Integration Overhead
- Setup Architectures
- Setting Up Postgres
- Setting Up MySQL
- Setting Up SQL Server
- Setting Up Oracle
- Setting Up Amazon DocumentDB
- Setting Up MongoDB
- Connecting DBM and Traces
- Data Collected
- Exploring Database Hosts
- Exploring Query Metrics
- Exploring Query Samples
- Exploring Database Schemas
- Exploring Recommendations
- Troubleshooting
- Guides
- Data Streams Monitoring
- Data Observability
- Digital Experience
- Real User Monitoring
- Synthetic Testing and Monitoring
- Continuous Testing
- Product Analytics
- Session Replay
- Software Delivery
- CI Visibility
- CD Visibility
- Deployment Gates
- Test Optimization
- Code Coverage
- PR Gates
- DORA Metrics
- Feature Flags
- Security
- Security Overview
- Cloud SIEM
- Code Security
- Cloud Security
- App and API Protection
- AI Guard
- Workload Protection
- Sensitive Data Scanner
- AI Observability
- Log Management
- Observability Pipelines
- Configuration
- Sources
- Processors
- Destinations
- Packs
- Akamai CDN
- Amazon CloudFront
- Amazon VPC Flow Logs
- AWS Application Load Balancer Logs
- AWS CloudTrail
- AWS Elastic Load Balancer Logs
- AWS Network Load Balancer Logs
- Cisco ASA
- Cloudflare
- F5
- Fastly
- Fortinet Firewall
- HAProxy Ingress
- Istio Proxy
- Juniper SRX Firewall Traffic Logs
- Netskope
- NGINX
- Okta
- Palo Alto Firewall
- Windows XML
- ZScaler ZIA DNS
- Zscaler ZIA Firewall
- Zscaler ZIA Tunnel
- Zscaler ZIA Web Logs
- Search Syntax
- Scaling and Performance
- Monitoring and Troubleshooting
- Guides and Resources
- Log Management
- CloudPrem
- Administration
Alert Graph Widget
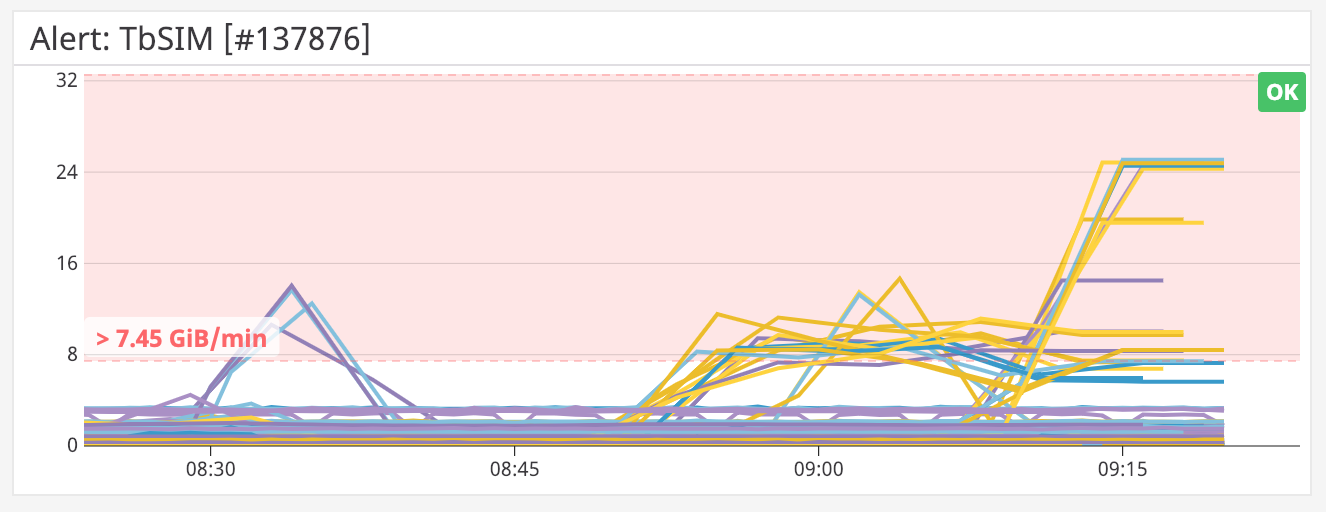
Alert graphs are timeseries graphs showing the current status of most monitors defined on your system:
This widget is supported in default scheduled query alert monitors such as metric, anomaly, outlier, forecast, APM metrics, and integration.
Setup
Configuration
- Choose a previously created monitor to graph.
- Select a timeframe.
- Select your visualization:
- Timeseries
- Top list
API
This widget can be used with the Dashboards API. See the following table for the widget JSON schema definition:
Field
Type
Description
alert_id [required]
string
ID of the alert to use in the widget.
time
<oneOf>
Time setting for the widget.
Option 1
object
Wrapper for live span
hide_incomplete_cost_data
boolean
Whether to hide incomplete cost data in the widget.
live_span
enum
The available timeframes depend on the widget you are using.
Allowed enum values: 1m,5m,10m,15m,30m,1h,4h,1d,2d,1w,1mo,3mo,6mo,week_to_date,month_to_date,1y,alert
Option 2
object
Used for arbitrary live span times, such as 17 minutes or 6 hours.
hide_incomplete_cost_data
boolean
Whether to hide incomplete cost data in the widget.
type [required]
enum
Type "live" denotes a live span in the new format.
Allowed enum values: live
unit [required]
enum
Unit of the time span.
Allowed enum values: minute,hour,day,week,month,year
value [required]
int64
Value of the time span.
Option 3
object
Used for fixed span times, such as 'March 1 to March 7'.
from [required]
int64
Start time in seconds since epoch.
hide_incomplete_cost_data
boolean
Whether to hide incomplete cost data in the widget.
to [required]
int64
End time in seconds since epoch.
type [required]
enum
Type "fixed" denotes a fixed span.
Allowed enum values: fixed
title
string
The title of the widget.
title_align
enum
How to align the text on the widget.
Allowed enum values: center,left,right
title_size
string
Size of the title.
type [required]
enum
Type of the alert graph widget.
Allowed enum values: alert_graph
default: alert_graph
viz_type [required]
enum
Whether to display the Alert Graph as a timeseries or a top list.
Allowed enum values: timeseries,toplist
{
  "alert_id": "",
  "time": {
    "hide_incomplete_cost_data": false,
    "live_span": "5m"
  },
  "title": "string",
  "title_align": "string",
  "title_size": "string",
  "type": "alert_graph",
  "viz_type": "timeseries"
}
Further Reading
Additional helpful documentation, links, and articles:

