- Principales informations
- Getting Started
- Agent
- API
- Tracing
- Conteneurs
- Dashboards
- Database Monitoring
- Datadog
- Site Datadog
- DevSecOps
- Incident Management
- Intégrations
- Internal Developer Portal
- Logs
- Monitors
- OpenTelemetry
- Profileur
- Session Replay
- Security
- Serverless for AWS Lambda
- Software Delivery
- Surveillance Synthetic
- Tags
- Workflow Automation
- Learning Center
- Support
- Glossary
- Standard Attributes
- Guides
- Agent
- Intégrations
- Développeurs
- OpenTelemetry
- Administrator's Guide
- API
- Partners
- Application mobile
- DDSQL Reference
- CoScreen
- CoTerm
- Remote Configuration
- Cloudcraft
- In The App
- Dashboards
- Notebooks
- DDSQL Editor
- Reference Tables
- Sheets
- Alertes
- Watchdog
- Métriques
- Bits AI
- Internal Developer Portal
- Error Tracking
- Change Tracking
- Service Management
- Actions & Remediations
- Infrastructure
- Cloudcraft
- Resource Catalog
- Universal Service Monitoring
- Hosts
- Conteneurs
- Processes
- Sans serveur
- Surveillance réseau
- Cloud Cost
- Application Performance
- APM
- Termes et concepts de l'APM
- Sending Traces to Datadog
- APM Metrics Collection
- Trace Pipeline Configuration
- Connect Traces with Other Telemetry
- Trace Explorer
- Recommendations
- Code Origin for Spans
- Observabilité des services
- Endpoint Observability
- Dynamic Instrumentation
- Live Debugger
- Suivi des erreurs
- Sécurité des données
- Guides
- Dépannage
- Profileur en continu
- Database Monitoring
- Agent Integration Overhead
- Setup Architectures
- Configuration de Postgres
- Configuration de MySQL
- Configuration de SQL Server
- Setting Up Oracle
- Setting Up Amazon DocumentDB
- Setting Up MongoDB
- Connecting DBM and Traces
- Données collectées
- Exploring Database Hosts
- Explorer les métriques de requête
- Explorer des échantillons de requêtes
- Exploring Database Schemas
- Exploring Recommendations
- Dépannage
- Guides
- Data Streams Monitoring
- Data Jobs Monitoring
- Data Observability
- Digital Experience
- RUM et Session Replay
- Surveillance Synthetic
- Continuous Testing
- Product Analytics
- Software Delivery
- CI Visibility
- CD Visibility
- Deployment Gates
- Test Visibility
- Code Coverage
- Quality Gates
- DORA Metrics
- Feature Flags
- Securité
- Security Overview
- Cloud SIEM
- Code Security
- Cloud Security Management
- Application Security Management
- Workload Protection
- Sensitive Data Scanner
- AI Observability
- Log Management
- Pipelines d'observabilité
- Log Management
- CloudPrem
- Administration
Alerting With Conversion Rates
Cette page n'est pas encore disponible en français, sa traduction est en cours.
Si vous avez des questions ou des retours sur notre projet de traduction actuel, n'hésitez pas à nous contacter.
Si vous avez des questions ou des retours sur notre projet de traduction actuel, n'hésitez pas à nous contacter.
Overview
Conversion rates are crucial in monitoring the success of a user workflow. This guide describes how to generate conversion rates in the Product Analytics funnel visualization and create alerts that notify you when conversion rates dip below a given threshold.
Create a funnel in the RUM Explorer
In Datadog, navigate to Digital Experience > Product Analytics > Funnels.
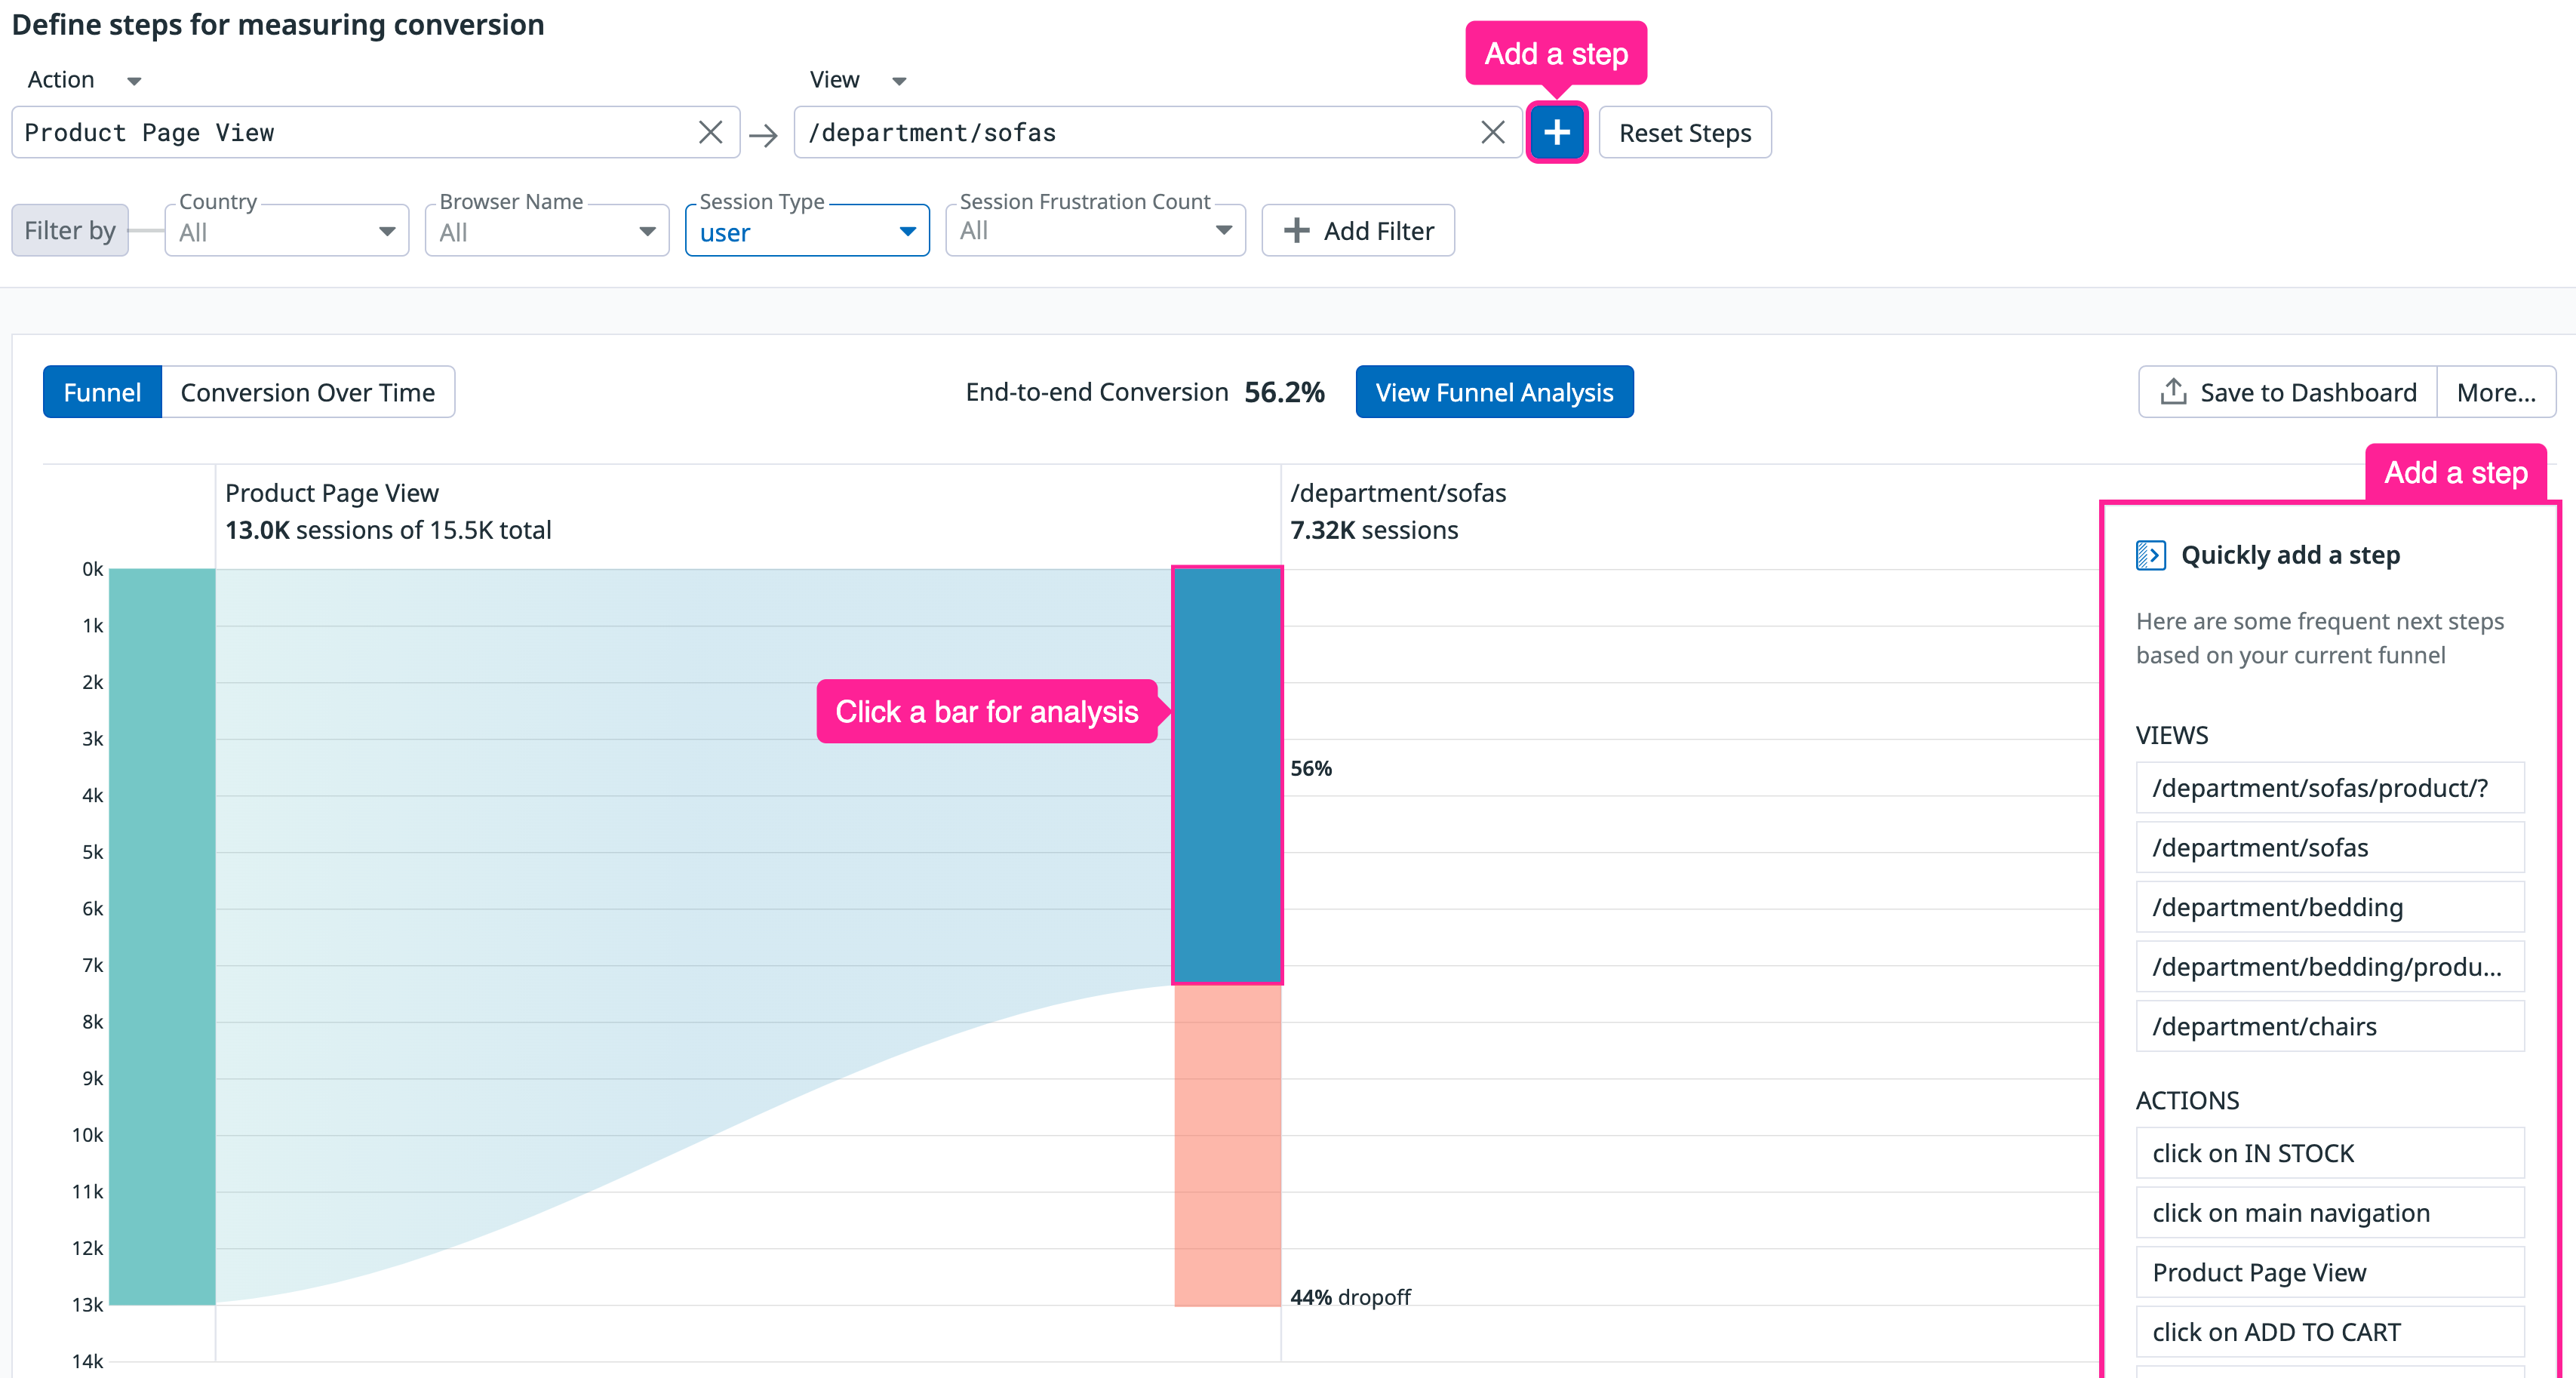
In the Define steps for measuring conversion section, create some steps from your views and actions. You can click on the bar graphs to see a side panel with analytics about user conversions and dropoffs. To add a subsequent view or action in the funnel, click + and select from frequent next steps.
Export the conversion rate graph
The funnel displays the overall conversion and dropoff rates, the number of converted or dropoff sessions, and the percentage of converted or dropoff sessions.
Click the Save to Dashboard button and select an existing dashboard from the dropdown menu to export the graph to. Optionally, click New Dashboard to create a dashboard.
Edit the conversion rate query
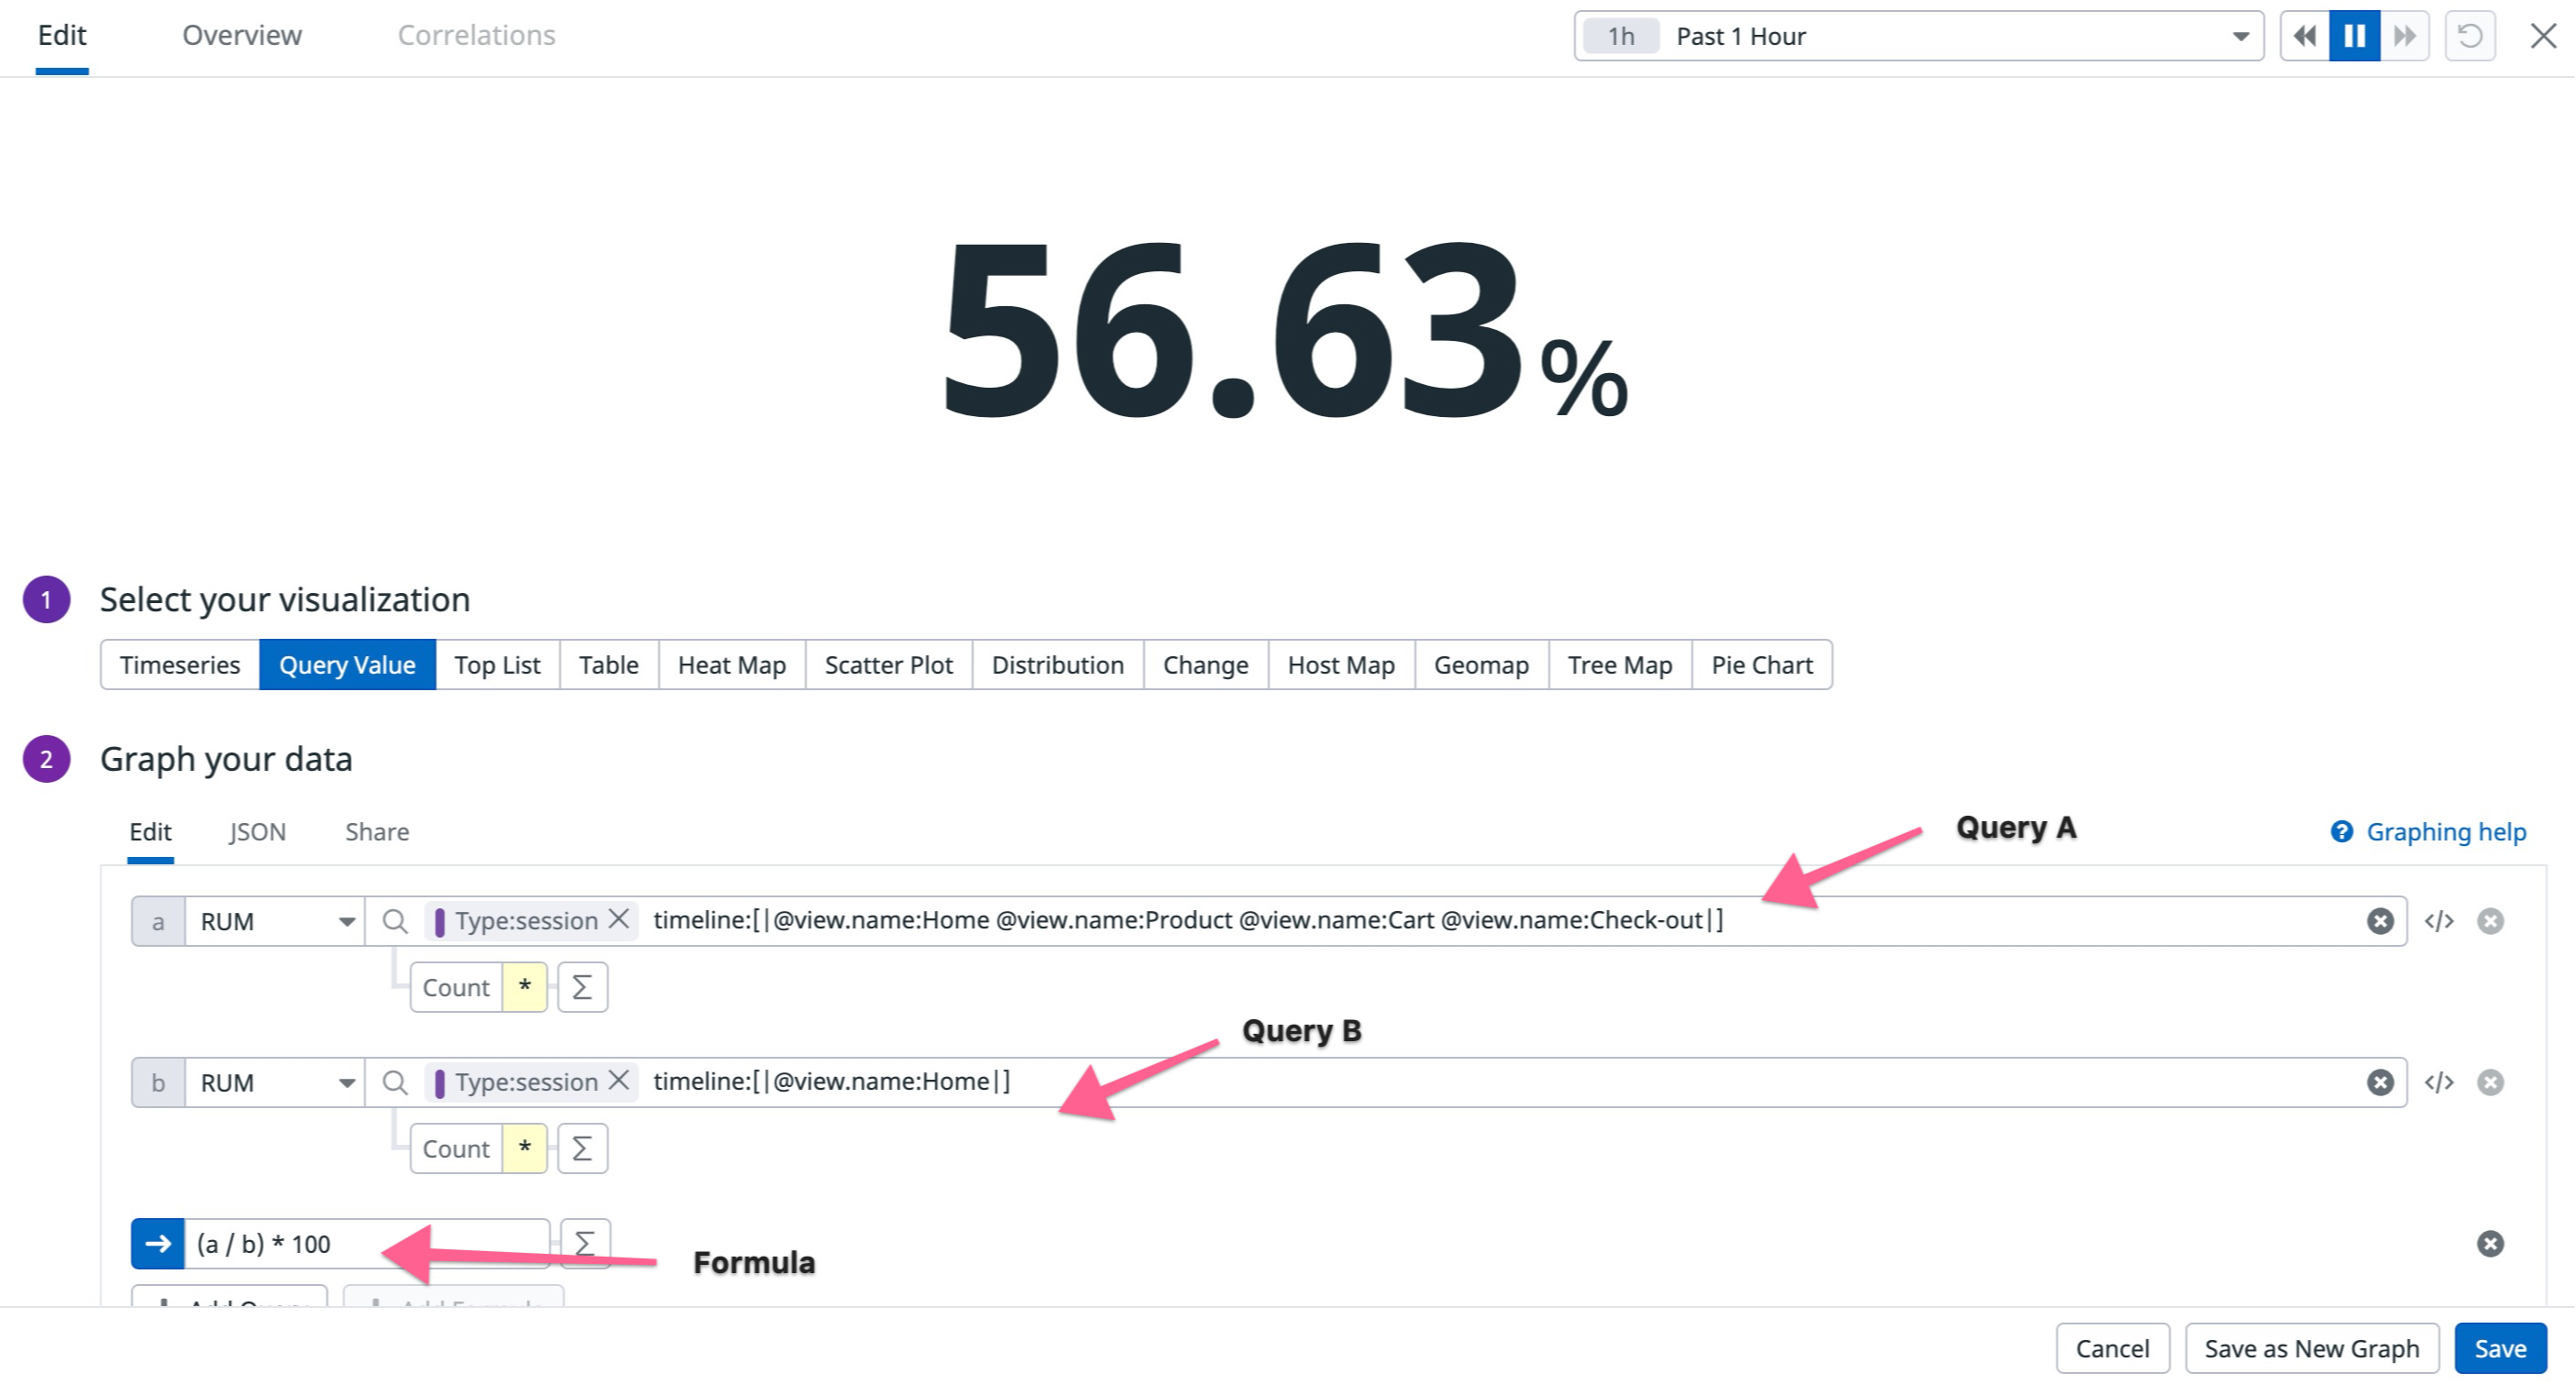
In a dashboard, you can edit the widget and access the query for the conversion rate under Graph your data.
Update the RUM monitor
In a separate tab, navigate to Monitors > New Monitor and select Real User Monitoring.
Copy and paste the queries from the dashboard into the RUM monitor’s query editor and add a formula using (a / b) * 100.
Advanced monitor configuration
With the applied query, you can customize alert conditions and set up notifications to ensure alerts notify the appropriate person or channel. For more information, see Real User Monitoring Monitor.
Further Reading
Documentation, liens et articles supplémentaires utiles:


