- Principales informations
- Getting Started
- Agent
- API
- Tracing
- Conteneurs
- Dashboards
- Database Monitoring
- Datadog
- Site Datadog
- DevSecOps
- Incident Management
- Intégrations
- Internal Developer Portal
- Logs
- Monitors
- OpenTelemetry
- Profileur
- Session Replay
- Security
- Serverless for AWS Lambda
- Software Delivery
- Surveillance Synthetic
- Tags
- Workflow Automation
- Learning Center
- Support
- Glossary
- Standard Attributes
- Guides
- Agent
- Intégrations
- Développeurs
- OpenTelemetry
- Administrator's Guide
- API
- Partners
- Application mobile
- DDSQL Reference
- CoScreen
- CoTerm
- Remote Configuration
- Cloudcraft
- In The App
- Dashboards
- Notebooks
- DDSQL Editor
- Reference Tables
- Sheets
- Alertes
- Watchdog
- Métriques
- Bits AI
- Internal Developer Portal
- Error Tracking
- Change Tracking
- Service Management
- Actions & Remediations
- Infrastructure
- Cloudcraft
- Resource Catalog
- Universal Service Monitoring
- Hosts
- Conteneurs
- Processes
- Sans serveur
- Surveillance réseau
- Cloud Cost
- Application Performance
- APM
- Termes et concepts de l'APM
- Sending Traces to Datadog
- APM Metrics Collection
- Trace Pipeline Configuration
- Connect Traces with Other Telemetry
- Trace Explorer
- Recommendations
- Code Origin for Spans
- Observabilité des services
- Endpoint Observability
- Dynamic Instrumentation
- Live Debugger
- Suivi des erreurs
- Sécurité des données
- Guides
- Dépannage
- Profileur en continu
- Database Monitoring
- Agent Integration Overhead
- Setup Architectures
- Configuration de Postgres
- Configuration de MySQL
- Configuration de SQL Server
- Setting Up Oracle
- Setting Up Amazon DocumentDB
- Setting Up MongoDB
- Connecting DBM and Traces
- Données collectées
- Exploring Database Hosts
- Explorer les métriques de requête
- Explorer des échantillons de requêtes
- Exploring Database Schemas
- Exploring Recommendations
- Dépannage
- Guides
- Data Streams Monitoring
- Data Jobs Monitoring
- Data Observability
- Digital Experience
- RUM et Session Replay
- Surveillance Synthetic
- Continuous Testing
- Product Analytics
- Software Delivery
- CI Visibility
- CD Visibility
- Deployment Gates
- Test Visibility
- Code Coverage
- Quality Gates
- DORA Metrics
- Feature Flags
- Securité
- Security Overview
- Cloud SIEM
- Code Security
- Cloud Security Management
- Application Security Management
- Workload Protection
- Sensitive Data Scanner
- AI Observability
- Log Management
- Pipelines d'observabilité
- Log Management
- CloudPrem
- Administration
List View
Cette page n'est pas encore disponible en français, sa traduction est en cours.
Si vous avez des questions ou des retours sur notre projet de traduction actuel, n'hésitez pas à nous contacter.
Si vous avez des questions ou des retours sur notre projet de traduction actuel, n'hésitez pas à nous contacter.
Overview
The List View of Network Path is the default view for exploring various paths. Group by sources such as hostname and service.
Use the search bar to search for specific endpoints, source, or destination locations.
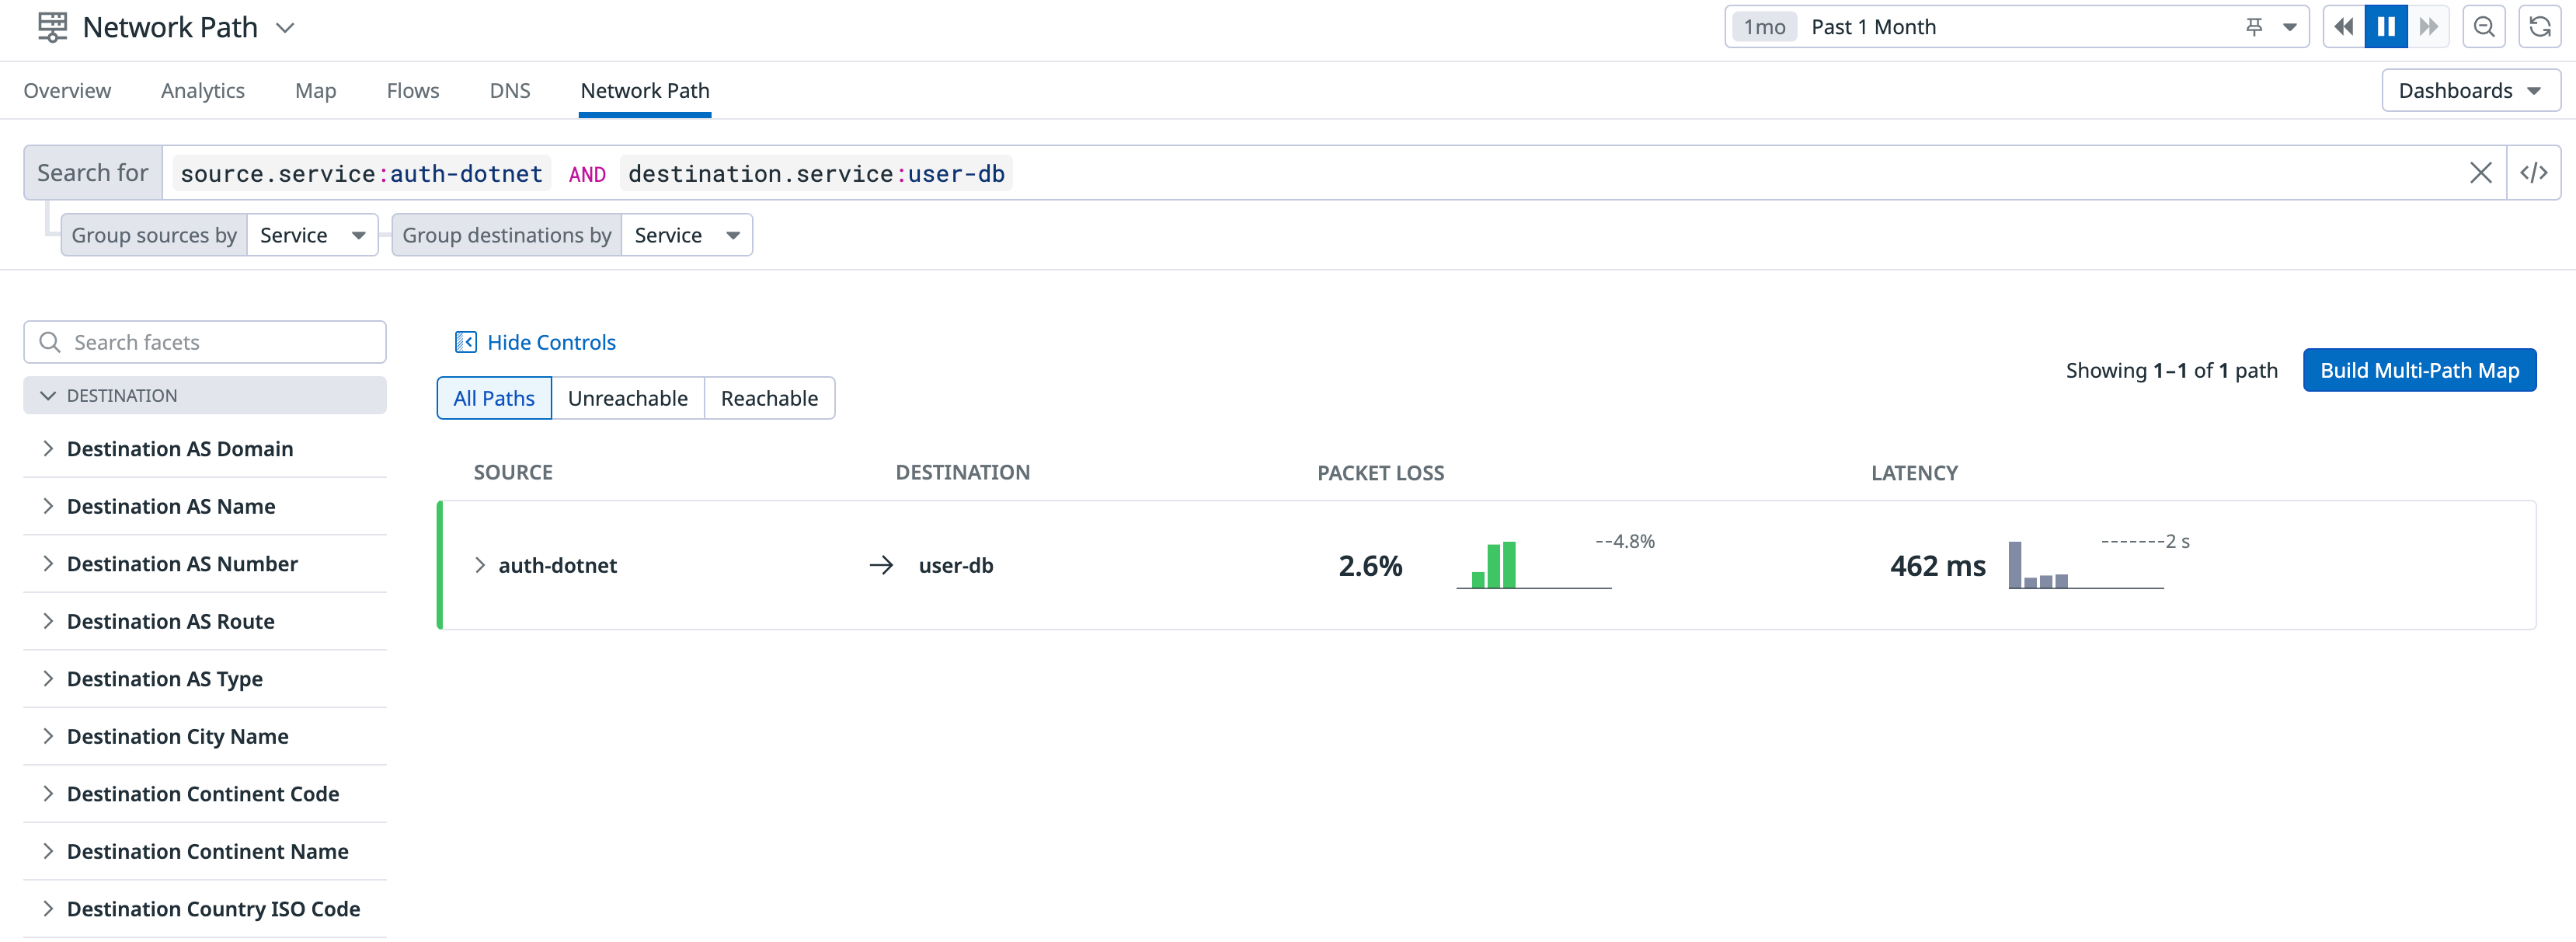
For example, search by a specific source.service and destination.service to narrow your results:
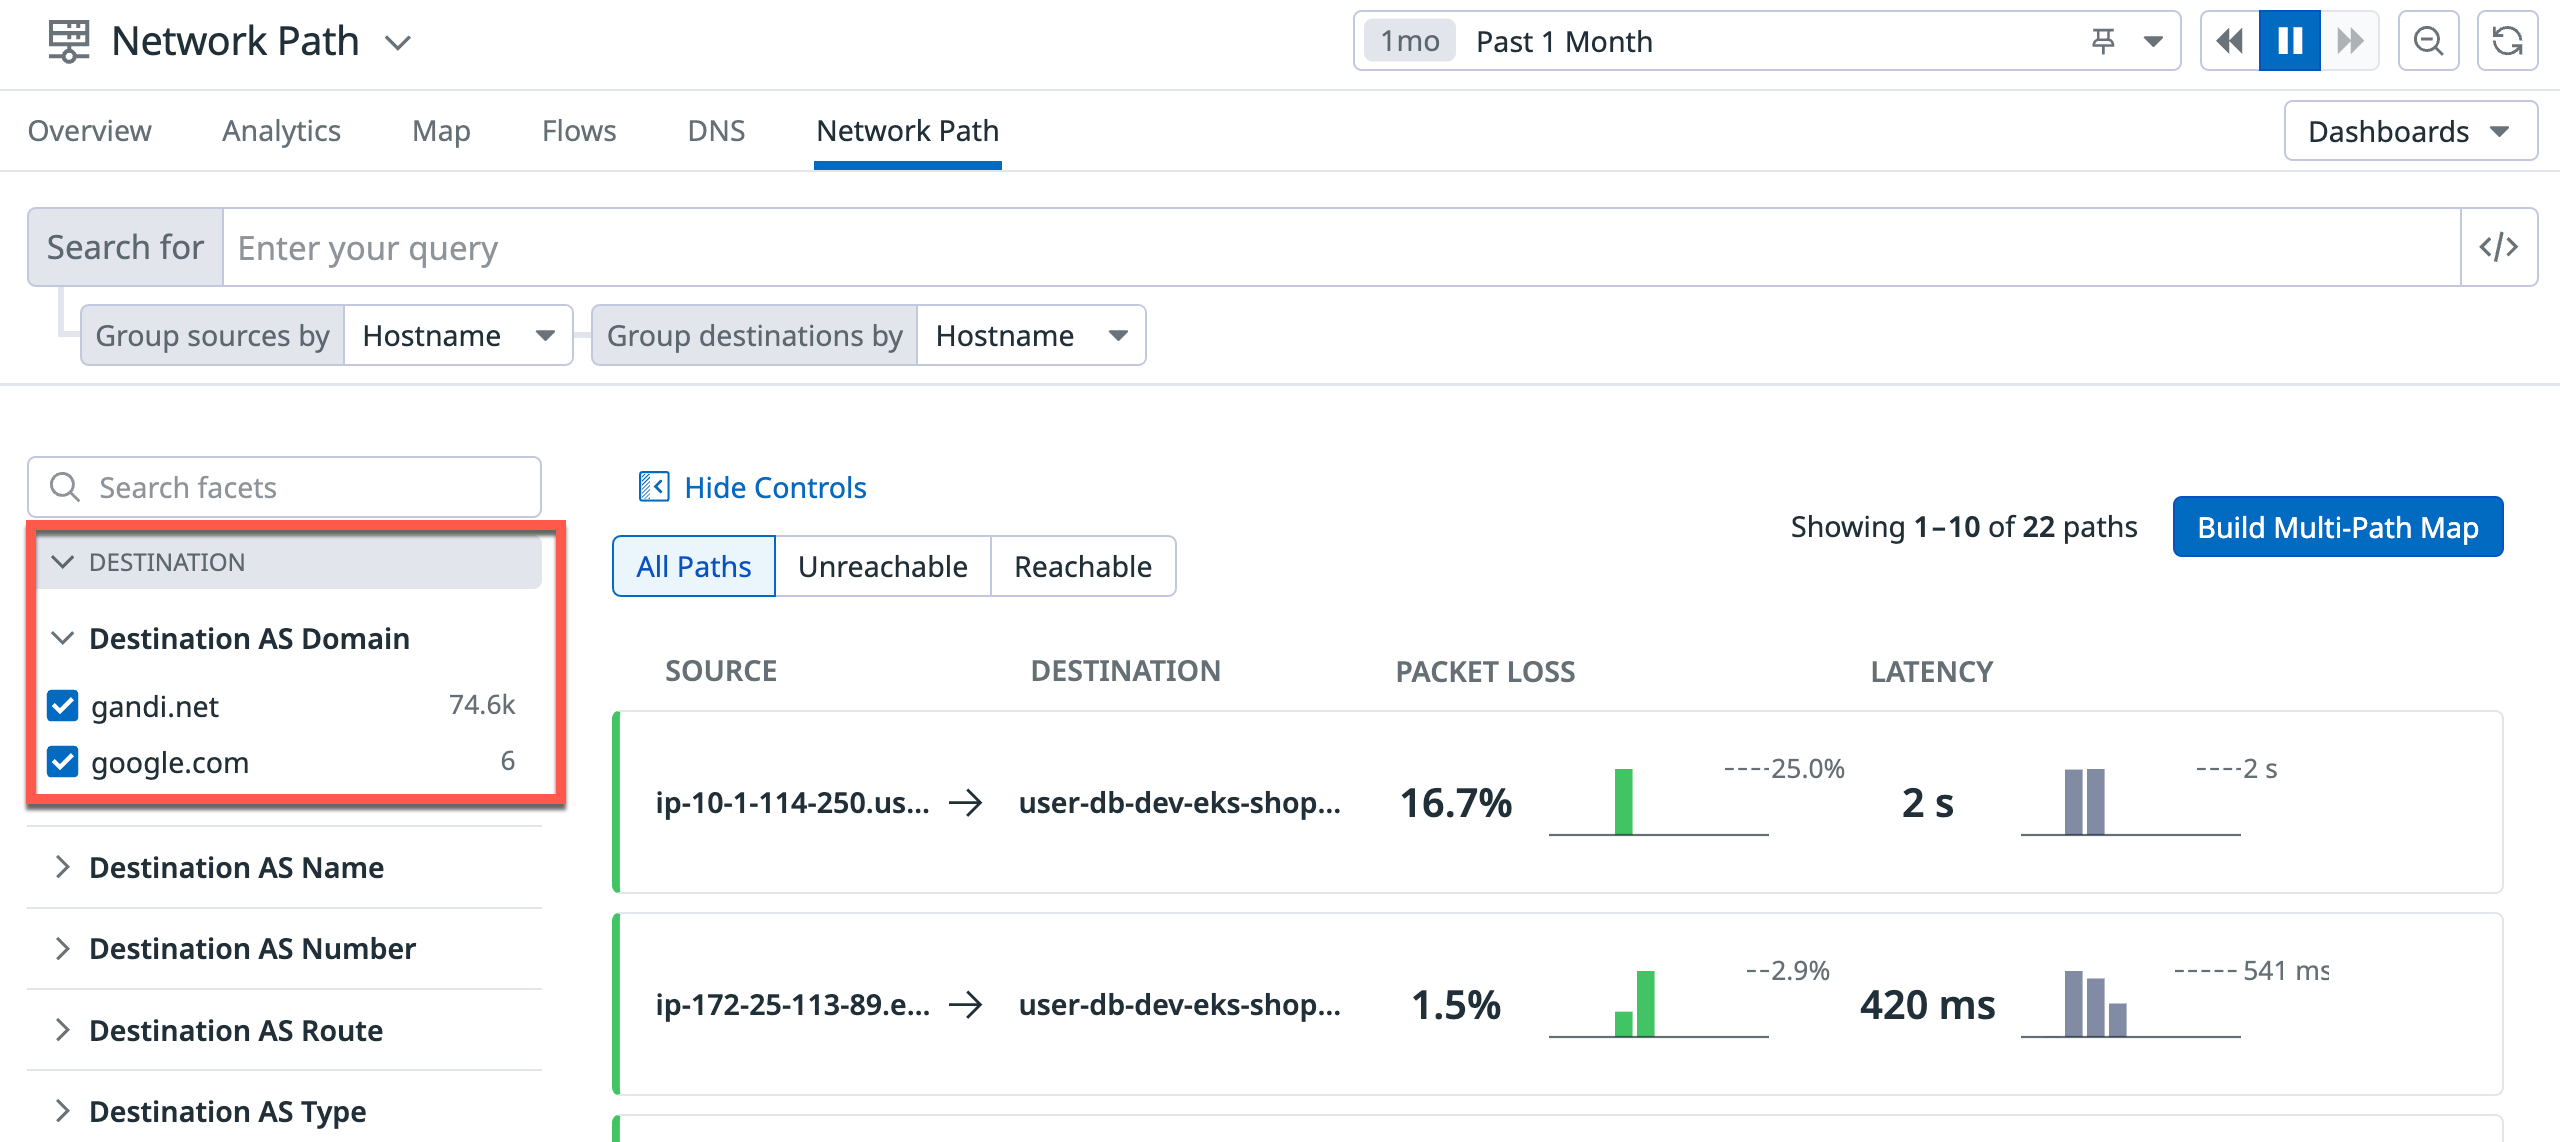
Additionally, search specific paths using the Destination and Source facet panels on the left hand side, such as Destination AS Name, Destination Service, or Source Hostname.
Filter controls
The top of the List View page also contains filter controls that can be used to give you a more granular search into the overall health of your network:
- Unreachable
- Filters to paths where the
traceroutehas not successfully reached the destination. This filter control can be useful to dive into a specific hop to determine where the failure is occurring. - Reachable
- Filters to paths where the
traceroutehas successfully reached the destination.
Multi-path map
Use the Multi-path map button to build a path map based on one or more selected paths:
From this view, you can view the latency and reachability for the selected paths, as well as investigate end-to-end packet loss and hop-to-hop latency. For more information on this view, see the Path View documentation.
Further Reading
Documentation, liens et articles supplémentaires utiles:


