- Essentials
- Getting Started
- Agent
- API
- APM Tracing
- Containers
- Dashboards
- Database Monitoring
- Datadog
- Datadog Site
- DevSecOps
- Incident Management
- Integrations
- Internal Developer Portal
- Logs
- Monitors
- Notebooks
- OpenTelemetry
- Profiler
- Search
- Session Replay
- Security
- Serverless for AWS Lambda
- Software Delivery
- Synthetic Monitoring and Testing
- Tags
- Workflow Automation
- Learning Center
- Support
- Glossary
- Standard Attributes
- Guides
- Agent
- Integrations
- Extend Datadog
- Authorization
- DogStatsD
- Custom Checks
- Integrations
- Build an Integration with Datadog
- Create an Agent-based Integration
- Create an API-based Integration
- Create a Log Pipeline
- Integration Assets Reference
- Build a Marketplace Offering
- Create an Integration Dashboard
- Create a Monitor Template
- Create a Cloud SIEM Detection Rule
- Install Agent Integration Developer Tool
- Service Checks
- Community
- Guides
- OpenTelemetry
- Administrator's Guide
- API
- Partners
- Datadog Mobile App
- DDSQL Reference
- CoScreen
- CoTerm
- Remote Configuration
- Cloudcraft (Standalone)
- In The App
- Dashboards
- Notebooks
- DDSQL Editor
- Reference Tables
- Sheets
- Monitors and Alerting
- Service Level Objectives
- Metrics
- Watchdog
- Bits AI
- Internal Developer Portal
- Error Tracking
- Change Tracking
- Event Management
- Incident Response
- Actions & Remediations
- Infrastructure
- Cloudcraft
- Resource Catalog
- Universal Service Monitoring
- End User Device Monitoring
- Hosts
- Containers
- Processes
- Serverless
- Network Monitoring
- Storage Management
- Cloud Cost
- Application Performance
- APM
- Continuous Profiler
- Database Monitoring
- Agent Integration Overhead
- Setup Architectures
- Setting Up Postgres
- Setting Up MySQL
- Setting Up SQL Server
- Setting Up Oracle
- Setting Up Amazon DocumentDB
- Setting Up MongoDB
- Setting Up ClickHouse
- Connecting DBM and Traces
- Data Collected
- Exploring Database Hosts
- Exploring Query Metrics
- Exploring Query Samples
- Exploring Database Schemas
- Exploring Recommendations
- Troubleshooting
- Guides
- Data Streams Monitoring
- Data Observability
- Digital Experience
- Real User Monitoring
- Synthetic Testing and Monitoring
- Continuous Testing
- Product Analytics
- Session Replay
- Software Delivery
- CI Visibility
- CD Visibility
- Deployment Gates
- Test Optimization
- Code Coverage
- PR Gates
- DORA Metrics
- Feature Flags
- Developer Integrations
- Security
- Security Overview
- Cloud SIEM
- Code Security
- Cloud Security
- App and API Protection
- AI Guard
- Workload Protection
- Sensitive Data Scanner
- AI Observability
- Log Management
- Observability Pipelines
- Configuration
- Sources
- Processors
- Destinations
- Packs
- Akamai CDN
- Amazon CloudFront
- Amazon VPC Flow Logs
- AWS Application Load Balancer Logs
- AWS CloudTrail
- AWS Elastic Load Balancer Logs
- AWS Network Load Balancer Logs
- Cisco ASA
- Cloudflare
- F5
- Fastly
- Fortinet Firewall
- HAProxy Ingress
- Istio Proxy
- Juniper SRX Firewall Traffic Logs
- Netskope
- NGINX
- Okta
- Palo Alto Firewall
- Windows XML
- ZScaler ZIA DNS
- Zscaler ZIA Firewall
- Zscaler ZIA Tunnel
- Zscaler ZIA Web Logs
- Search Syntax
- Scaling and Performance
- Monitoring and Troubleshooting
- Guides and Resources
- Log Management
- CloudPrem
- Administration
Service Check
Overview
Service checks allow you to characterize the status of a service to monitor it within Datadog. Service checks monitor the up or down status of the specific service. You are alerted whenever the monitoring Agent fails to connect to that service in a specified number of consecutive checks. For example, you can get an alert any time the monitoring Agent on a Redis host reports three consecutive failed attempts to connect to Redis and collect metrics.
Service checks at the cluster level offer another effective way to monitor distributed or redundant systems that can withstand some failures. Use these alerts for architectures where individual hosts run multiple services, because they can surface the degradation of the service even if the hosts running that service remain available (and would pass a host-level health check).
You can set up monitoring and an alert for when a critical, non-redundant service is lost, or if a cluster is on the verge of failure due to widespread node loss. Other critical alerts could be a drop in request throughput or an increase in request latency.
You might need to set up a service check if an integration does not have one natively or for an internal service that you want to monitor for up or down status.
To use service checks, first set up the check:
Additional helpful documentation, links, and articles:
Once the service check is sending data, check out your check summary and set up dashboards, monitors, and alerts:
Visualize your service check in Datadog
Service checks can be visualized and used in 3 Datadog sections:
Check summary
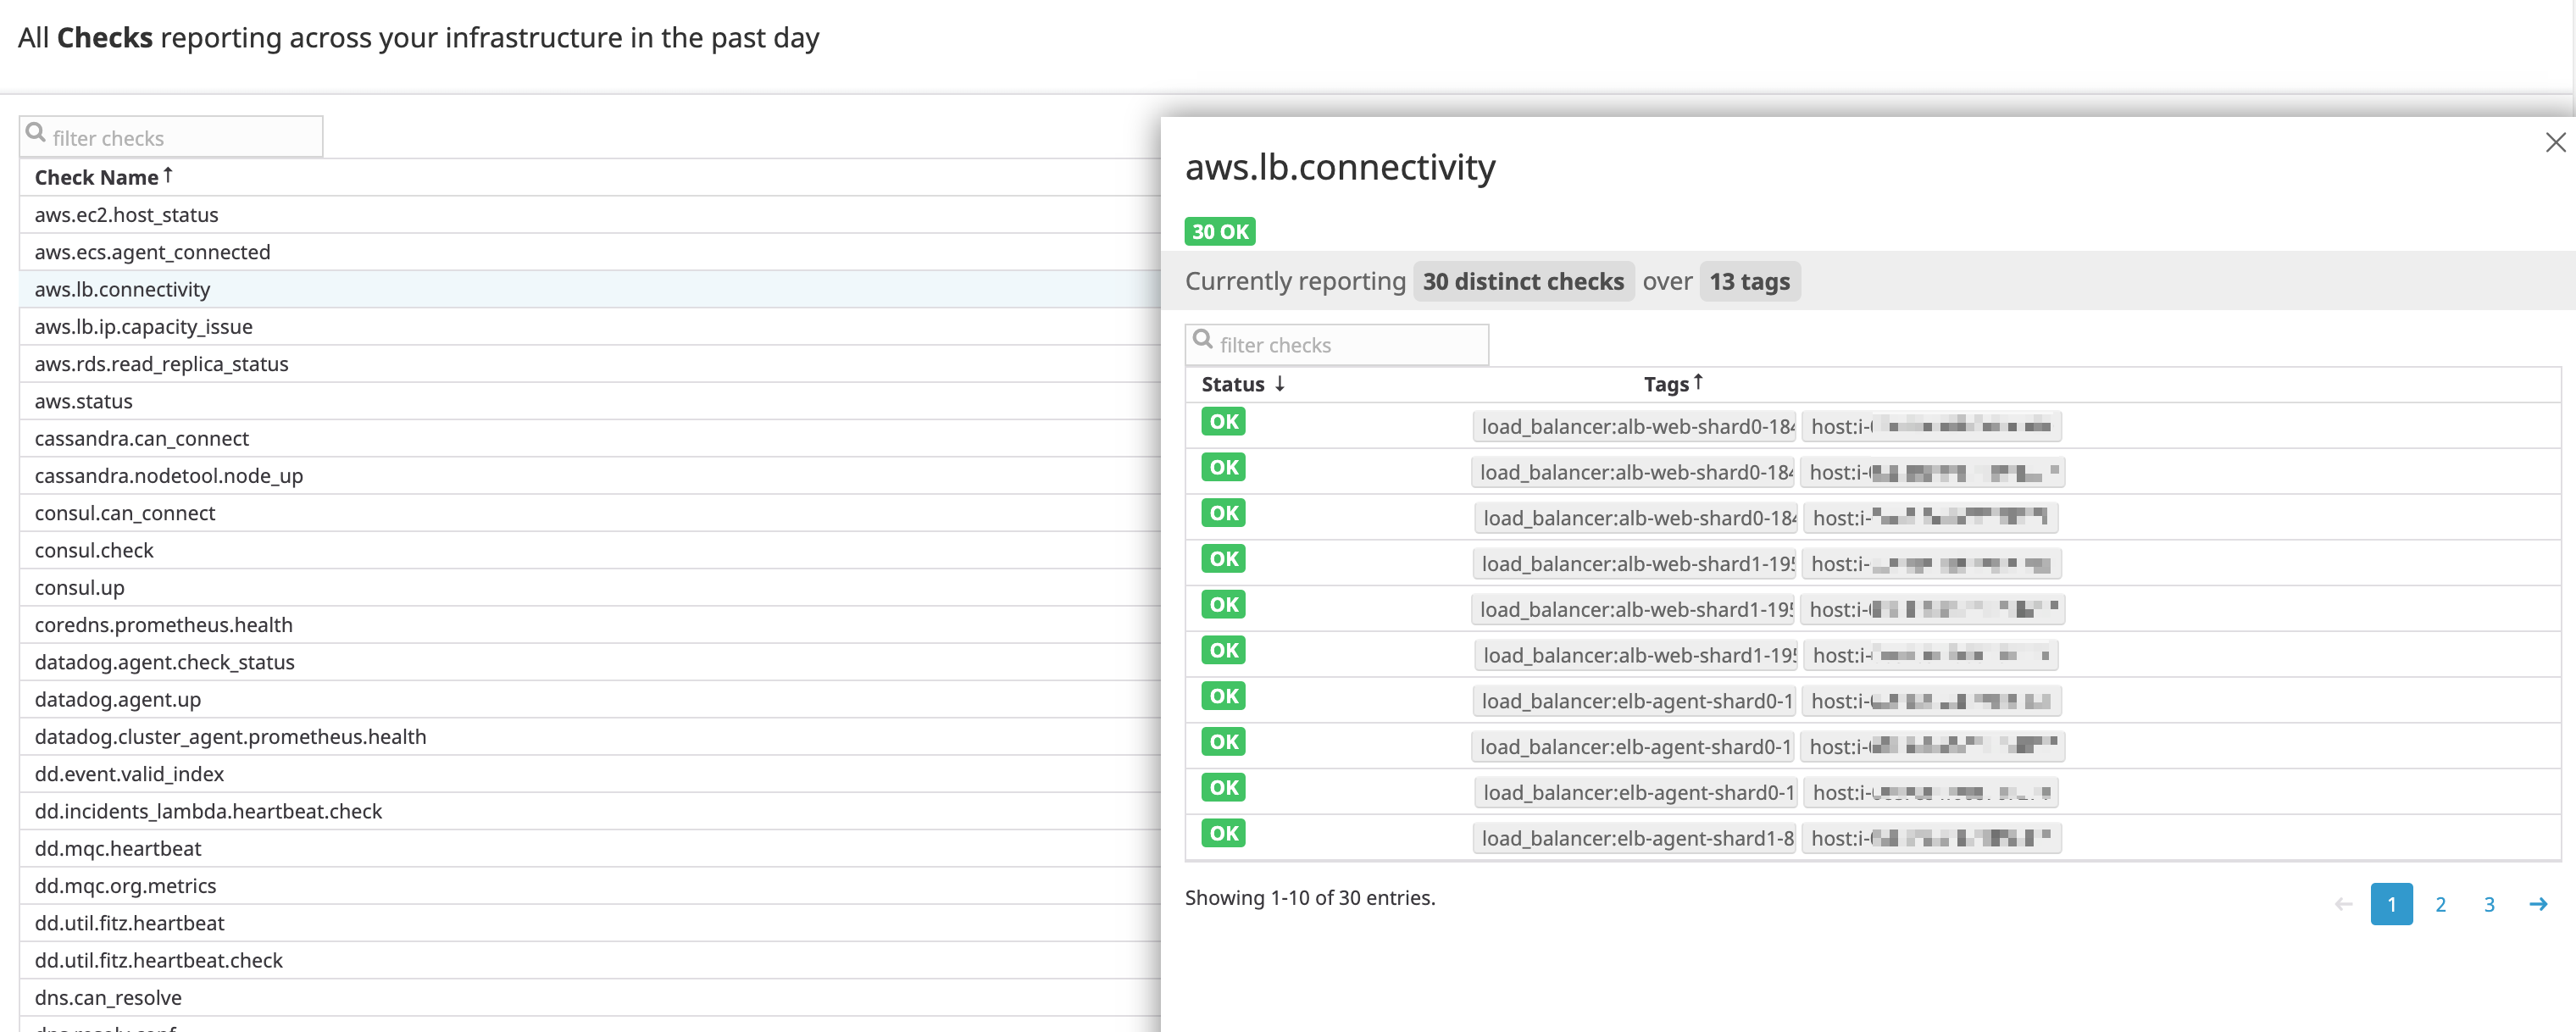
The Check Summary page lists all checks reported across your infrastructure in the past day. Select a check to get insights on the status and tags associated with the check.
Screenboards
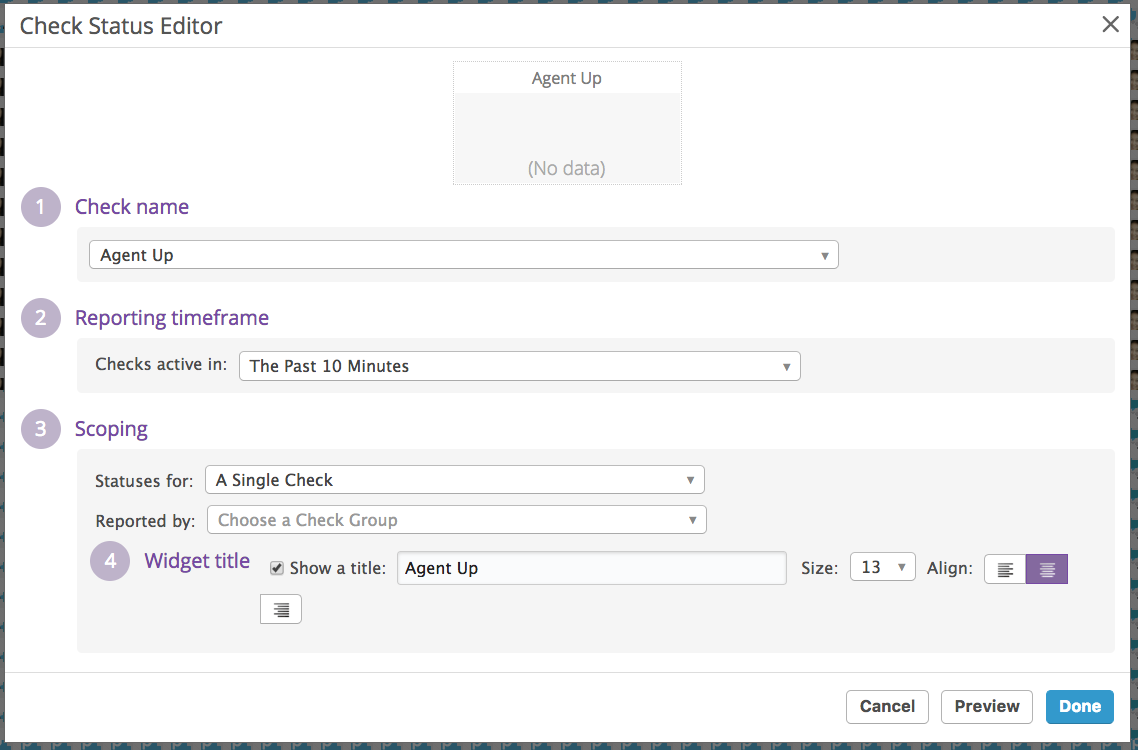
You can visualize service checks with a Check status widget in a screenboard:
After clicking on the Check status widget icon, the following pop-up appears:
In this form, you can:
- Check Name: Select your service check name.
- Reporting Timeframe: Select the time frame on which you want to aggregate your status.
- Scoping: Select a single check or a cluster of check statuses reported by a single tag value or a tag key.
- Widget Title: Set your widget title.
Service check monitor
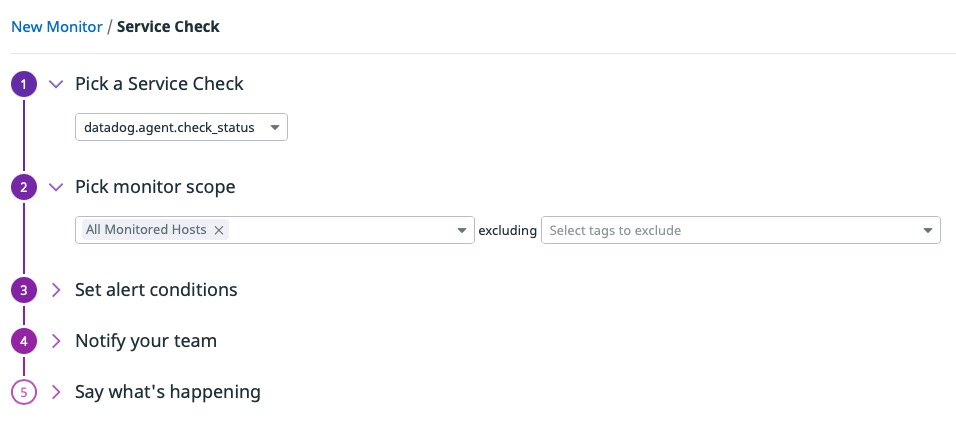
Even if you can’t graph a service check over time as you would for metrics, you can still monitor it with a Service Check Monitor.
In this form, you can:
- Pick a service check: Select the check status name to monitor.
- Pick monitor scope: Select the context for your monitor (including/excluding tags).
- Set alert conditions: Choose between a simple check alert or a cluster alert.
- Configure notifications and automations: Choose who this monitor should notify and edit the notifications sent (find more about Datadog notifications).
- Define permissions and audit notifications: Edit access permissions for your monitor and set audit notifications.
For more information on creating a service check, see Service Check Monitor.


