- Essentials
- Getting Started
- Agent
- API
- APM Tracing
- Containers
- Dashboards
- Database Monitoring
- Datadog
- Datadog Site
- DevSecOps
- Incident Management
- Integrations
- Internal Developer Portal
- Logs
- Monitors
- Notebooks
- OpenTelemetry
- Profiler
- Search
- Session Replay
- Security
- Serverless for AWS Lambda
- Software Delivery
- Synthetic Monitoring and Testing
- Tags
- Workflow Automation
- Learning Center
- Support
- Glossary
- Standard Attributes
- Guides
- Agent
- Integrations
- Developers
- Authorization
- DogStatsD
- Custom Checks
- Integrations
- Build an Integration with Datadog
- Create an Agent-based Integration
- Create an API-based Integration
- Create a Log Pipeline
- Integration Assets Reference
- Build a Marketplace Offering
- Create an Integration Dashboard
- Create a Monitor Template
- Create a Cloud SIEM Detection Rule
- Install Agent Integration Developer Tool
- Service Checks
- IDE Plugins
- Community
- Guides
- OpenTelemetry
- Administrator's Guide
- API
- Partners
- Datadog Mobile App
- DDSQL Reference
- CoScreen
- CoTerm
- Remote Configuration
- Cloudcraft (Standalone)
- In The App
- Dashboards
- Notebooks
- DDSQL Editor
- Reference Tables
- Sheets
- Monitors and Alerting
- Service Level Objectives
- Metrics
- Watchdog
- Bits AI
- Internal Developer Portal
- Error Tracking
- Change Tracking
- Event Management
- Incident Response
- Actions & Remediations
- Infrastructure
- Cloudcraft
- Resource Catalog
- Universal Service Monitoring
- End User Device Monitoring
- Hosts
- Containers
- Processes
- Serverless
- Network Monitoring
- Storage Management
- Cloud Cost
- Application Performance
- APM
- Continuous Profiler
- Database Monitoring
- Agent Integration Overhead
- Setup Architectures
- Setting Up Postgres
- Setting Up MySQL
- Setting Up SQL Server
- Setting Up Oracle
- Setting Up Amazon DocumentDB
- Setting Up MongoDB
- Connecting DBM and Traces
- Data Collected
- Exploring Database Hosts
- Exploring Query Metrics
- Exploring Query Samples
- Exploring Database Schemas
- Exploring Recommendations
- Troubleshooting
- Guides
- Data Streams Monitoring
- Data Observability
- Digital Experience
- Real User Monitoring
- Synthetic Testing and Monitoring
- Continuous Testing
- Product Analytics
- Session Replay
- Software Delivery
- CI Visibility
- CD Visibility
- Deployment Gates
- Test Optimization
- Code Coverage
- PR Gates
- DORA Metrics
- Feature Flags
- Security
- Security Overview
- Cloud SIEM
- Code Security
- Cloud Security
- App and API Protection
- AI Guard
- Workload Protection
- Sensitive Data Scanner
- AI Observability
- Log Management
- Observability Pipelines
- Configuration
- Sources
- Processors
- Destinations
- Packs
- Akamai CDN
- Amazon CloudFront
- Amazon VPC Flow Logs
- AWS Application Load Balancer Logs
- AWS CloudTrail
- AWS Elastic Load Balancer Logs
- AWS Network Load Balancer Logs
- Cisco ASA
- Cloudflare
- F5
- Fastly
- Fortinet Firewall
- HAProxy Ingress
- Istio Proxy
- Juniper SRX Firewall Traffic Logs
- Netskope
- NGINX
- Okta
- Palo Alto Firewall
- Windows XML
- ZScaler ZIA DNS
- Zscaler ZIA Firewall
- Zscaler ZIA Tunnel
- Zscaler ZIA Web Logs
- Search Syntax
- Scaling and Performance
- Monitoring and Troubleshooting
- Guides and Resources
- Log Management
- CloudPrem
- Administration
Timeshift
Here is a set of functions performing a time shift of your data. These functions display the values from the corresponding time period on the graph. On their own, they may not be of high value, but together with the current values they may provide useful insight into the performance of your application.
Timeshift
| Function | Description | Example |
|---|---|---|
timeshift() | Graph values from an arbitrary <TIME_IN_SECOND> before the current timestamp for the metric. | timeshift(<METRIC_NAME>{*}, -<TIME_IN_SECOND>) |
For example, if you wanted to use this to compare current system load with load from 2 weeks ago (60*60*24*14 = 1209600), your query would be:
timeshift(avg:system.load.1{*}, -1209600)
Calendar shift
| Function | Description | Example |
|---|---|---|
calendar_shift() | Graph values from the previous day, week, or month from the current timestamp for the metric. | calendar_shift(<METRIC_NAME>{*}, "<TIME_SHIFT_STRING>", "<TIME_ZONE_CODE>") |
To access the calendar_shift() function click the Add function button, select Timeshift > Month before. The calendar shift allows you to compare the same metric across equivalent time frames. Below is an example of cloud cost metric aws.cost.net.amortized with the calendar_shift() value from two weeks ago compared to the current value.
Valid TIME_SHIFT_STRING values are negative integers followed by “d” for days, “w” for weeks, or “mo” for months.
Some examples are -1d, -7d, -1mo, -30d, and -4w.
Valid TIME_ZONE_CODE values are the IANA time zone codes for a specific city, or UTC.
For example, UTC, America/New_York, Europe/Paris, or Asia/Tokyo.
Hour before
| Function | Description | Example |
|---|---|---|
hour_before() | Graph values from an hour before the current timestamp for the metric. | hour_before(<METRIC_NAME>{*}) |
Here is an example of system.load.1 with the hour_before() value shown as a dotted line. In this particular example, you can see the machine was started at 6:30am and the hour_before() values show up at the 7:30 mark. Of course, this example was created specifically so that you can see the hour_before() values match up with the actual values.
Day before
The day before feature is being deprecated. Use calendar shift with a value of "-1d" instead.
| Function | Description | Example |
|---|---|---|
day_before() | Graph values from a day before the current timestamp for the metric. | day_before(<METRIC_NAME>{*}) |
Here is an example of nginx.net.connections with the day_before() value shown as a lighter, thinner line. In this example, you can see a week’s worth of data, which makes the day_before() data easier to identify.
Week before
The week before feature is being deprecated. Use calendar shift with a value of "-7d" instead.
| Function | Description | Example |
|---|---|---|
week_before() | Graph values from a week (7 days) before the current timestamp for the metric. | week_before(<METRIC_NAME>{*}) |
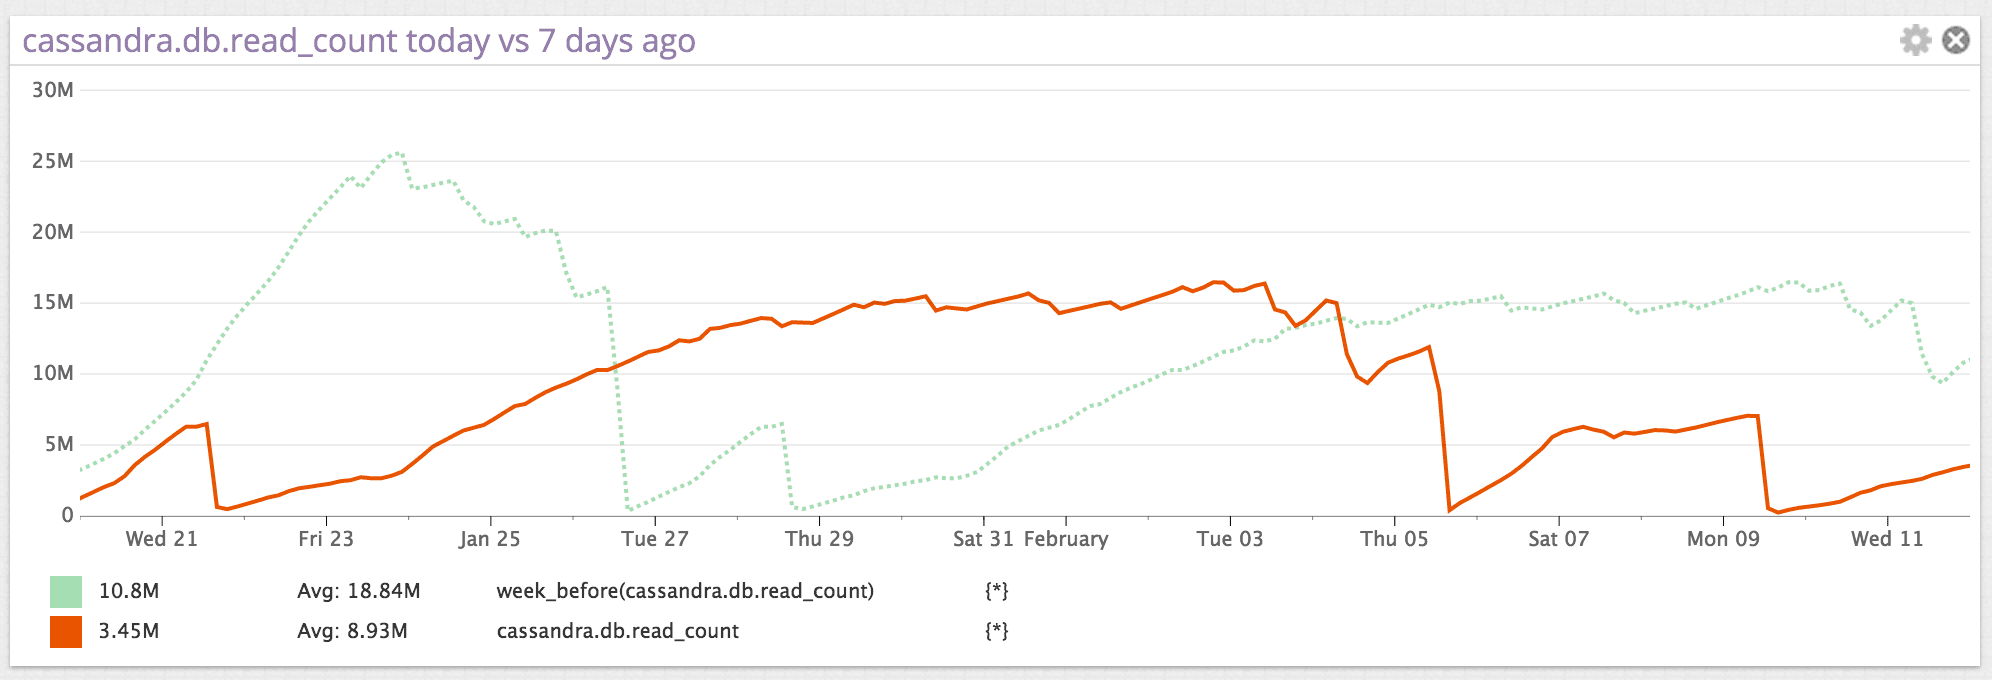
Here is an example of cassandra.db.read_count with the week_before() value shown as a dotted line. In this example, you can see about three weeks’ worth of data, which makes the week_before() data easier to identify.
Month before
The month before feature is being deprecated. Use calendar shift with a value of "-1mo", "-30d" or "-4w" instead, depending on your use case.
| Function | Description | Example |
|---|---|---|
month_before() | Graph values from a month (28 days / 4 weeks) before the current timestamp for the metric. | month_before(<METRIC_NAME>{*}) |
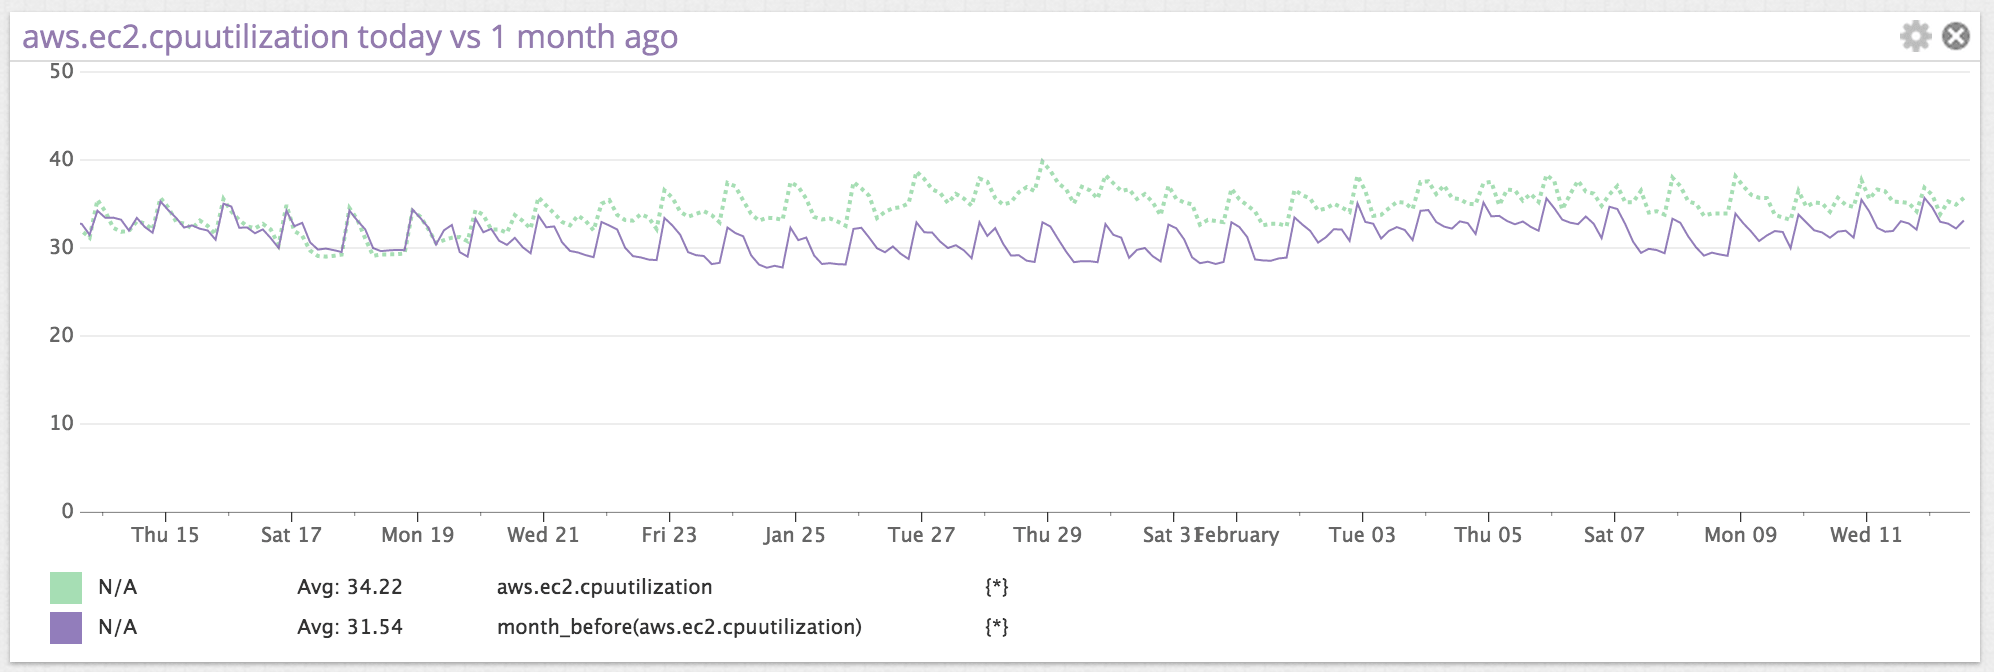
Here is an example of aws.ec2.cpuutilization with the month_before() value shown as a thin, solid line.
Other functions
Consult the other available functions:
- Algorithmic: Implement Anomaly or Outlier detection on your metric.
Further Reading
Additional helpful documentation, links, and articles:


