- Essentials
- Getting Started
- Agent
- API
- APM Tracing
- Containers
- Dashboards
- Database Monitoring
- Datadog
- Datadog Site
- DevSecOps
- Incident Management
- Integrations
- Internal Developer Portal
- Logs
- Monitors
- Notebooks
- OpenTelemetry
- Profiler
- Search
- Session Replay
- Security
- Serverless for AWS Lambda
- Software Delivery
- Synthetic Monitoring and Testing
- Tags
- Workflow Automation
- Learning Center
- Support
- Glossary
- Standard Attributes
- Guides
- Agent
- Integrations
- Developers
- Authorization
- DogStatsD
- Custom Checks
- Integrations
- Build an Integration with Datadog
- Create an Agent-based Integration
- Create an API-based Integration
- Create a Log Pipeline
- Integration Assets Reference
- Build a Marketplace Offering
- Create an Integration Dashboard
- Create a Monitor Template
- Create a Cloud SIEM Detection Rule
- Install Agent Integration Developer Tool
- Service Checks
- IDE Plugins
- Community
- Guides
- OpenTelemetry
- Administrator's Guide
- API
- Partners
- Datadog Mobile App
- DDSQL Reference
- CoScreen
- CoTerm
- Remote Configuration
- Cloudcraft (Standalone)
- In The App
- Dashboards
- Notebooks
- DDSQL Editor
- Reference Tables
- Sheets
- Monitors and Alerting
- Service Level Objectives
- Metrics
- Watchdog
- Bits AI
- Internal Developer Portal
- Error Tracking
- Change Tracking
- Event Management
- Incident Response
- Actions & Remediations
- Infrastructure
- Cloudcraft
- Resource Catalog
- Universal Service Monitoring
- End User Device Monitoring
- Hosts
- Containers
- Processes
- Serverless
- Network Monitoring
- Storage Management
- Cloud Cost
- Application Performance
- APM
- Continuous Profiler
- Database Monitoring
- Agent Integration Overhead
- Setup Architectures
- Setting Up Postgres
- Setting Up MySQL
- Setting Up SQL Server
- Setting Up Oracle
- Setting Up Amazon DocumentDB
- Setting Up MongoDB
- Connecting DBM and Traces
- Data Collected
- Exploring Database Hosts
- Exploring Query Metrics
- Exploring Query Samples
- Exploring Database Schemas
- Exploring Recommendations
- Troubleshooting
- Guides
- Data Streams Monitoring
- Data Observability
- Digital Experience
- Real User Monitoring
- Synthetic Testing and Monitoring
- Continuous Testing
- Product Analytics
- Session Replay
- Software Delivery
- CI Visibility
- CD Visibility
- Deployment Gates
- Test Optimization
- Code Coverage
- PR Gates
- DORA Metrics
- Feature Flags
- Security
- Security Overview
- Cloud SIEM
- Code Security
- Cloud Security
- App and API Protection
- AI Guard
- Workload Protection
- Sensitive Data Scanner
- AI Observability
- Log Management
- Observability Pipelines
- Configuration
- Sources
- Processors
- Destinations
- Packs
- Akamai CDN
- Amazon CloudFront
- Amazon VPC Flow Logs
- AWS Application Load Balancer Logs
- AWS CloudTrail
- AWS Elastic Load Balancer Logs
- AWS Network Load Balancer Logs
- Cisco ASA
- Cloudflare
- F5
- Fastly
- Fortinet Firewall
- HAProxy Ingress
- Istio Proxy
- Juniper SRX Firewall Traffic Logs
- Netskope
- NGINX
- Okta
- Palo Alto Firewall
- Windows XML
- ZScaler ZIA DNS
- Zscaler ZIA Firewall
- Zscaler ZIA Tunnel
- Zscaler ZIA Web Logs
- Search Syntax
- Scaling and Performance
- Monitoring and Troubleshooting
- Guides and Resources
- Log Management
- CloudPrem
- Administration
Arithmetic
Absolute
| Function | Description | Example |
|---|---|---|
abs() | Graph the absolute value of the metric. | abs(<METRIC_NAME>{*}) |
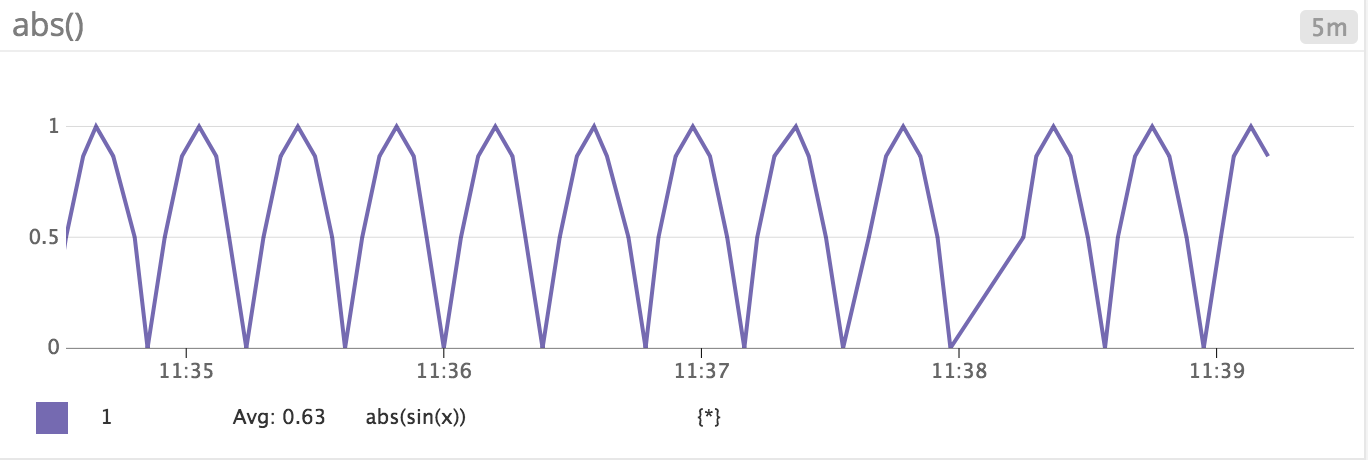
Transforms this sine timeseries sin{*}:
into this one abs(sin{*}):
Exponent
| Function | Description | Example |
|---|---|---|
pow() | Graph all combinations of metric and constant using exponentiation. | pow(<METRIC_NAME>{*}, CONSTANT), pow(<METRIC_NAME>{*}, <METRIC_NAME>{*}), pow(CONSTANT, <METRIC_NAME>{*}), pow(CONSTANT, CONSTANT) |
Logarithm
Log base 2
| Function | Description | Example |
|---|---|---|
log2() | Graph the Base-2 logarithm of the metric. | log2(<METRIC_NAME>{*}) |
Example:
If a metric, x{*}, increments itself by 1 for each data point, then log2(x{*}) has the following shape:
Log base 10
| Function | Description | Example |
|---|---|---|
log10() | Graph the Base-10 logarithm of the metric. | log10(<METRIC_NAME>{*}) |
Example:
If a metric, x{*}, increments itself by 1 for each data point, then log10(x{*}) has the following shape:
Cumulative sum
| Function | Description | Example |
|---|---|---|
cumsum() | Graph the cumulative sum of the metric over the visible time window. | cumsum(<METRIC_NAME>{*}) |
Example:
If a metric, const_1{*}, is a constant with the value of 1, then cumsum(const_1{*}) has the following shape:
Cumulative sum in monitors
Cumulative sum should be avoided in monitor queries, because the cumulative sum function is a visual function. When used in a dashboard or notebook, the points will reflect values based on the selected timeframe. This doesn’t translate well in a monitor as the monitor doesn’t have a sense of which timeframe to use.
Instead, configure Cumulative Time Windows in your monitor evaluation period.
Integral
| Function | Description | Example |
|---|---|---|
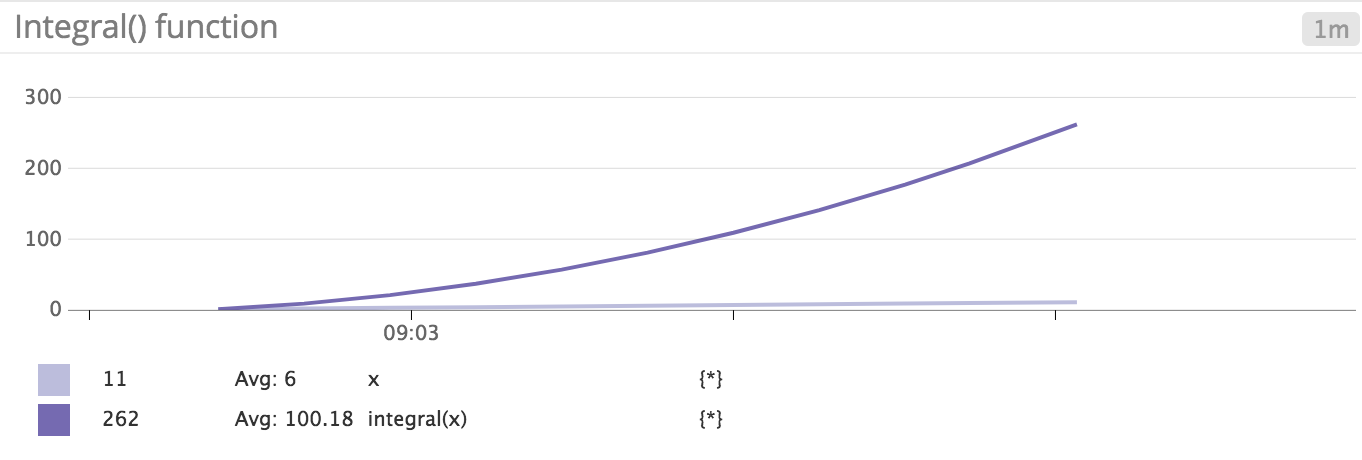
integral() | Graph the integral of the metric. | integral(<METRIC_NAME>{*}) |
Note: Datadog’s integral() is the cumulative sum of [time delta] x [value delta] over all consecutive pairs of points in the visible time window for a given metric.
Other functions
Consult the other available functions:
- Algorithmic: Implement Anomaly or Outlier detection on your metric.


