- Essentials
- Getting Started
- Agent
- API
- APM Tracing
- Containers
- Dashboards
- Database Monitoring
- Datadog
- Datadog Site
- DevSecOps
- Incident Management
- Integrations
- Internal Developer Portal
- Logs
- Monitors
- Notebooks
- OpenTelemetry
- Profiler
- Search
- Session Replay
- Security
- Serverless for AWS Lambda
- Software Delivery
- Synthetic Monitoring and Testing
- Tags
- Workflow Automation
- Learning Center
- Support
- Glossary
- Standard Attributes
- Guides
- Agent
- Integrations
- Developers
- Authorization
- DogStatsD
- Custom Checks
- Integrations
- Build an Integration with Datadog
- Create an Agent-based Integration
- Create an API-based Integration
- Create a Log Pipeline
- Integration Assets Reference
- Build a Marketplace Offering
- Create an Integration Dashboard
- Create a Monitor Template
- Create a Cloud SIEM Detection Rule
- Install Agent Integration Developer Tool
- Service Checks
- IDE Plugins
- Community
- Guides
- OpenTelemetry
- Administrator's Guide
- API
- Partners
- Datadog Mobile App
- DDSQL Reference
- CoScreen
- CoTerm
- Remote Configuration
- Cloudcraft (Standalone)
- In The App
- Dashboards
- Notebooks
- DDSQL Editor
- Reference Tables
- Sheets
- Monitors and Alerting
- Service Level Objectives
- Metrics
- Watchdog
- Bits AI
- Internal Developer Portal
- Error Tracking
- Change Tracking
- Event Management
- Incident Response
- Actions & Remediations
- Infrastructure
- Cloudcraft
- Resource Catalog
- Universal Service Monitoring
- End User Device Monitoring
- Hosts
- Containers
- Processes
- Serverless
- Network Monitoring
- Storage Management
- Cloud Cost
- Application Performance
- APM
- Continuous Profiler
- Database Monitoring
- Agent Integration Overhead
- Setup Architectures
- Setting Up Postgres
- Setting Up MySQL
- Setting Up SQL Server
- Setting Up Oracle
- Setting Up Amazon DocumentDB
- Setting Up MongoDB
- Connecting DBM and Traces
- Data Collected
- Exploring Database Hosts
- Exploring Query Metrics
- Exploring Query Samples
- Exploring Database Schemas
- Exploring Recommendations
- Troubleshooting
- Guides
- Data Streams Monitoring
- Data Observability
- Digital Experience
- Real User Monitoring
- Synthetic Testing and Monitoring
- Continuous Testing
- Product Analytics
- Session Replay
- Software Delivery
- CI Visibility
- CD Visibility
- Deployment Gates
- Test Optimization
- Code Coverage
- PR Gates
- DORA Metrics
- Feature Flags
- Security
- Security Overview
- Cloud SIEM
- Code Security
- Cloud Security
- App and API Protection
- AI Guard
- Workload Protection
- Sensitive Data Scanner
- AI Observability
- Log Management
- Observability Pipelines
- Configuration
- Sources
- Processors
- Destinations
- Packs
- Akamai CDN
- Amazon CloudFront
- Amazon VPC Flow Logs
- AWS Application Load Balancer Logs
- AWS CloudTrail
- AWS Elastic Load Balancer Logs
- AWS Network Load Balancer Logs
- Cisco ASA
- Cloudflare
- F5
- Fastly
- Fortinet Firewall
- HAProxy Ingress
- Istio Proxy
- Juniper SRX Firewall Traffic Logs
- Netskope
- NGINX
- Okta
- Palo Alto Firewall
- Windows XML
- ZScaler ZIA DNS
- Zscaler ZIA Firewall
- Zscaler ZIA Tunnel
- Zscaler ZIA Web Logs
- Search Syntax
- Scaling and Performance
- Monitoring and Troubleshooting
- Guides and Resources
- Log Management
- CloudPrem
- Administration
Watchdog Insights
Overview
Investigating an incident requires trial and error. Drawing from their experience, engineers familiar with a particular area know where to first look for potential problems. Using Watchdog Insights allows all engineers, including less experienced ones, to pay attention to the most important data and accelerate their incident investigations.
Throughout most of Datadog, Watchdog returns two types of insights:
- Anomalies: All the pre-calculated Watchdog alerts matching the active search query that Watchdog found by scanning your organization’s data. Access the full list in the Watchdog Alert explorer.
- Outliers: Tags that appear too frequently in some event types (for example, errors) or drive some continuous metrics upwards (for example, latency). Outliers are dynamically calculated on the data matching the active query and the time frame.
Explore insights
The Watchdog Insights carousel sits near the top of the following product pages:
- Log explorer
- APM:
- Infrastructure:
Expand the carousel for an overview. The highest priority insights (based on Insight type, State, Status, Start time, Anomaly type) appear on the left.
Click View all to expand the panel. A side panel opens from the right, containing a vertical list of Watchdog Insights. Each entry shows a detailed view, with more information than the summary card.
Every outlier comes with embedded interactions and a side panel with troubleshooting information. Each Insight’s interactions and side panel vary based on the Watchdog Insight type.
Filter on Insight query
To refine your current view to match a Watchdog Insight, hover over the top right corner of an Insight summary card. Two icons appear. Click on the inverted triangle icon with the tooltip Filter on Insight. The page refreshes to show a list of entries corresponding to the insight. Note: Filtering on Watchdog Insights automatically changes the scope you’re looking at. As a result, if you select an outlier insight, it is no longer visible, as it is treated as the baseline.
Share an outlier
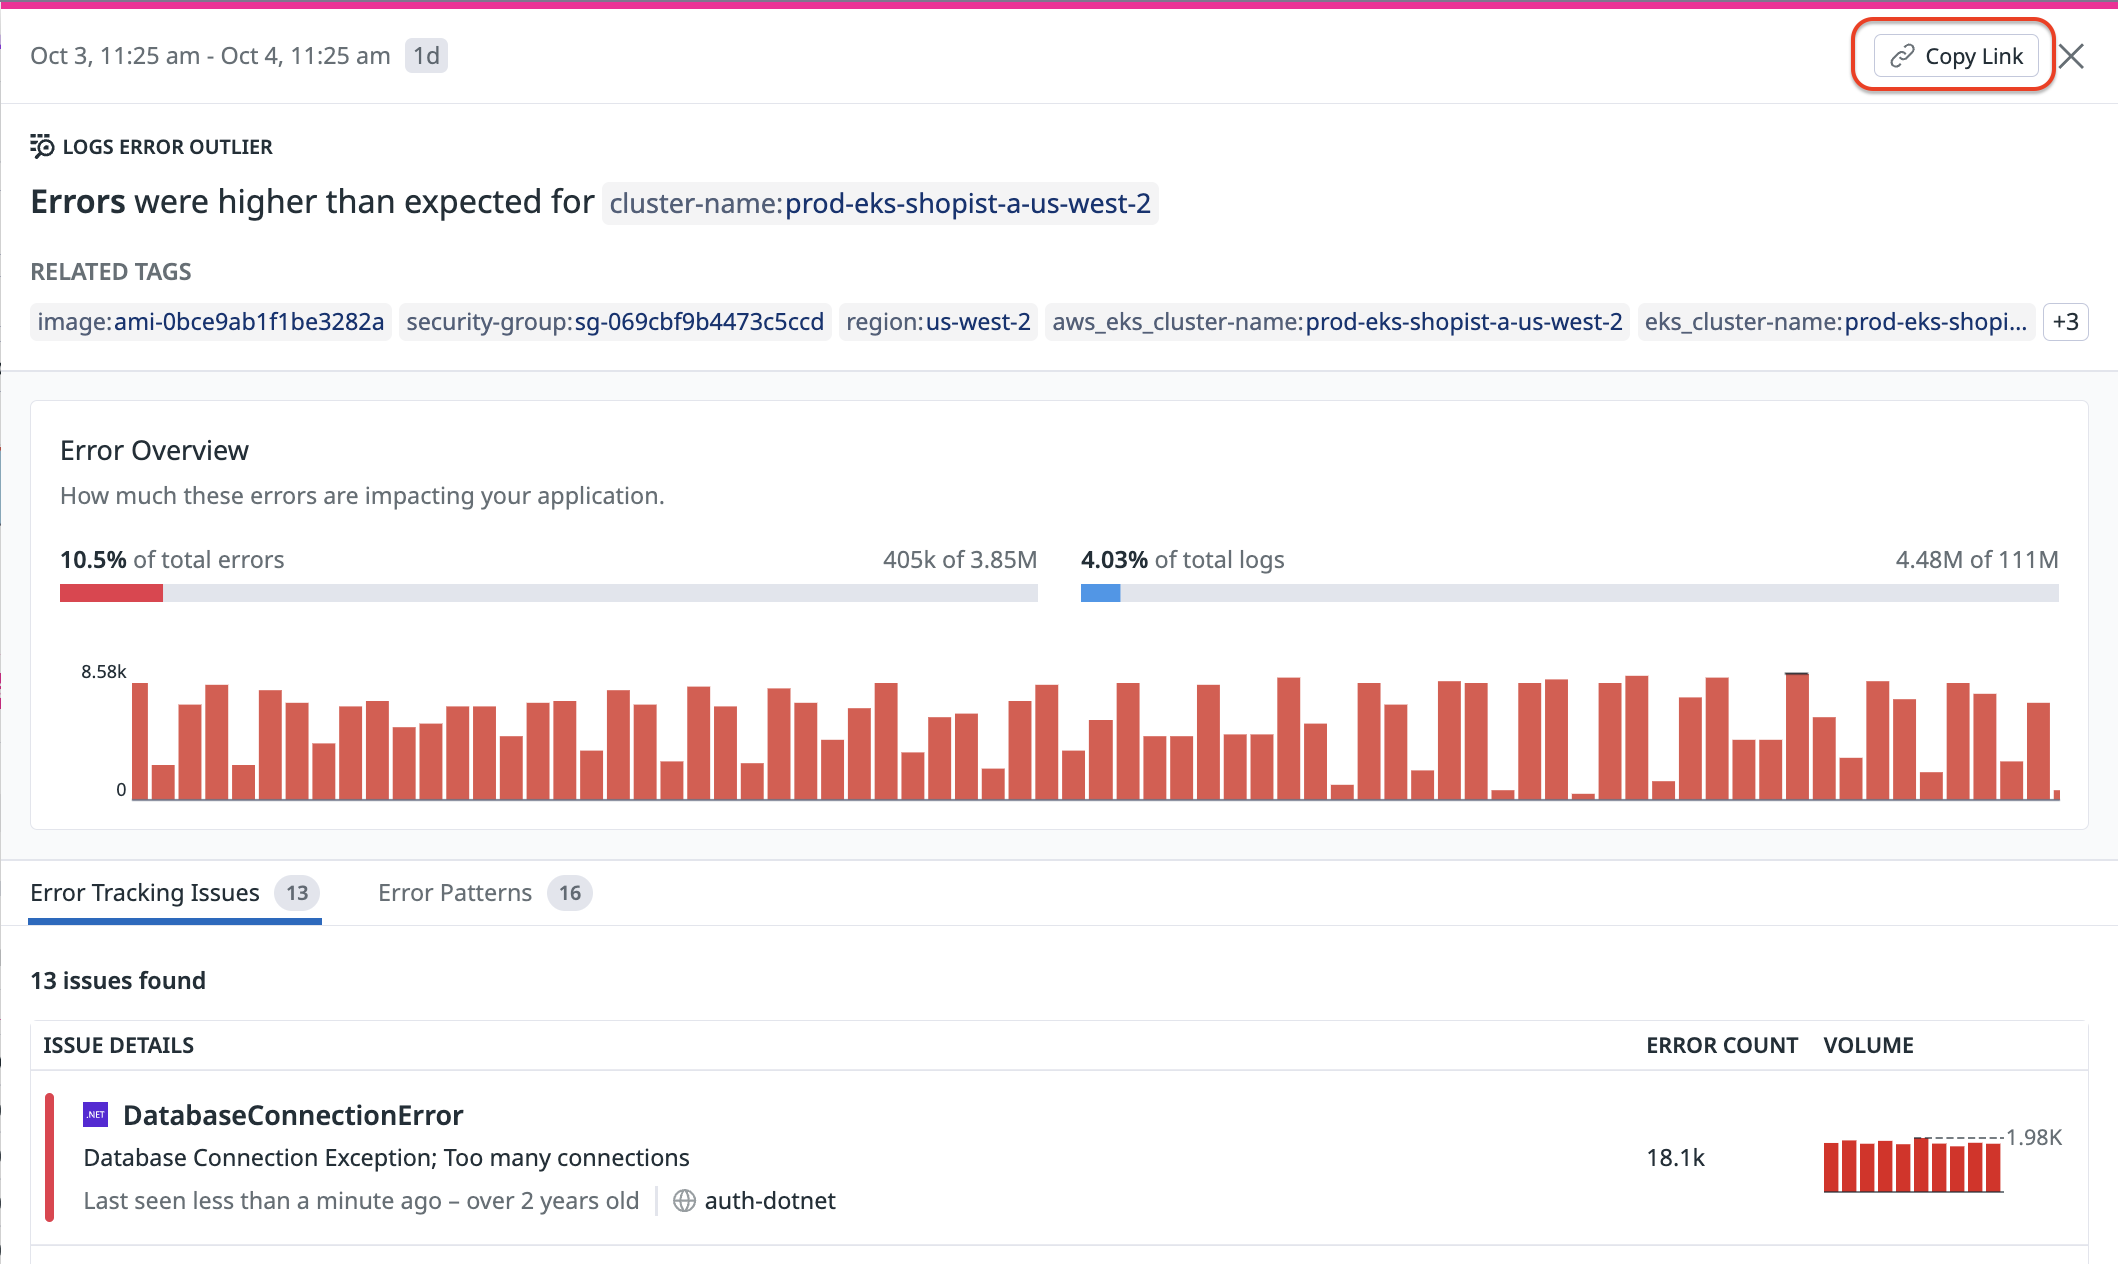
To share a given outlier, click on it in the insight panel to open the details side panel. Click the Copy Link button at the top of the details panel:
The link to the outlier expires with the retention of the underlying data. For instance, if the logs used to build the outlier are retained for 15 days, the link to the outlier expires with the logs after 15 days.
Explore graph insights with Watchdog explains
Datadog collects various types of data to provide insights into application performance, including metrics, traces, and logs, which tell you what, how, and why something is happening. Watchdog Explains analyzes high-level trends such as latency, error rates, or request count evolution to detect critical signals. Upon observing a spike in these graphs, Watchdog Explains helps you investigate the immediate questions:
- What is the source of the spike?
- Does this anomaly affect everyone or is an isolated incident?
For more information, see the Watchdog Explains documentation.
Outlier types
Error outliers
Error outliers display fields such as faceted tags or attributes containing characteristics of errors that match the current query. Statistically overrepresented key:value pairs among errors provide hints into the root causes of problems.
Typical examples of error outliers include env:staging, docker_image:acme:3.1, and http.useragent_details.browser.family:curl.
In the banner card view, you can see:
- The field name
- The proportion of errors and overall logs that the field contributes to
In the full side panel view, you can see:
- The timeseries of error logs that contain the field
- Tags that are often associated with the error logs
- A comprehensive list of log patterns
APM outliers are available on all APM pages where the Watchdog Insights carousel is available:
Error outliers
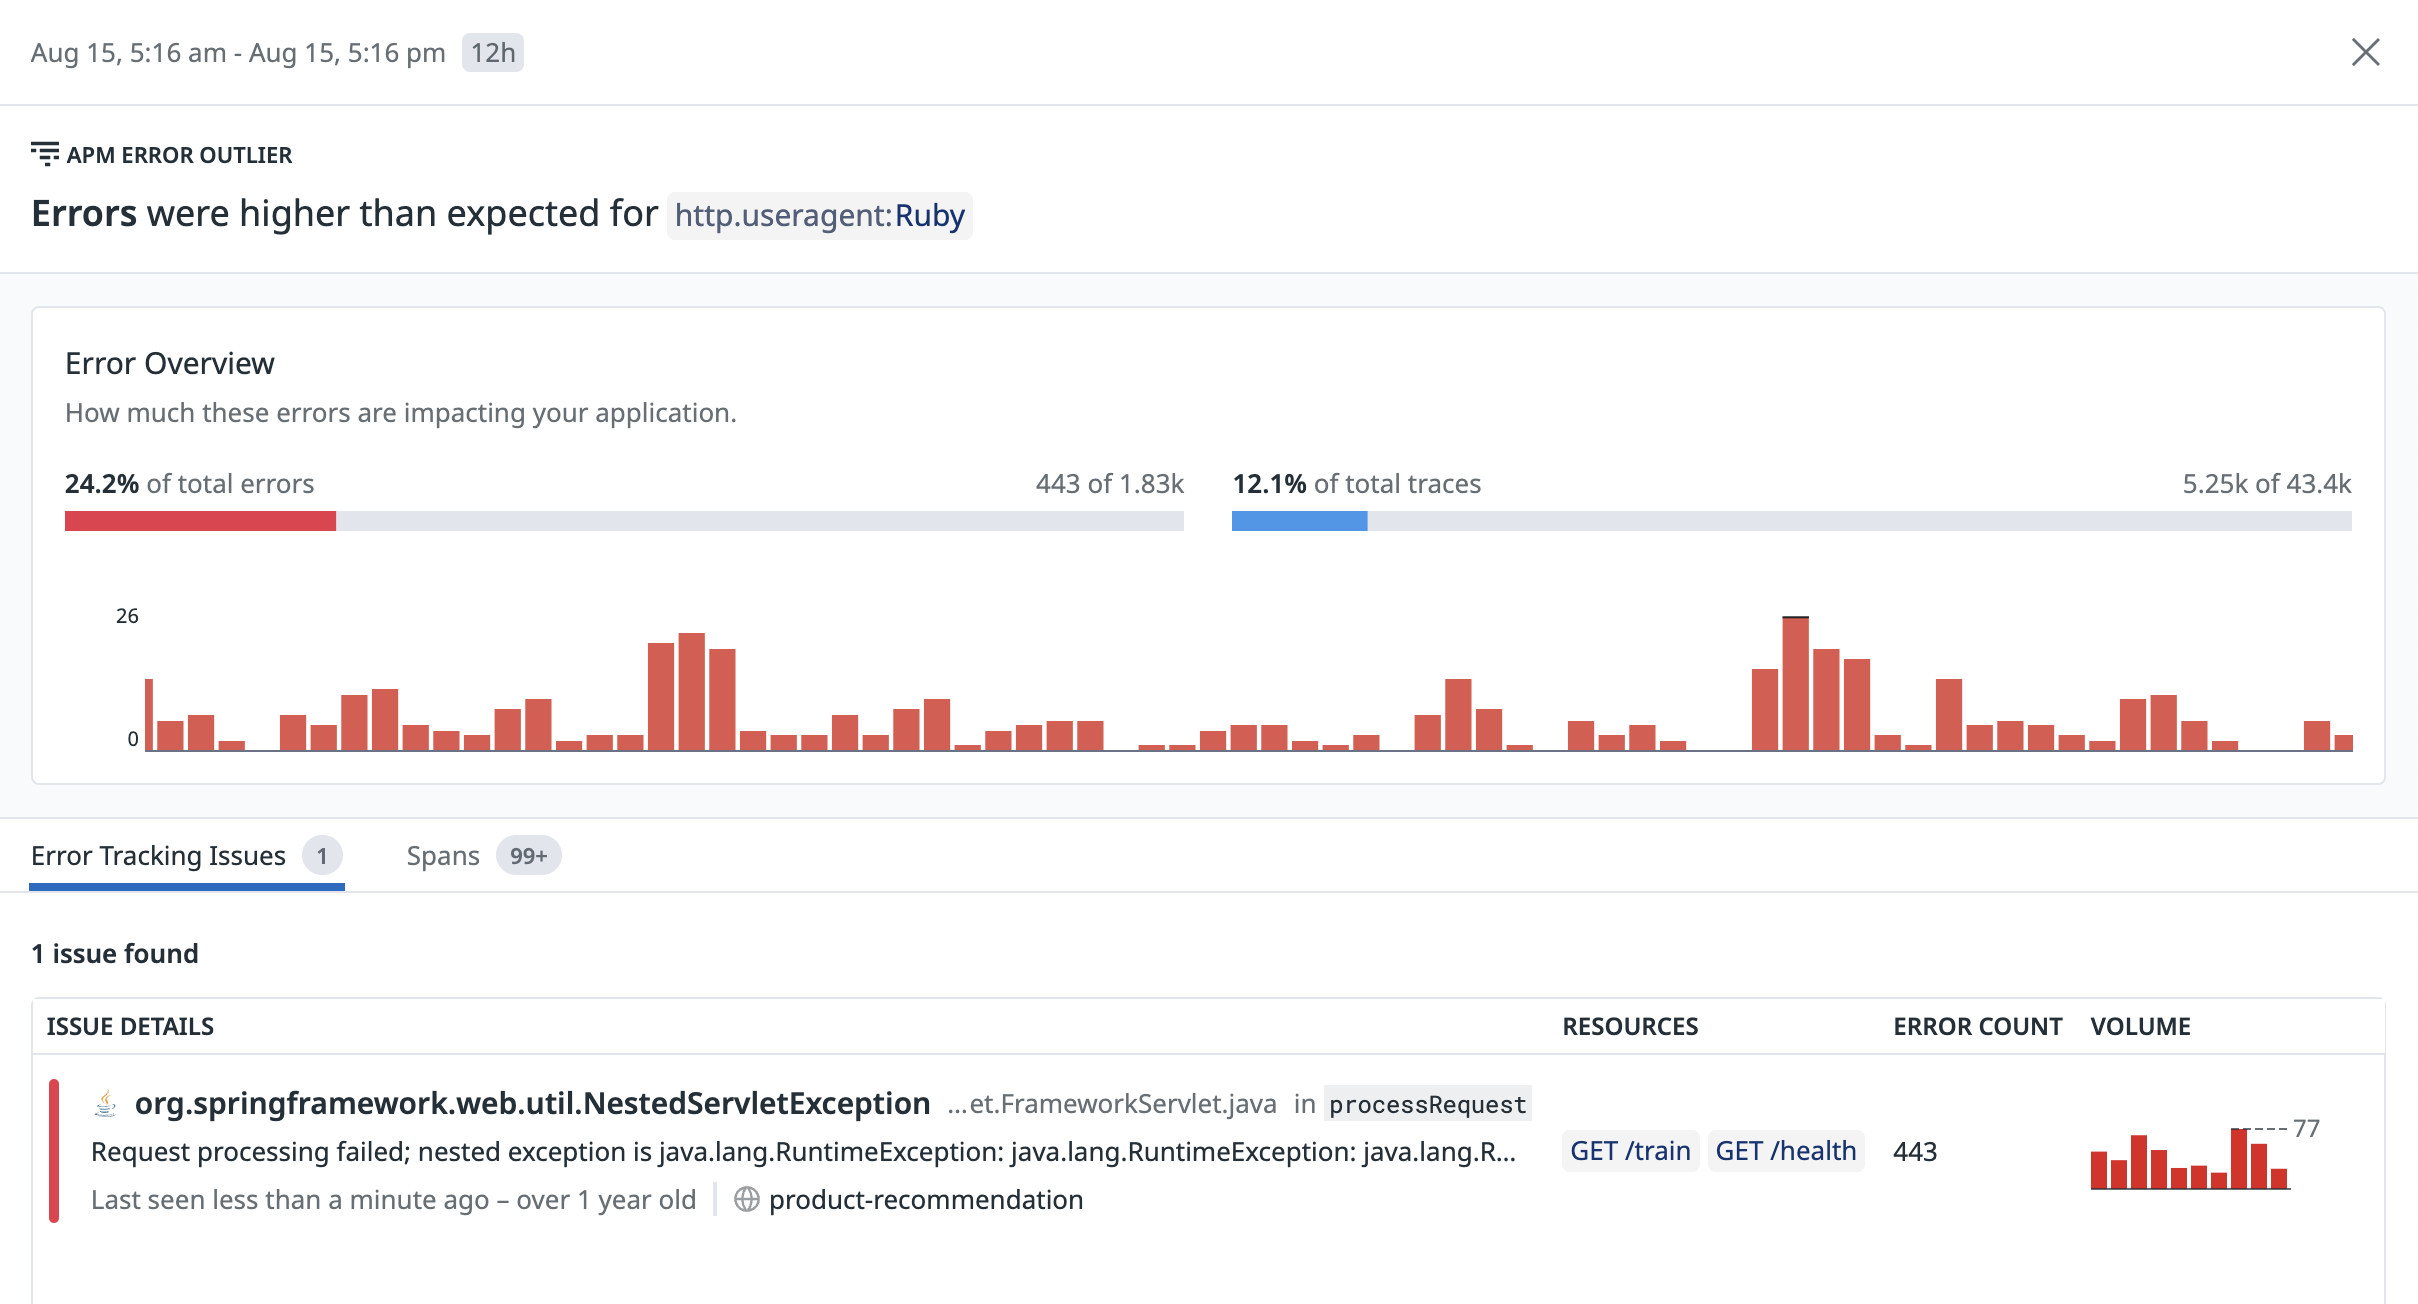
Error outliers display fields such as tags containing characteristics of errors that match the current query. Statistically overrepresented key:value pairs among errors provide hints into the root cause of problems.
Typical examples of error outliers include env:staging, availability_zone:us-east-1a, cluster_name:chinook, and version:v123456.
In the banner card view, you can see:
- The field name
- The proportion of errors and overall traces that the field contributes to
In the full side panel view, you can see:
- The timeseries of error traces that contain the field
- Tags that are often associated with the error traces
- A comprehensive list of related Error Tracking Issues and failing spans
Latency outliers
Latency outliers display fields such as tags that are associated with performance bottlenecks that match the current search query. key:value pairs with worse performance than the baseline can provide hints into the performance bottlenecks among a subset of APM spans.
Latency outliers are computed for the span duration.
In the banner card view, you can see:
The field name
The latency distribution for spans containing the tag and the baseline for the rest of the data
A percentile of interest latency value for the outlier tag and the difference with the baseline for the rest of the data
In the full side panel, you can see a latency distribution graph for the tag and the baseline. The X axis has increments of p50, p75, p99, and max, along with a list of APM events that contain the field.
Lock contention outlier
In the banner card view, you can see:
- The name of the impacted service
- The number of threads impacted
- The potential CPU savings (and estimated cost savings)
In the full side panel, you can see instructions on how to resolve the lock contention:
Garbage collection outlier
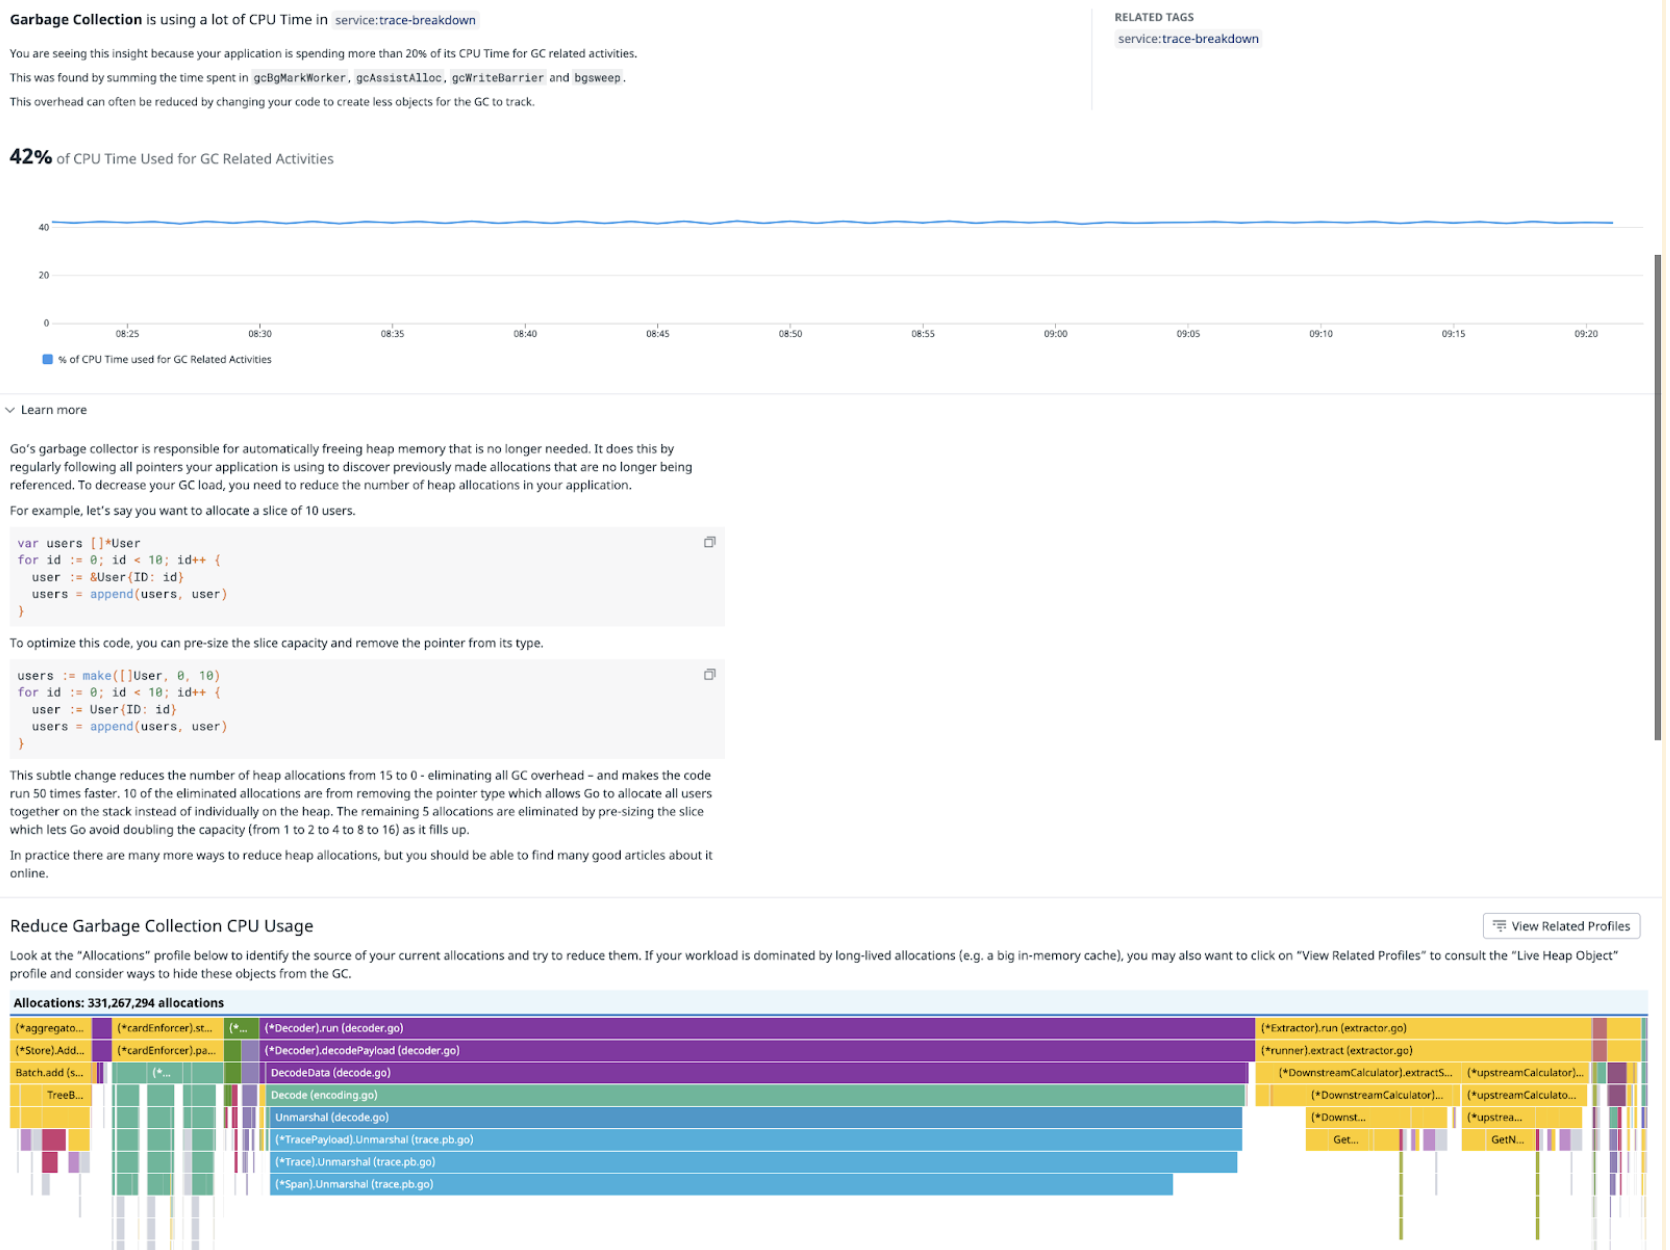
In the banner card view, you can see:
- The name of the impacted service
- The amount of CPU time used to perform garbage collection
In the full side panel, you can see instructions on how to better configure garbage collection to free up some CPU time:
Regex compilation outlier
In the banner card view, you can see:
- The name of the impacted service
- The amount of CPU time spent on compiling regexes
In the full side panel, you can see instructions on how to improve regex compilation time, as well as examples of functions within your code that could be improved:
For Database Monitoring, Watchdog surfaces insights on the following metrics:
CPUCommitsIOBackgroundConcurrencyIdle
Find the databases impacted by one or multiple outliers by using the Insight carousel.
An overlay is then set on the databases, with pink pills highlighting the different Insights and giving more information about what happened.
Error outlier
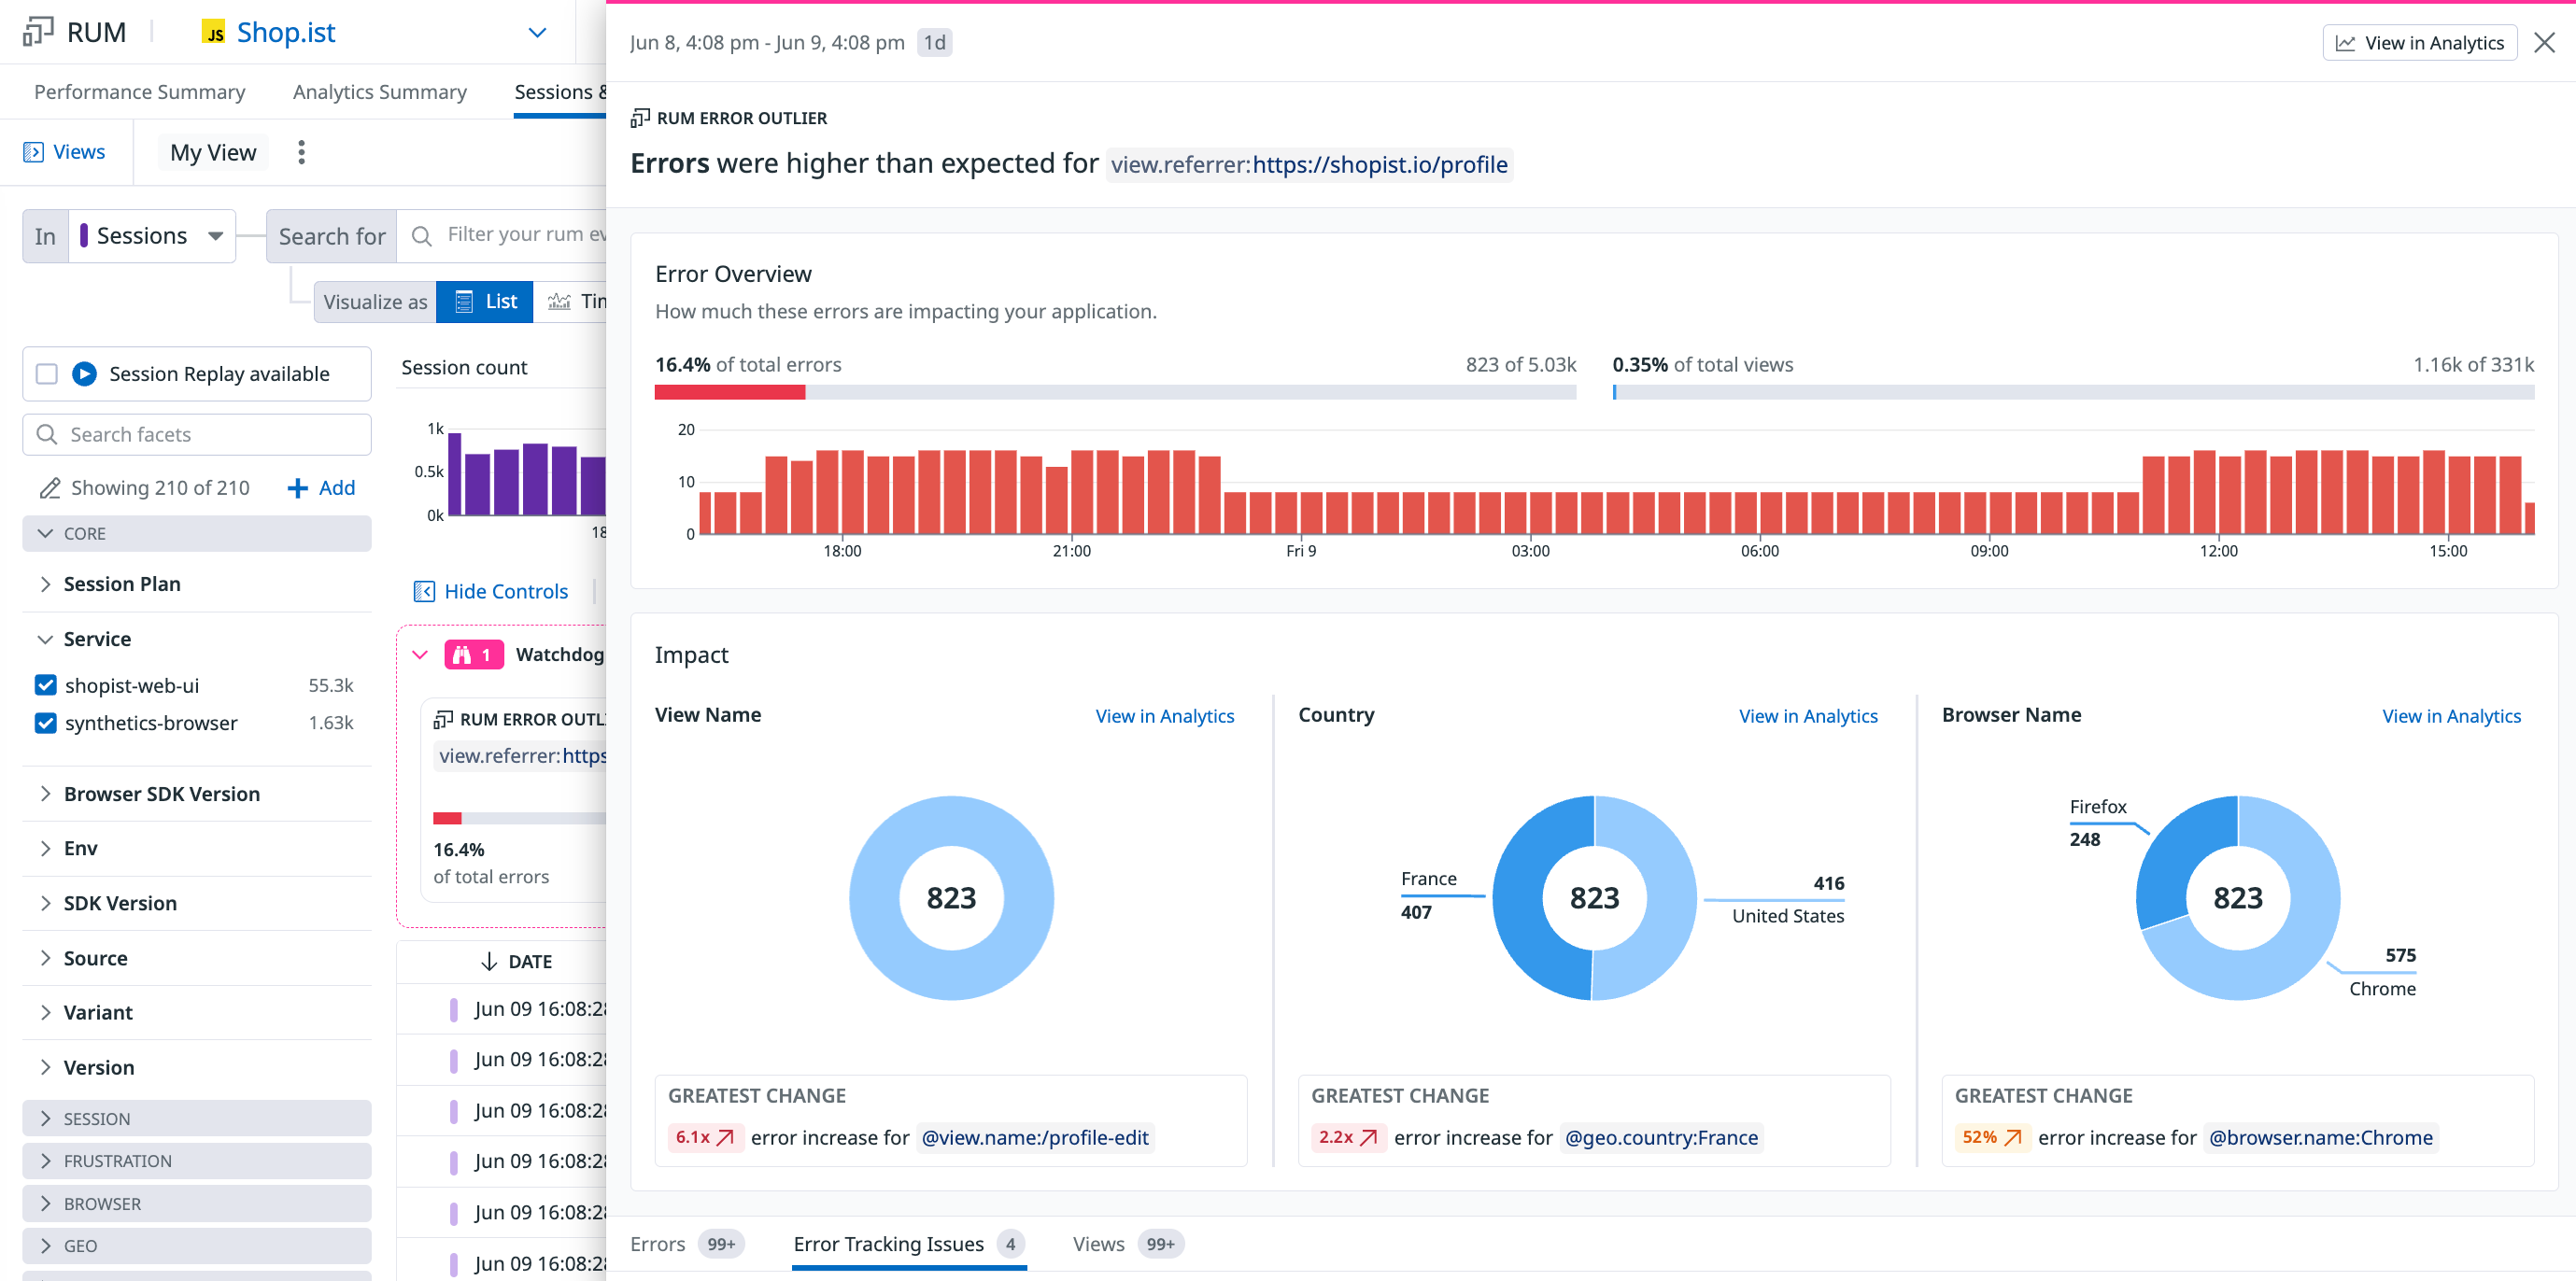
Error outliers display fields such as faceted tags or attributes that contain characteristics of errors that match the current search query. Statistically overrepresented key:value pairs among errors can provide hints into the root causes of issues. Typical examples of error outliers include env:staging, version:1234, and browser.name:Chrome.
In the banner card view, you can see:
- The field name
- The proportion of total errors and overall RUM events that the field contributes to
- Related tags
In the full side panel, you can see a timeseries graph about the total number of RUM errors with the field, along with impact pie charts and a list of RUM events that contain the field.
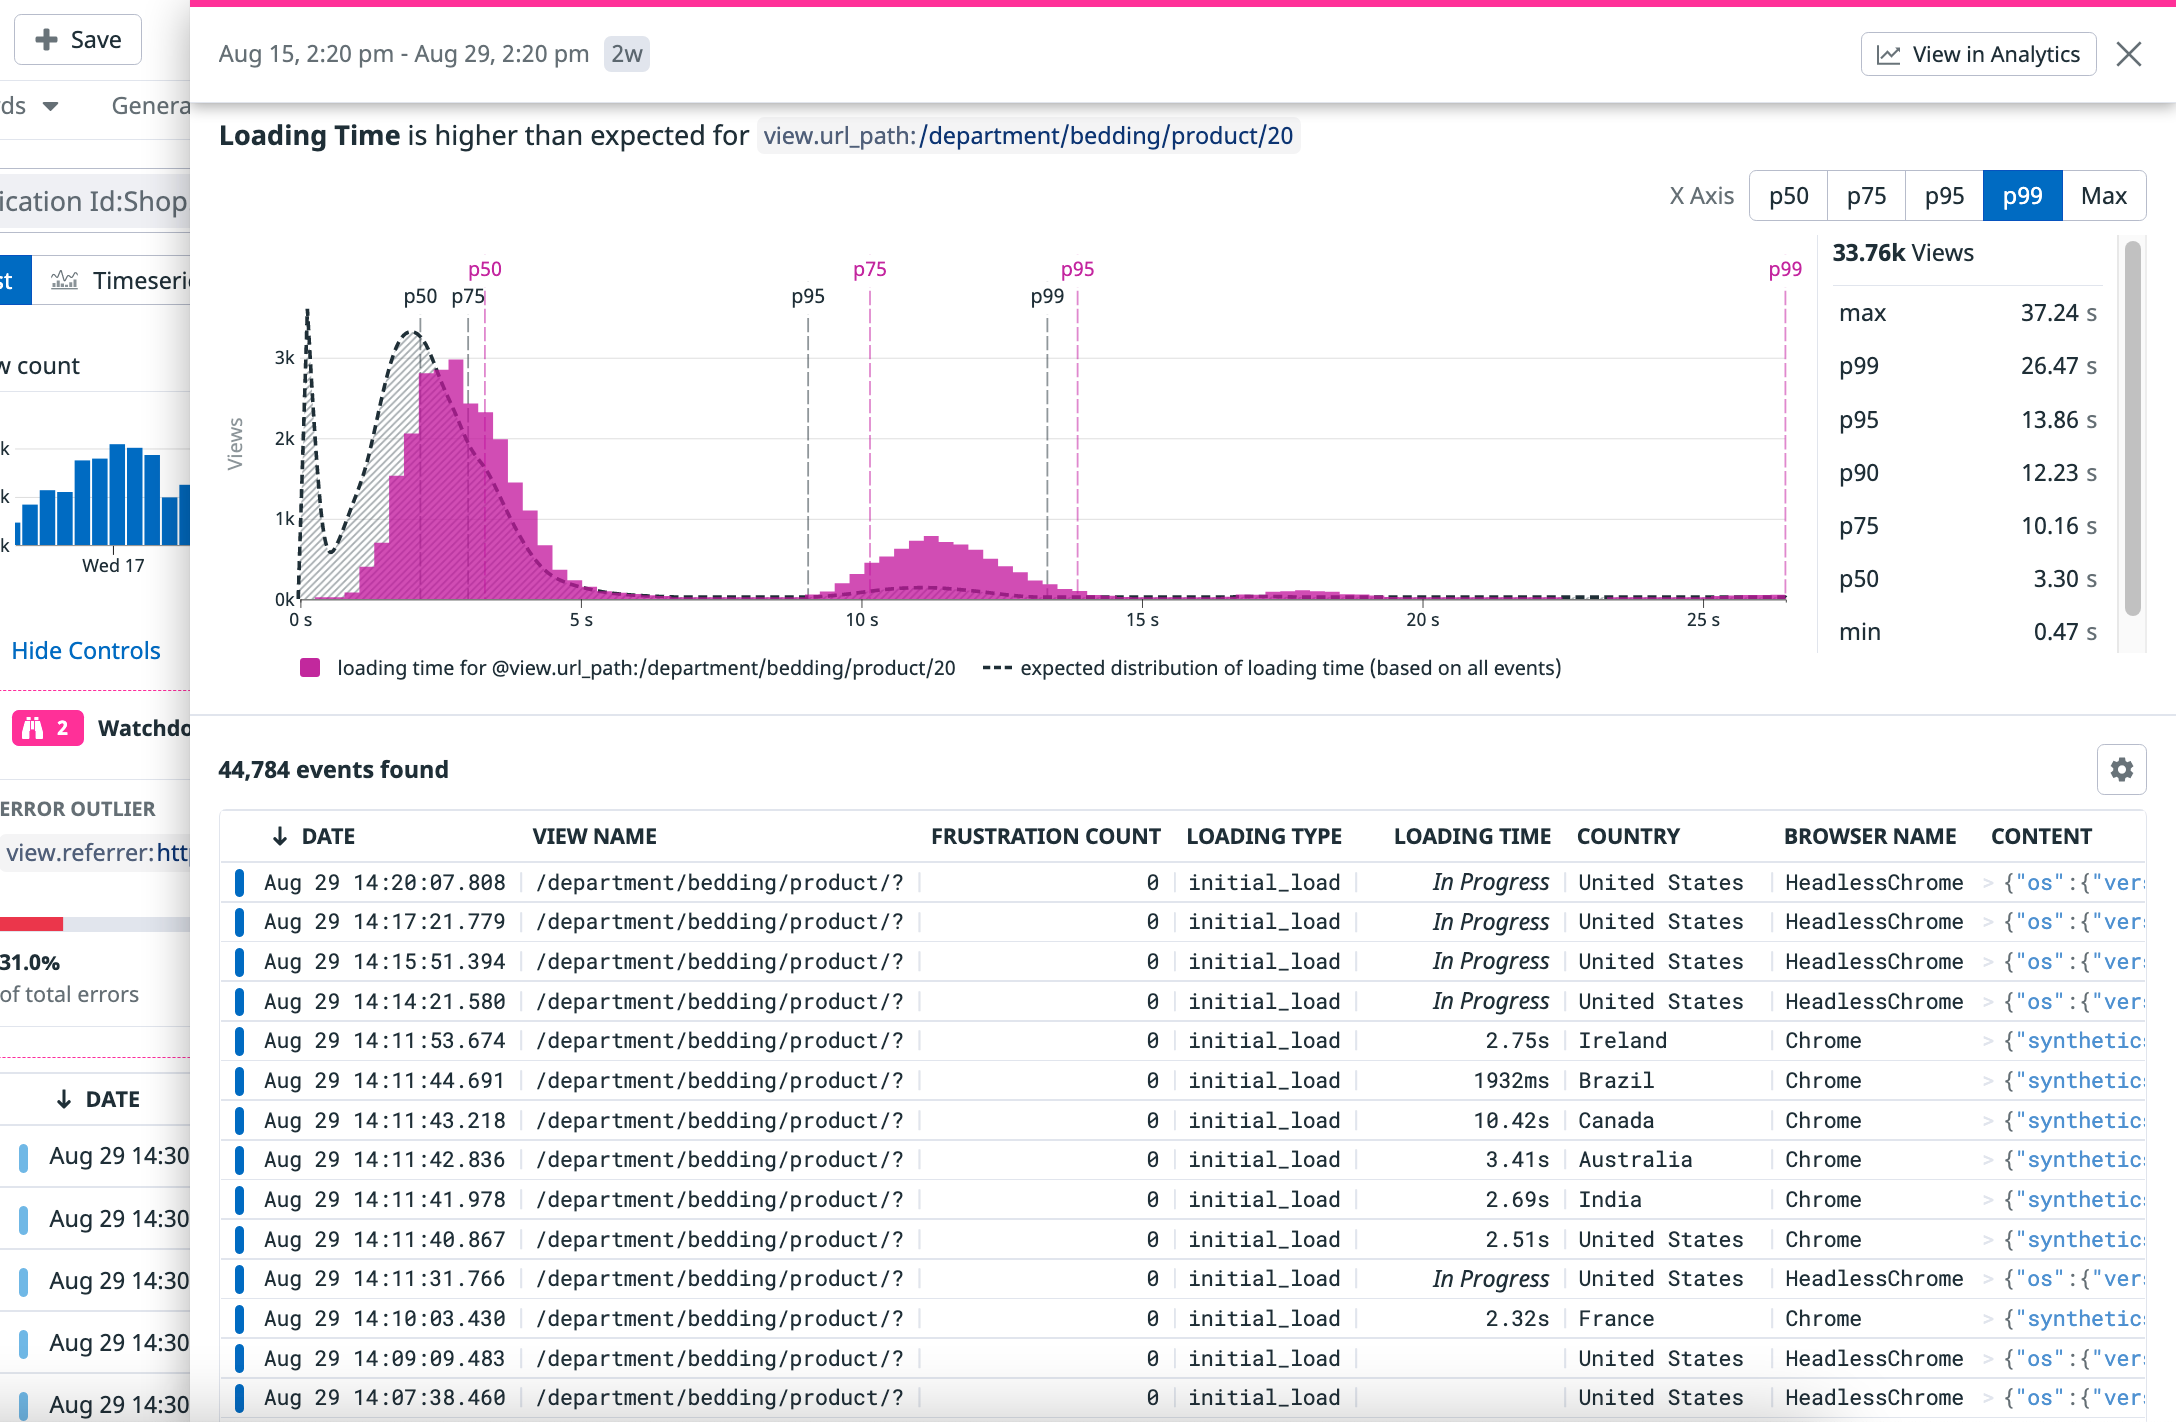
Latency outlier
Latency outliers display fields such as faceted tags or attributes that are associated with performance bottlenecks that match the current search query. key:value pairs with worse performance than the baseline can provide hints into the performance bottlenecks among a subset of real users.
Latency outliers are computed for Core Web Vitals such as First Contentful Paint, First Input Delay, Cumulative Layout Shift, and Loading Time. For more information, see Monitoring Page Performance.
In the banner card view, you can see:
- The field name
- The performance metric value containing the field and the baseline for the rest of the data
In the full side panel, you can see a timeseries graph about the performance metric. The X axis has increments of p50, p75, p99, and max, along with a list of RUM events that contain the field.
Error outliers
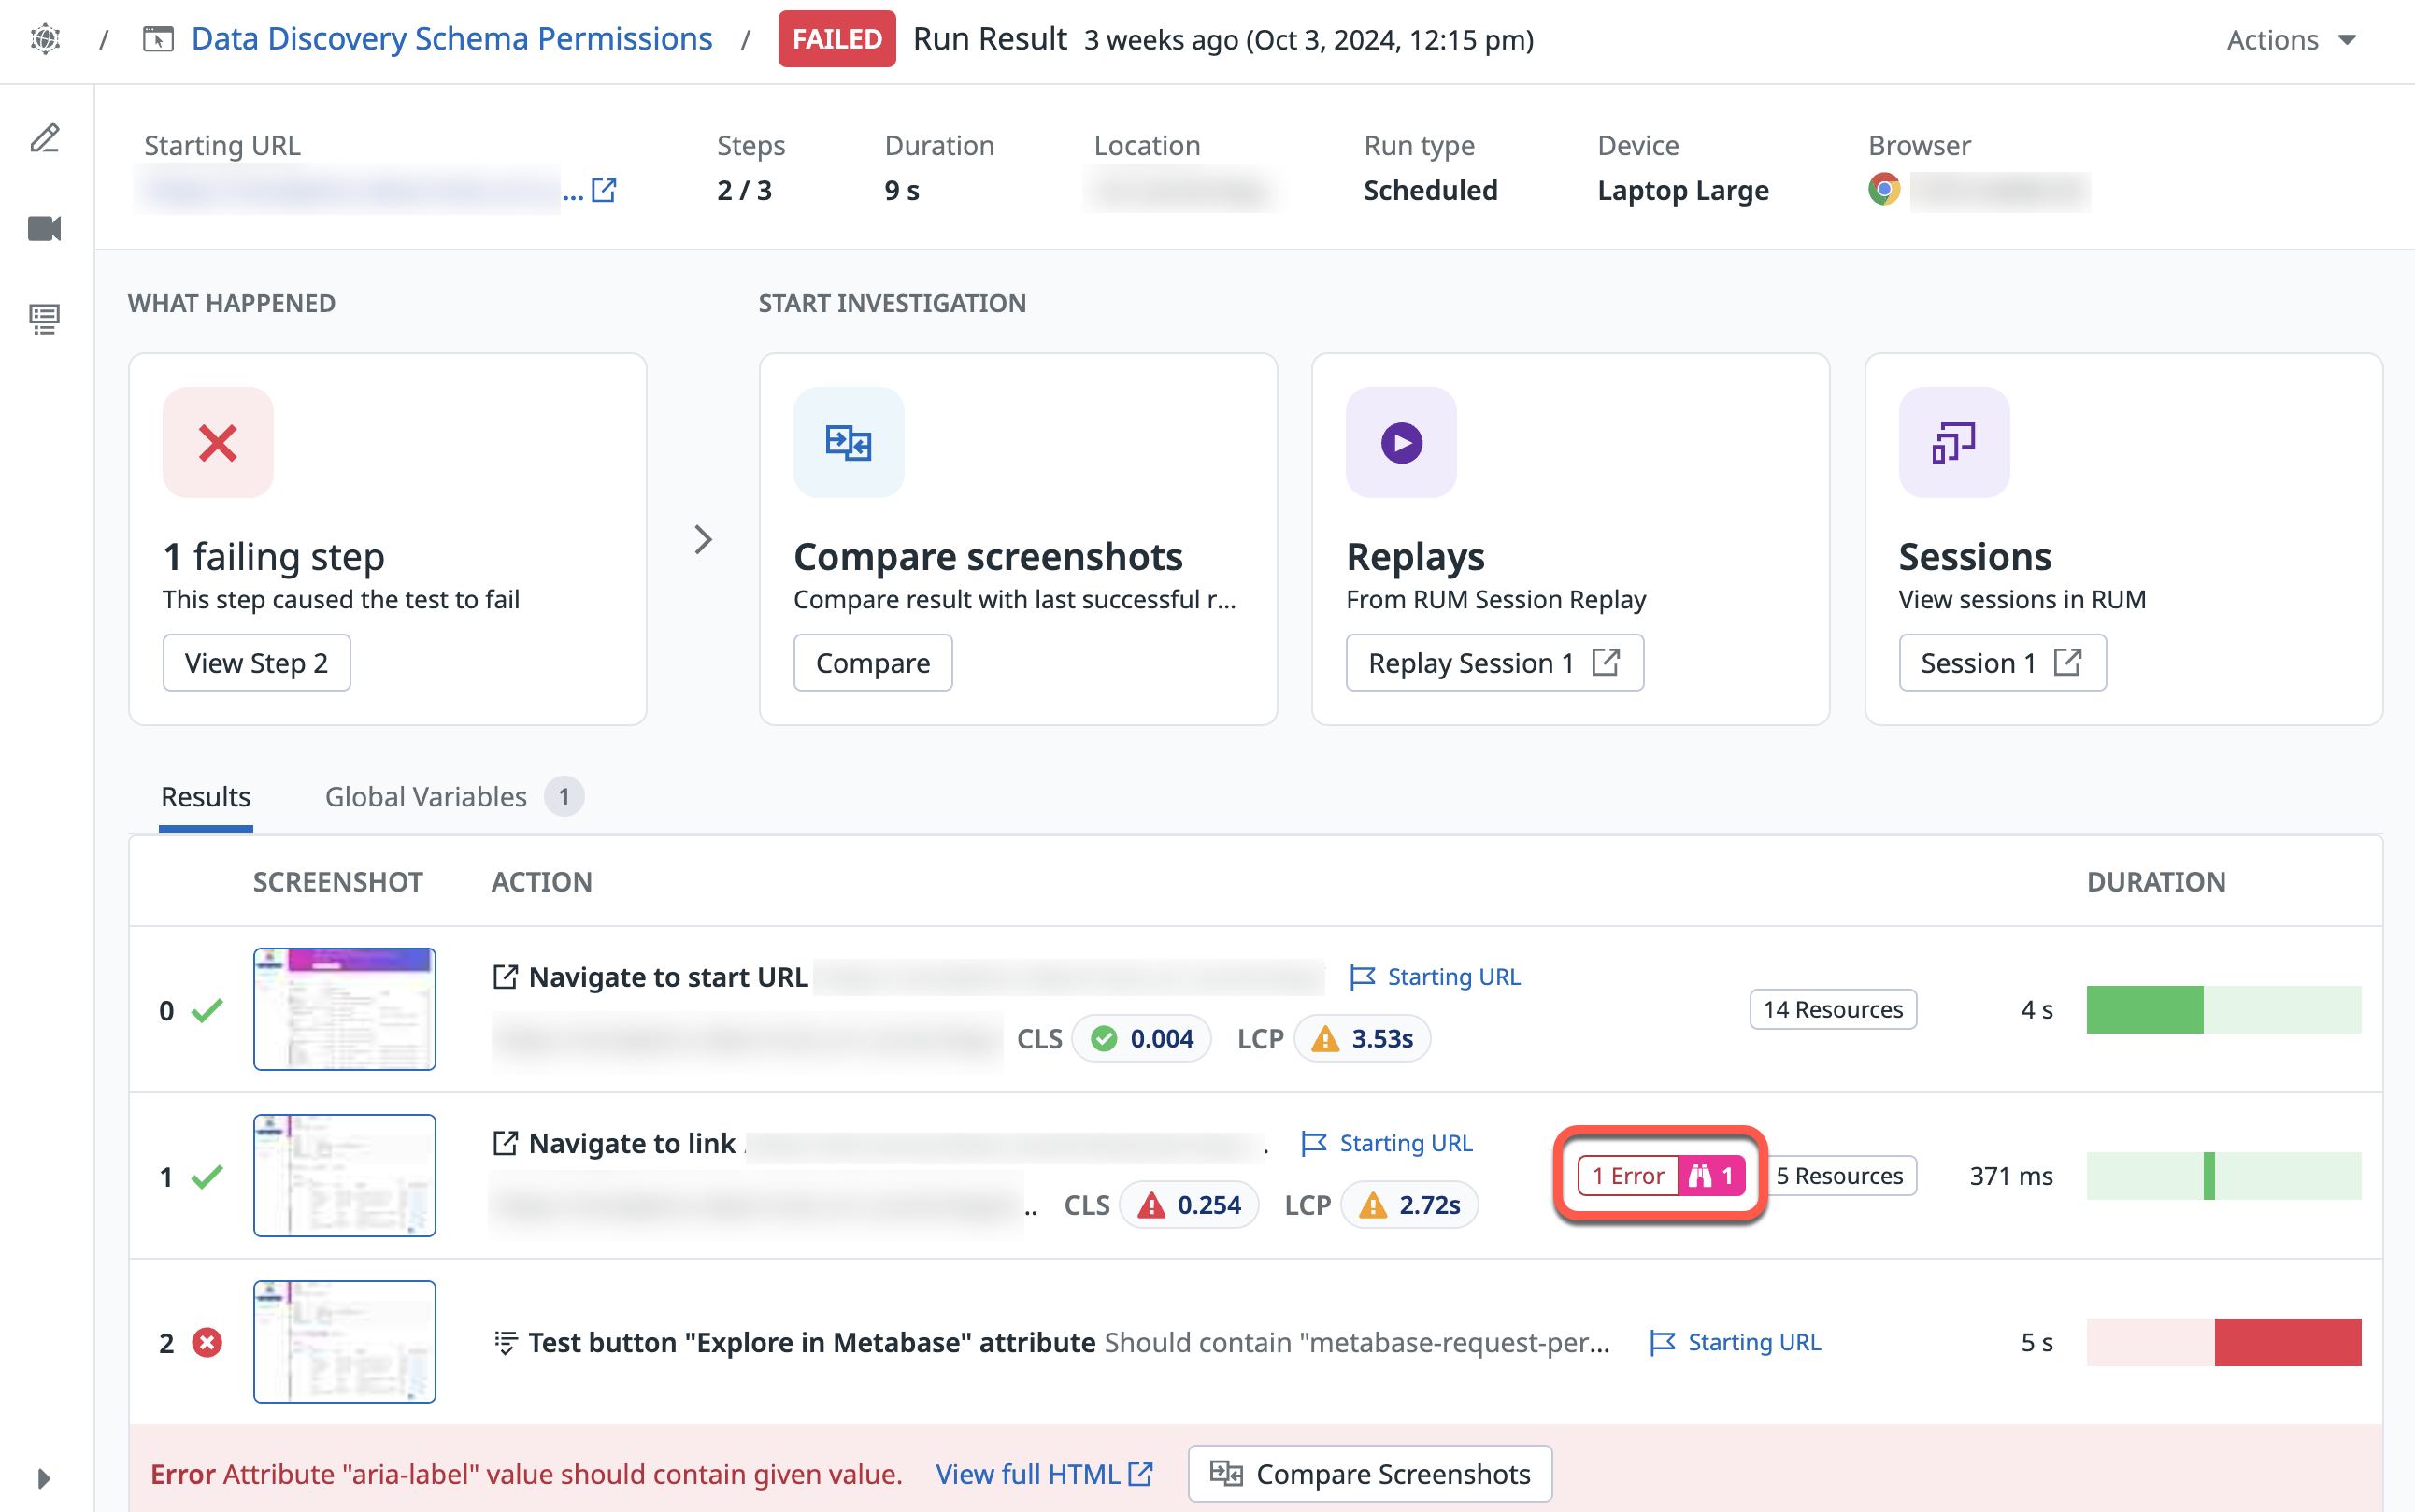
Error outliers in Synthetic Monitoring display unexpected behaviors and performance deviations. These anomalies provide insights into the reliability issues in your Synthetic Browser Tests. Identifying these error outliers helps you troubleshoot errors in failed test runs, enhancing debugging and reducing Mean Time To Resolution (MTTR).
When reviewing failed test runs, you can see the number of error outliers on the failed test:
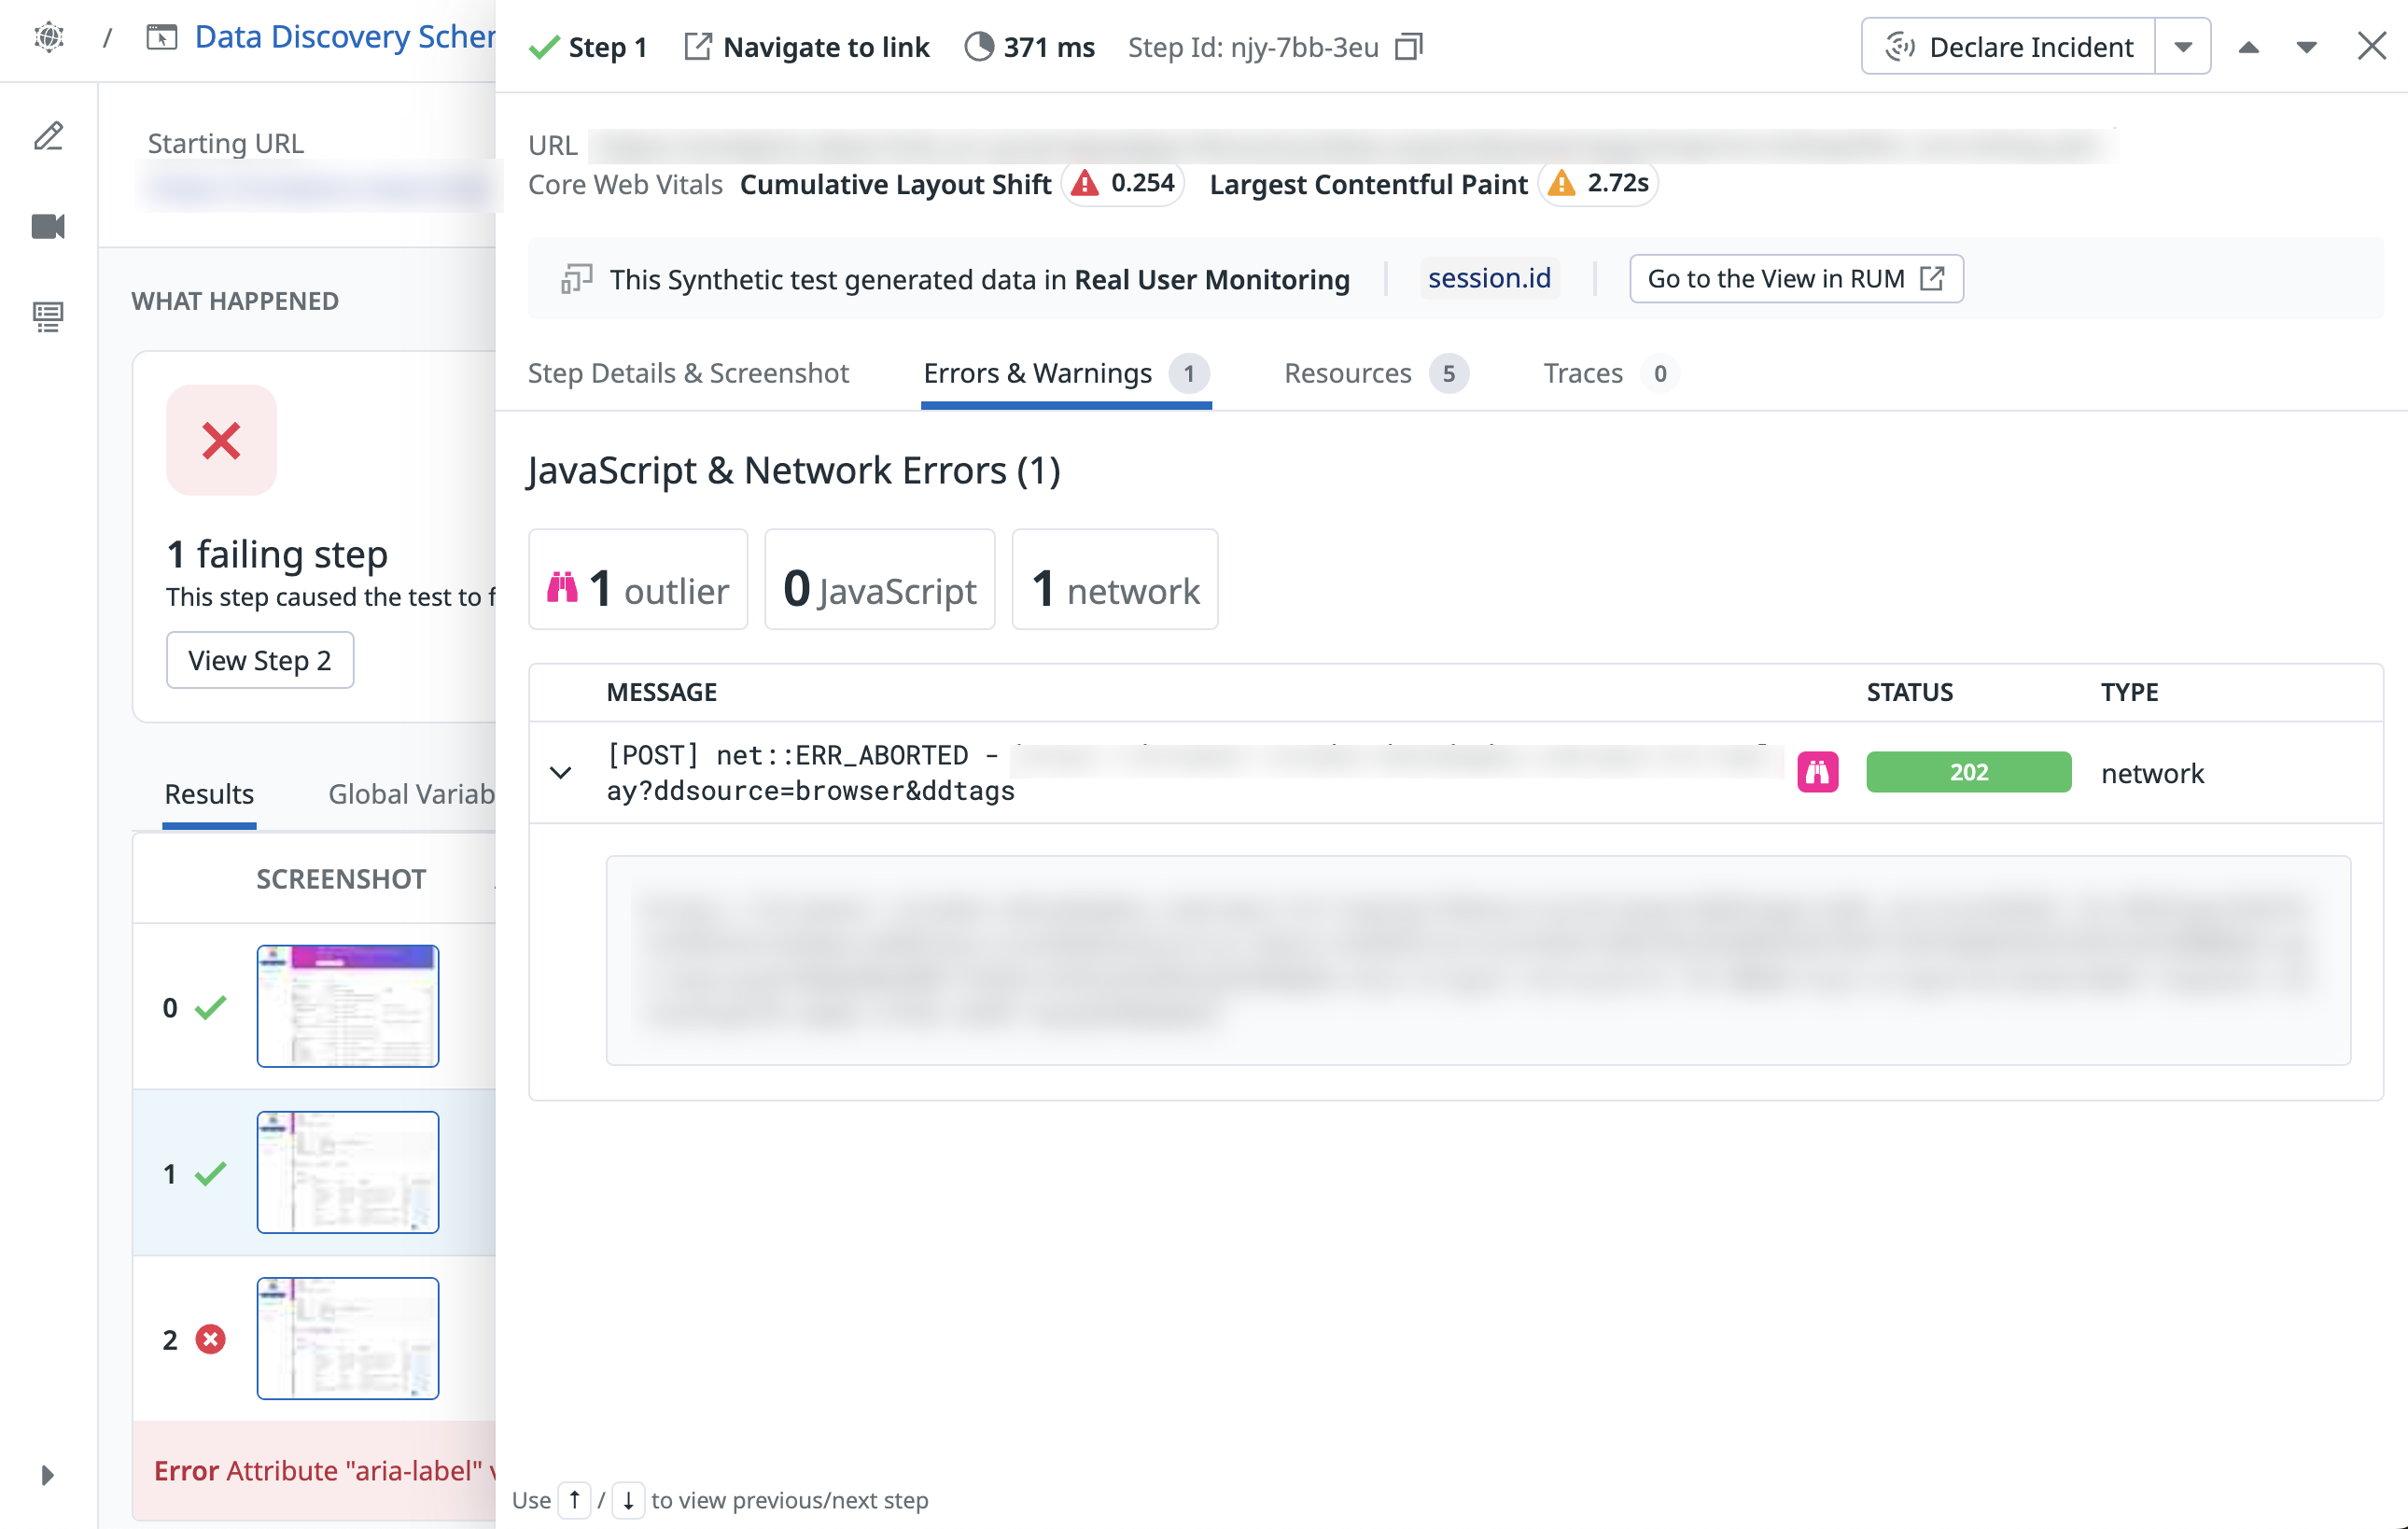
To view the error outlier message, click on the outlier. Then, on the test step side panel, click the Errors & Warnings tab.
For serverless infrastructures, Watchdog surfaces the following insights:
Cold Start Ratio Up/DownError Invocation Ratio Up/DownMemory Usage Up/DownOOM Ratio Up/DownEstimated Cost Up/DownInit Duration Up/DownRuntime Duration Up/Down
Find the serverless functions impacted by one or multiple outliers by using the Insights carousel.
An overlay is then set on the function, with pink pills highlighting the different insights and giving more information about what happened.
For Process Explorer, the Watchdog Insight carousel reflects all Process anomalies for the current context of the Process Explorer.
For Kubernetes Explorer, the Watchdog Insight carousel reflects all the Kubernetes anomalies for the current context of the Kubernetes Explorer.
Further reading
Additional helpful documentation, links, and articles:


