- Agents
- Essentials
- Getting Started
- Agent
- API
- APM Tracing
- Containers
- Dashboards
- Database Monitoring
- Datadog
- Datadog Site
- DevSecOps
- Incident Management
- Integrations
- Internal Developer Portal
- Logs
- Monitors
- Notebooks
- OpenTelemetry
- Profiler
- Search
- Session Replay
- Security
- Serverless for AWS Lambda
- Software Delivery
- Synthetic Monitoring and Testing
- Tags
- Workflow Automation
- Learning Center
- Support
- Glossary
- Standard Attributes
- Guides
- Agent
- Integrations
- Extend Datadog
- Authorization
- DogStatsD
- Custom Checks
- Integrations
- Build an Integration with Datadog
- Create an Agent-based Integration
- Create an API-based Integration
- Create a Log Pipeline
- Integration Assets Reference
- Build a Marketplace Offering
- Create an Integration Dashboard
- Create a Monitor Template
- Create a Cloud SIEM Detection Rule
- Install Agent Integration Developer Tool
- Service Checks
- Community
- Guides
- OpenTelemetry
- Administrator's Guide
- API
- Partners
- Datadog Mobile App
- DDSQL Reference
- CoScreen
- CoTerm
- Remote Configuration
- Cloudcraft (Standalone)
- In The App
- Dashboards
- Notebooks
- DDSQL Editor
- Reference Tables
- Sheets
- Monitors and Alerting
- Service Level Objectives
- Metrics
- Watchdog
- Bits AI
- Internal Developer Portal
- Error Tracking
- Change Tracking
- Event Management
- Incident Response
- Actions & Remediations
- Infrastructure
- Cloudcraft
- Resource Catalog
- Universal Service Monitoring
- End User Device Monitoring
- Hosts
- Containers
- Processes
- Serverless
- Network Monitoring
- Storage Management
- Cloud Cost
- Application Performance
- APM
- Continuous Profiler
- Database Monitoring
- Agent Integration Overhead
- Setup Architectures
- Setting Up Postgres
- Setting Up MySQL
- Setting Up SQL Server
- Setting Up Oracle
- Setting Up Amazon DocumentDB
- Setting Up MongoDB
- Setting Up ClickHouse
- Connecting DBM and Traces
- Data Collected
- Exploring Database Hosts
- Exploring Query Metrics
- Exploring Query Samples
- Exploring Database Schemas
- Exploring Recommendations
- Troubleshooting
- Guides
- Data Streams Monitoring
- Data Observability
- Digital Experience
- Real User Monitoring
- Synthetic Testing and Monitoring
- Continuous Testing
- Experiments
- Product Analytics
- Session Replay
- Software Delivery
- CI Visibility
- CD Visibility
- Deployment Gates
- Test Optimization
- Code Coverage
- PR Gates
- DORA Metrics
- Feature Flags
- Developer Integrations
- Security
- Security Overview
- Cloud SIEM
- Code Security
- Cloud Security
- App and API Protection
- AI Guard
- Workload Protection
- Sensitive Data Scanner
- AI Observability
- Log Management
- Observability Pipelines
- Configuration
- Sources
- Processors
- Destinations
- Packs
- Akamai CDN
- Amazon CloudFront
- Amazon VPC Flow Logs
- AWS Application Load Balancer Logs
- AWS CloudTrail
- AWS Elastic Load Balancer Logs
- AWS Network Load Balancer Logs
- Cisco ASA
- Cloudflare
- F5
- Fastly
- Fortinet Firewall
- HAProxy Ingress
- Istio Proxy
- Juniper SRX Firewall Traffic Logs
- Netskope
- NGINX
- Okta
- Palo Alto Firewall
- Windows XML
- ZScaler ZIA DNS
- Zscaler ZIA Firewall
- Zscaler ZIA Tunnel
- Zscaler ZIA Web Logs
- Search Syntax
- Scaling and Performance
- Monitoring and Troubleshooting
- Guides and Resources
- Log Management
- CloudPrem
- Administration
Deployment Tracking
The version tag
The version tag is reserved within Unified Service Tagging. It’s applied to infrastructure metrics (host, container, process, and NPM checks), trace metrics, traces, profiles, and logs.
You can use the version tag to monitor deployments and service behavior in support of your software deployment strategy.
If you have not set up the version tag refer to the Unified Service Tagging documentation for setup information.
Using version tags on the Service page
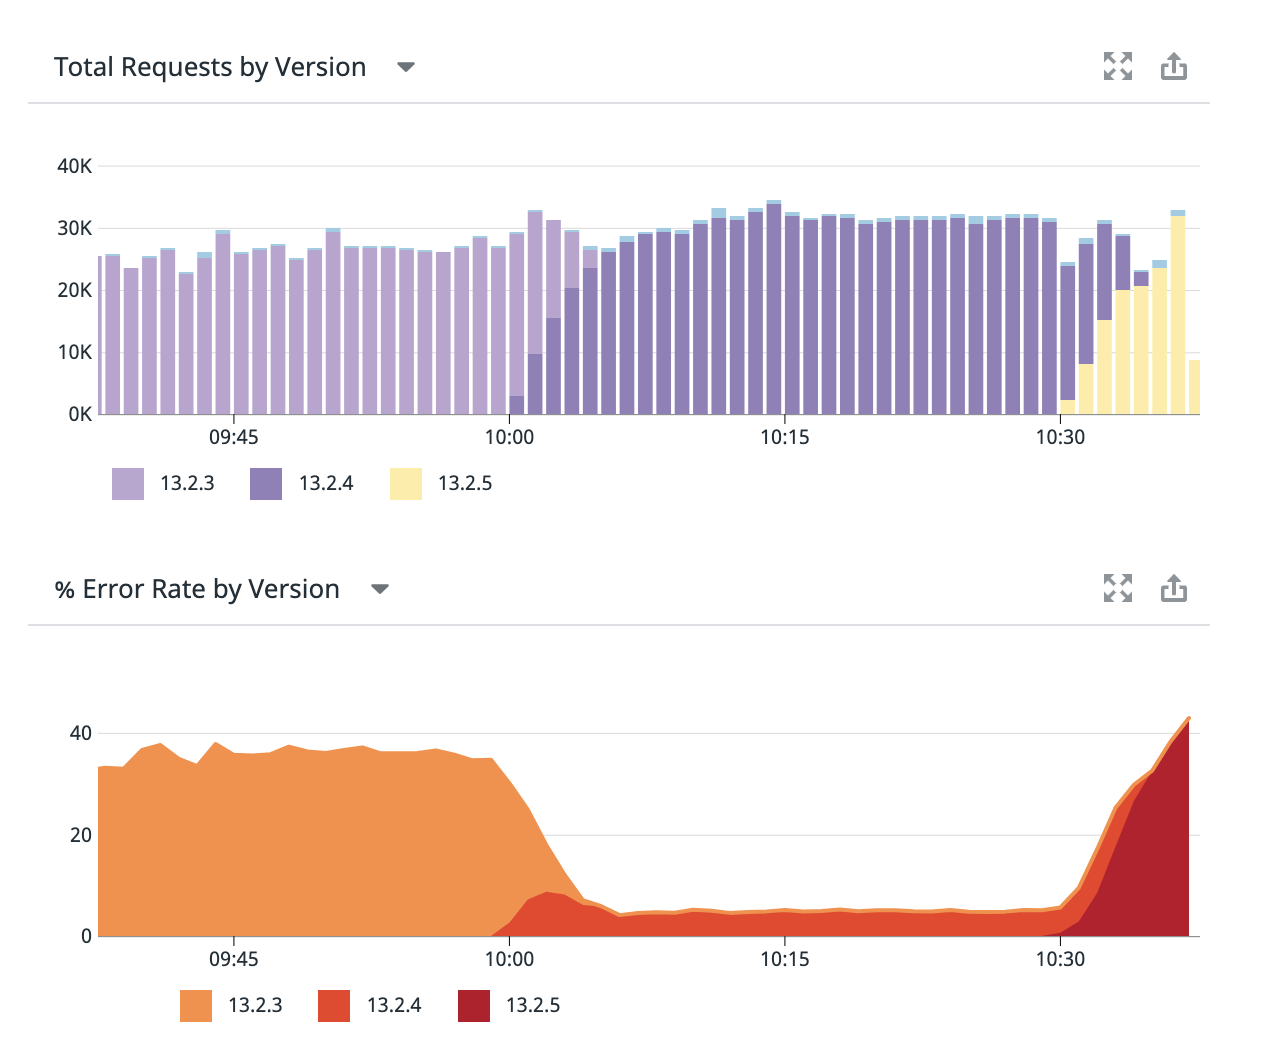
On the Service page, if the version tag is available, you can scope the Requests widget to:
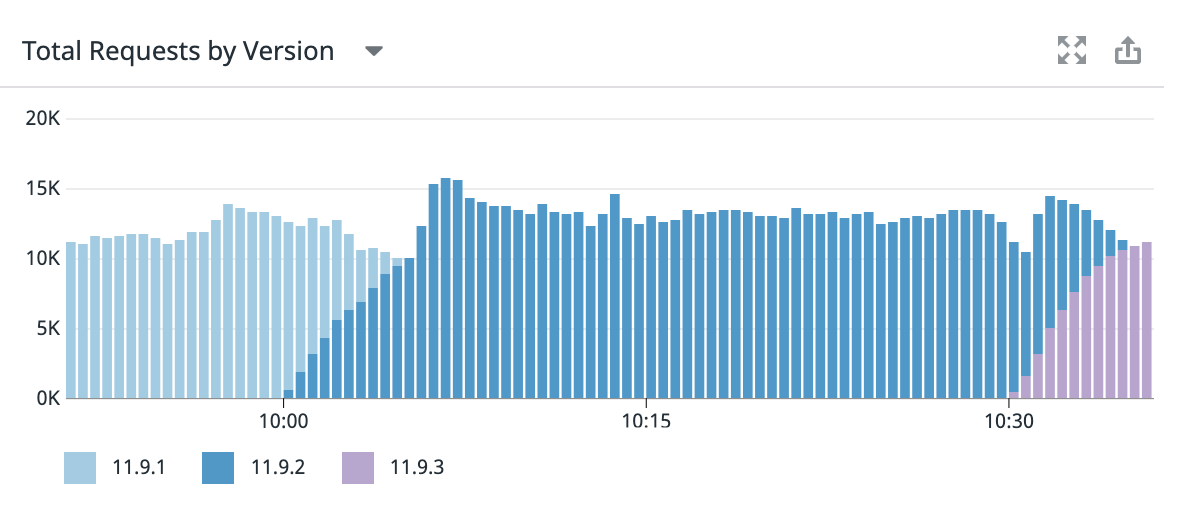
- Total Requests by Version, or
- Requests Per Second by Version
You can scope the errors widget to:
- Total Errors by Version
- Errors Per Second by Version, or
- % Error Rate by Version
Requests and Errors widgets can both be exported to dashboards and monitors.
Using version tags for automatic faulty deployment detection
Configuring your services with the version tag enables Automatic Faulty Deployment Detection.
You can set up a monitor to get automatically notified on all potentially faulty deployments. To do so, navigate to the New Monitors page and choose Events, and include tags:deployment_analysis in the search query defining the monitor.
Versions deployed
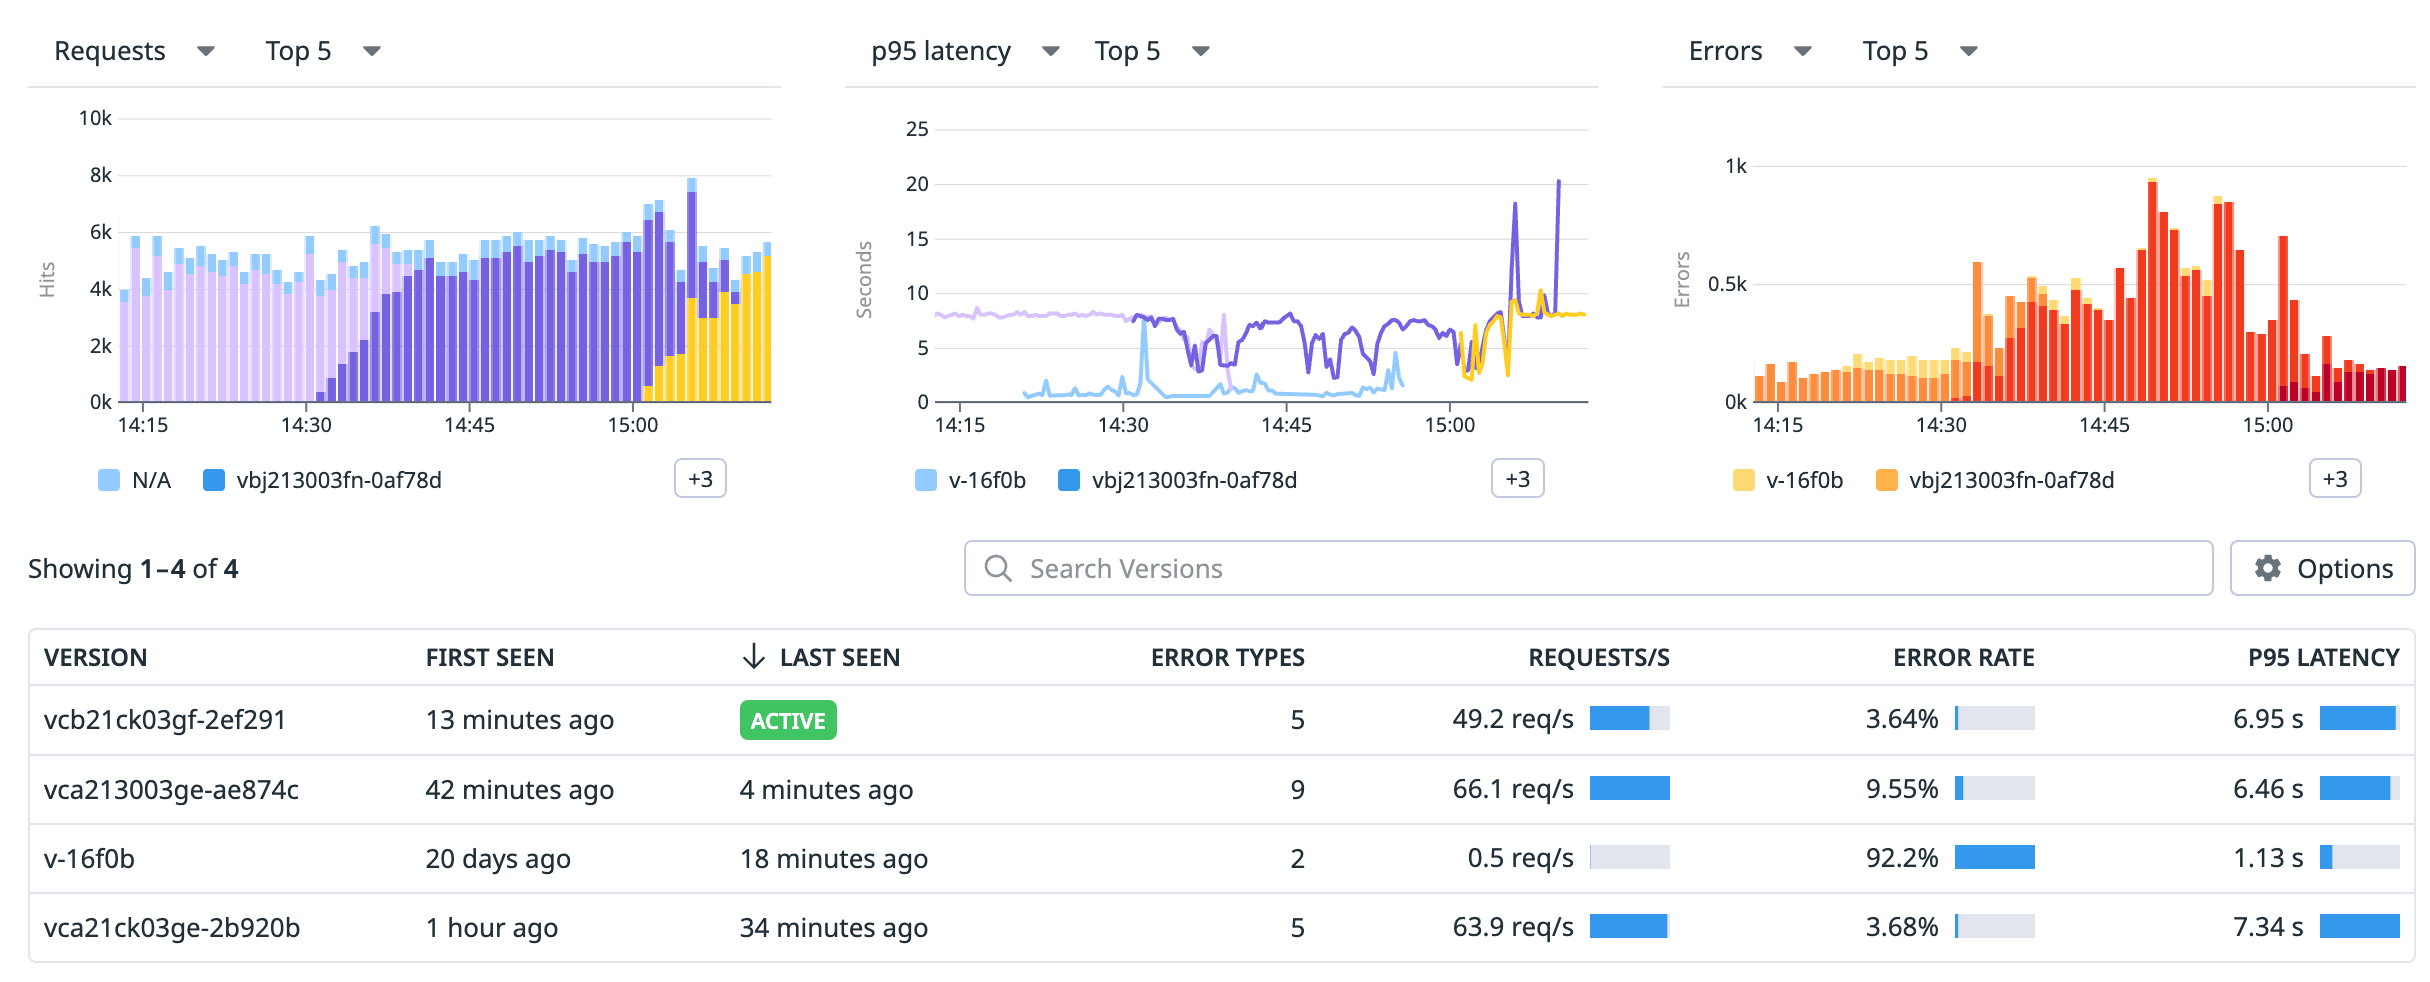
A service configured with version tags has a version section on its Service page, below the main service health graphs. The version section shows all versions of the service that were active during the selected time interval, with active services at the top.
By default you will see:
The version names deployed for this service over the timeframe.
The times at which traces that correspond to this version were first and last seen.
An Error Types indicator, which shows how many types of errors appear in each version that did not appear in the immediately previous version.
Note: This indicator shows errors that were not seen in traces from the previous version. It doesn’t mean that this version necessarily introduced these errors. Looking into new error types can be a great way to begin investigating errors.
Requests per second.
Error rate as a percentage of total requests.
You can add columns to or remove columns from this overview table and your selections will be saved. The additional available columns are:
- Endpoints that are active in a version that were not in the previous version.
- Time active, showing the length of time from the first trace to the last trace sent to Datadog for that version.
- Total number of Requests.
- Total number of Errors.
- Latency measured by p50, p75, p90, p95, p99, or max.
Note: The version section appears only if there is more than one version reporting during the time interval that is selected at the top of the page.
Deployment comparison
Click on any version row in the version summary table to open a version comparison page, allowing you to compare two versions of the same service. By default, the selected version will be compared to the immediately previous version but you can change it to compare any two versions within the past 30 days.
You can find the following information on version comparison page:
- Comparison Graphs: A visualization of requests and errors to services, useful for watching various types of deployments.
- Error Comparison: Errors that may have been introduced or solved by a version.
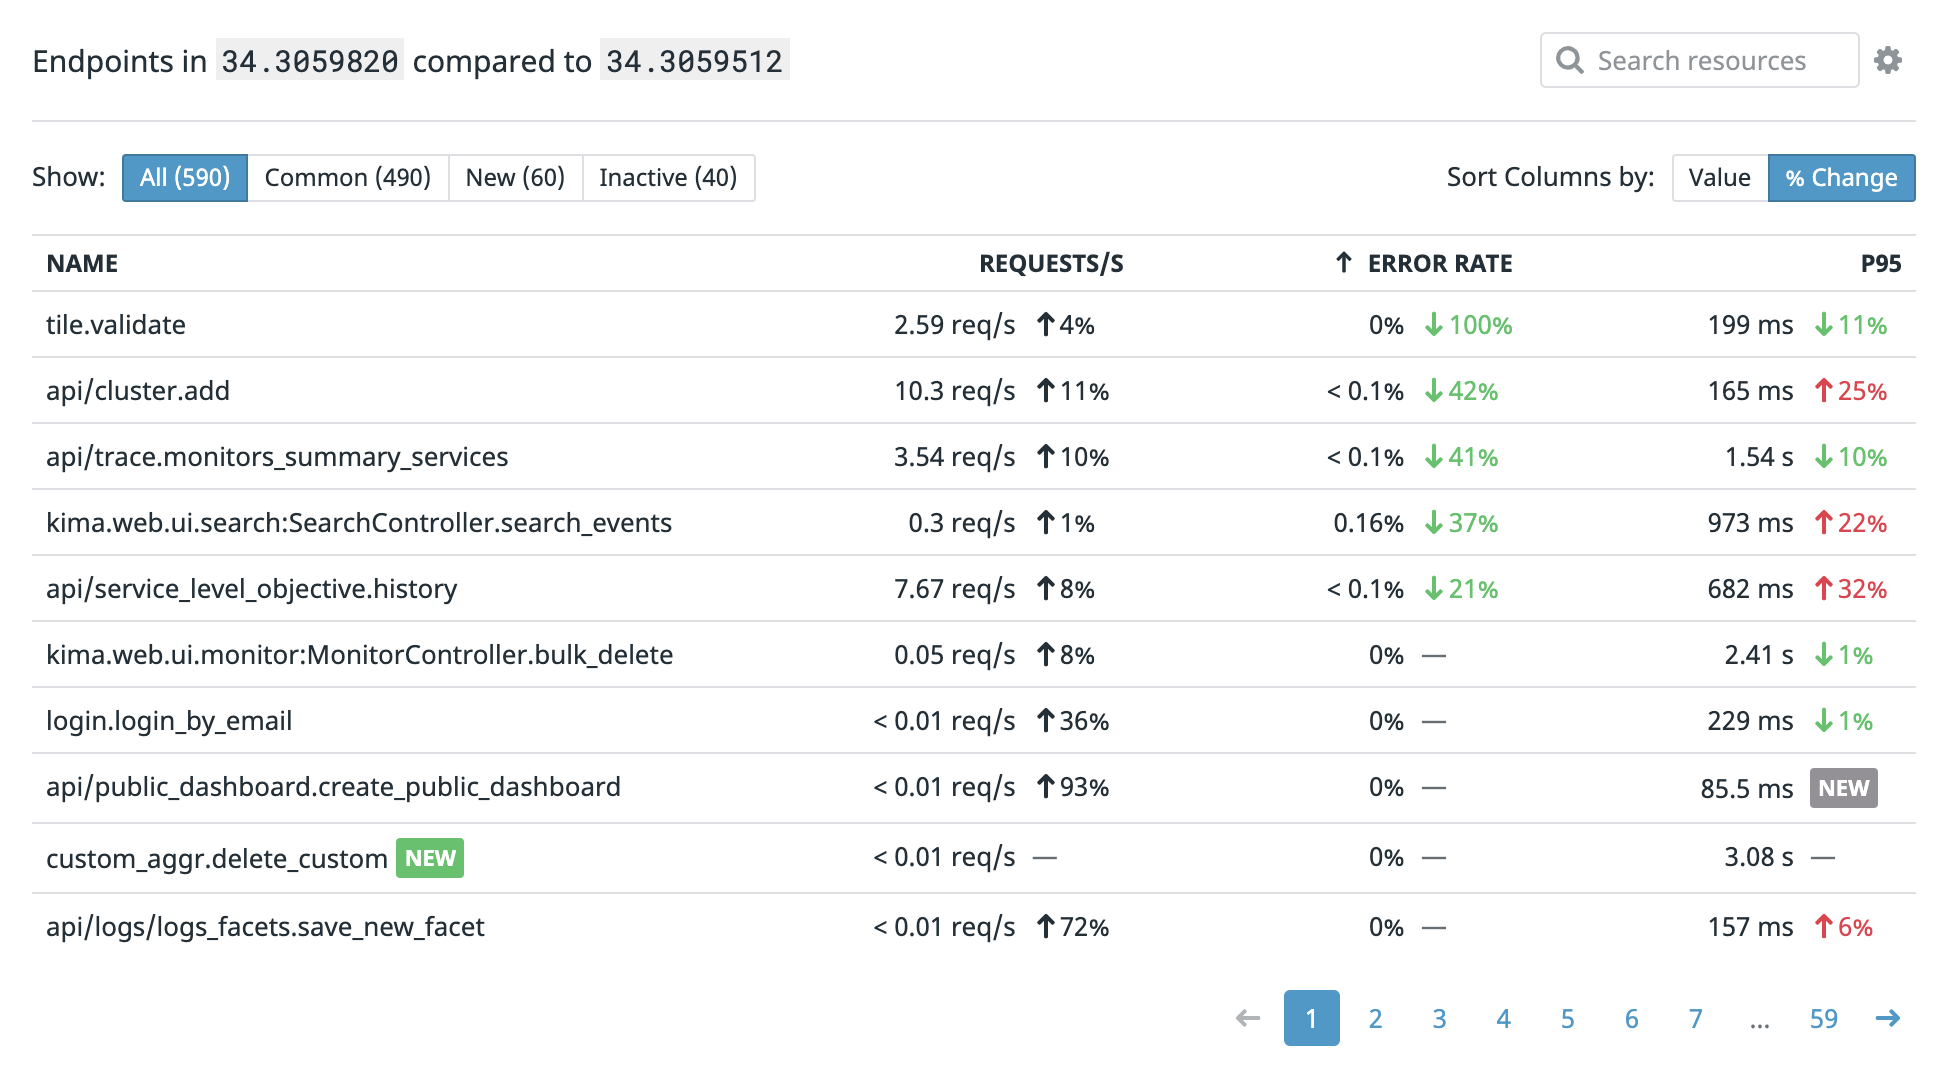
- Endpoint Comparison: How endpoint latency and error rates perform in each version.
Comparison graphs
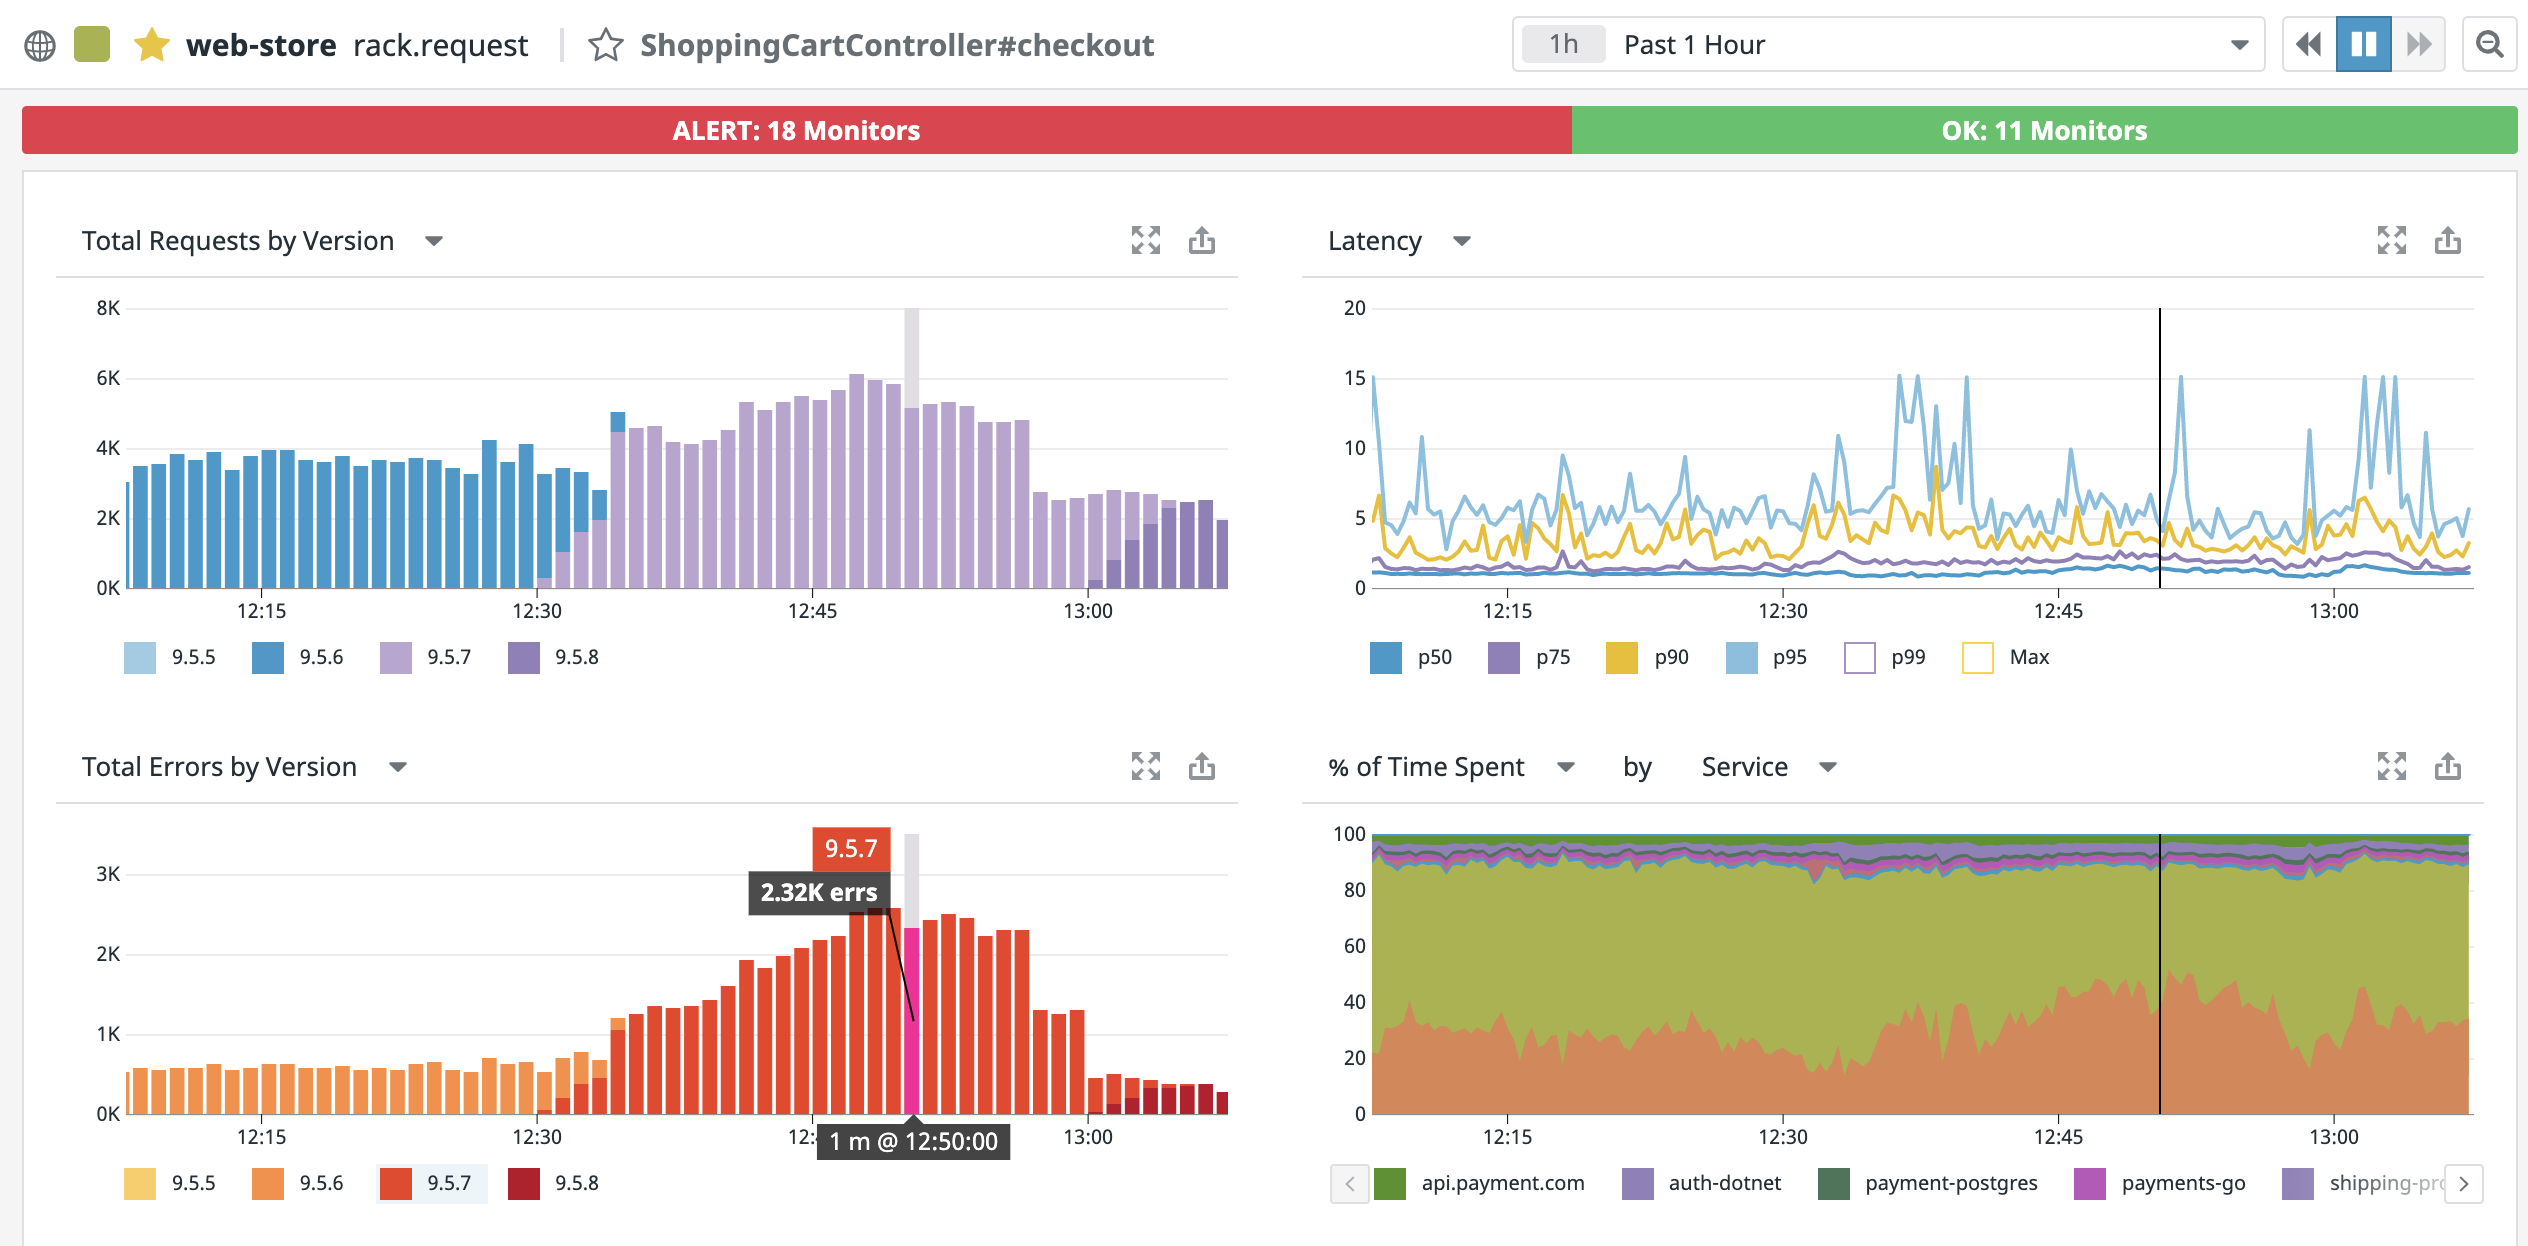
Similar to the graphs on the Service page, Requests and Errors graphs show an overview of a deployment rollout or spikes in error rates. On this page, the graphs highlight the selected versions for comparison and leave all other versions in gray for additional context.
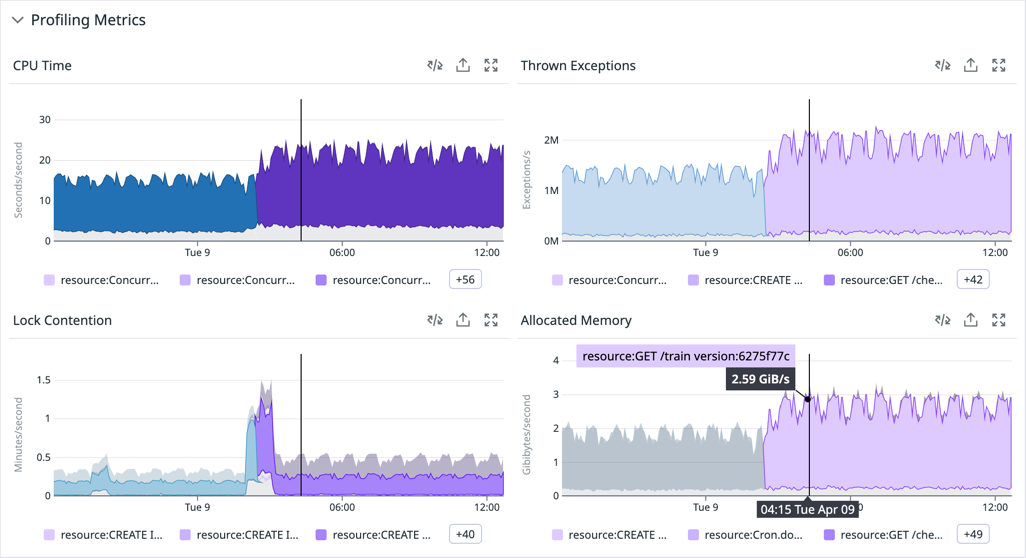
If Continuous Profiler is enabled, you also see comparisons of key performance metrics, such as CPU Time or Allocated Memory, broken down per APM resource. From there, you can pivot to the Profile Comparison Page:
Error comparison
This section lists differences in error types detected for each the two versions, highlighting:
- Error types appearing only in the source version, useful for troubleshooting it;
- Error types no longer appearing in the source version, useful for validating fixes; and
- Error types active in both.
From this table, you can pivot into live or historical traces corresponding to the selected error for further investigation.
Note: Error comparison is based on observed error types. If an error type is rare, it might be listed as no longer appearing only because it has not been seen yet.
Endpoint comparison
This section lets you compare the performance (requests, latency, and errors) of each endpoint in the service. Sort the table by Value to validate that the highest-throughput endpoints are still healthy following a deploy, or by % Change to spot large changes in latency or error rates.
Deployment strategies
Datadog’s deployment tracking gives you visibility into the performance of deployed code when you are using the following deployment strategies (or others) to detect bad code deployments, contain the impact of changes, and respond faster to incidents.
Rolling deploys
Rolling deploys provide zero-downtime by directing traffic to other instances while deploying a new version to hosts or containers one-by-one.
Using Datadog, you can monitor your rolling deploys and detect any resulting error increases.
Blue and green deploys
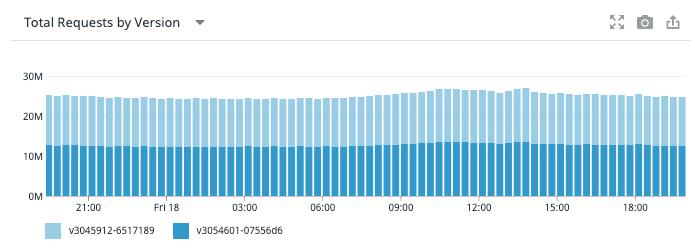
Blue and green (or other color combination) deployments reduce downtime by running two clusters of services that are both accepting traffic, or by keeping one on standby, ready to be activated if there are problems with the other.
Setting and viewing the version tags for these services lets you compare requests and errors to detect if one of the clusters has an error rate higher than the other cluster, if a cluster is not meeting SLOs, or if a cluster that is not supposed to be receiving traffic is.
Canary deploys
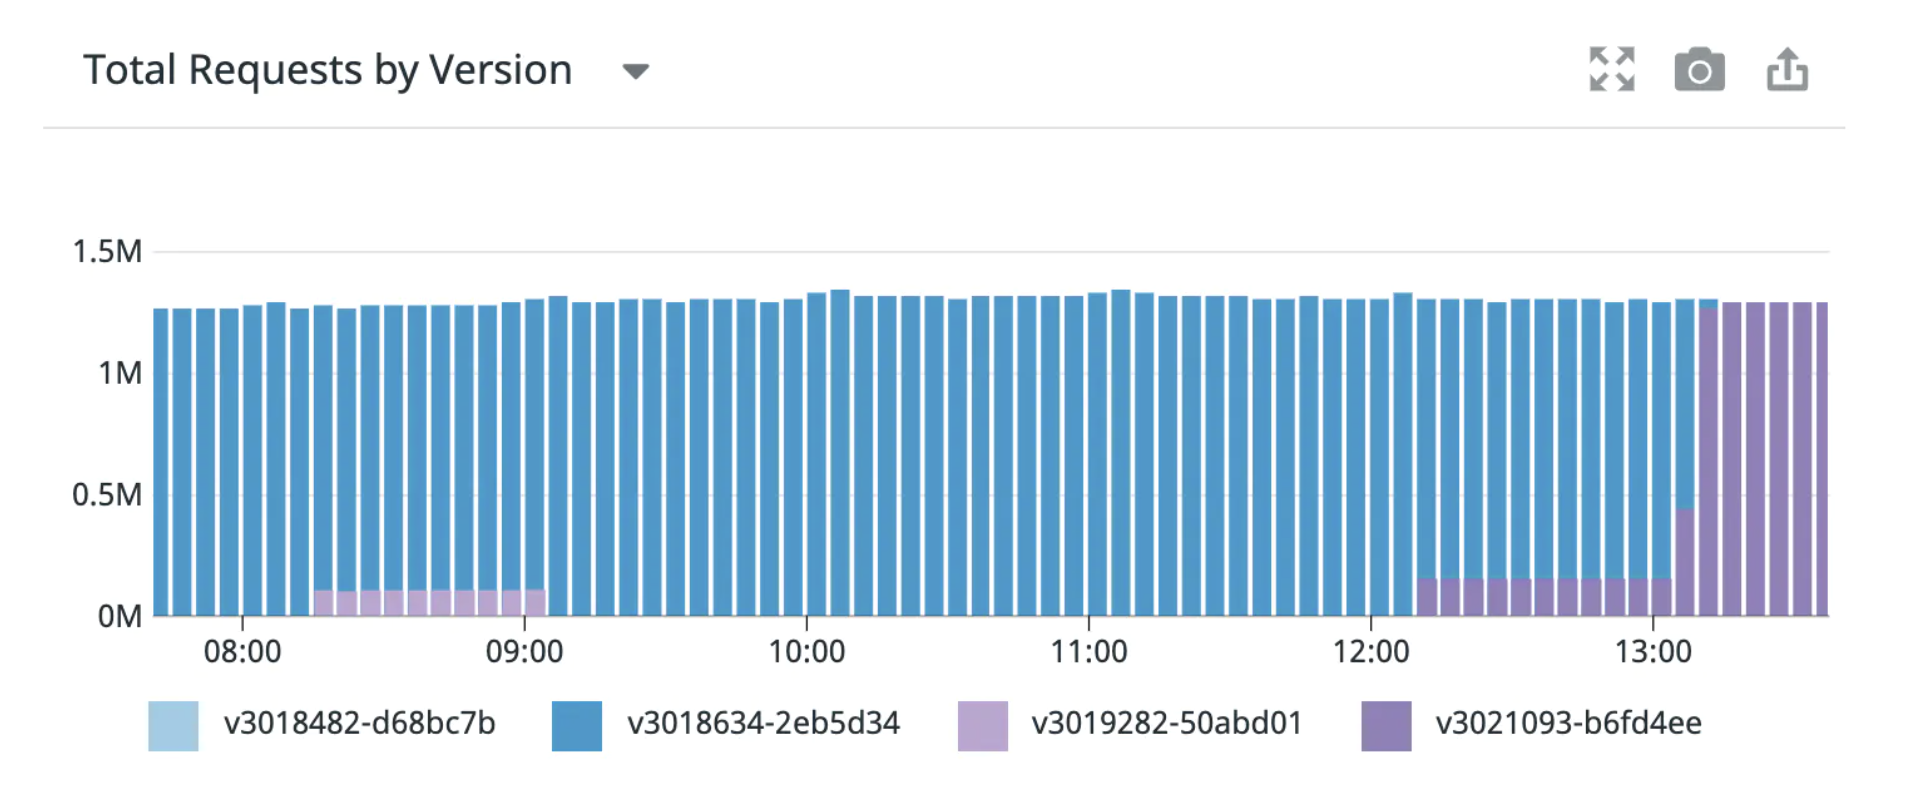
With canary deploys, a service is deployed on a limited number of hosts or for a fraction of customers, to test a new deployment with limited impact.
Using version tags within Datadog allows you to compare error rates, traces, and service behavior for the canary deployment.
For example, you can see in the following image that a canary version was deployed, had a few errors, and was removed, with traces corresponding to that version available for investigation without any further impact.
Shadow deploys
In a shadow deployment, a release candidate version is deployed alongside the production version, and incoming traffic is sent to both services, with users seeing the results only from production, but letting you collect data from both.
Shadow deploys allow you to test a potential release against real production traffic. Tagging shadows with a version tag lets you compare error rates, traces, and service behavior between the two versions to determine if the shadow version should be released.
Using version tags elsewhere within Datadog
The version tag can be used anywhere within Datadog, whether to filter a search view to a specific version, or to compare metrics from different versions.
Resource page
On the Resource page, if the version tag is available, the requests widget can be scoped to either of:
- Total Requests by Version
- Requests per second by Version
The errors widget can be scoped to one of three options that involve the version tag:
- Total Errors by Version
- Errors per second by Version
- % Error rate by Version
All of these can be exported to dashboards and monitors.
Trace search and analytics
When available, version can be used as a tag for both Trace Search and Analytics, either to filter the live search mode and indexed traces, or to filter or group analytics queries.
Analytics, including filtering on the version tag, can be exported to dashboards and monitors.
Profiles by version
You can search for profiles that correspond to a particular version. You can also click View Profiles on the top right of the Deployment Comparison page to open the Continuous Profiler scoped to either version being compared.
The time between deployments metric
Every time a new deployment of a service is detected, Deployment Tracking calculates a value for the time_between_deployments metric, calculated as the duration in seconds between the new deployment and the deployment of the most recent version prior to that.
Metric definition
datadog.service.time_between_deployments{env, service, second_primary_tag}- Prerequisite: This metric exists for any APM service with version tagging enabled through Unified Service Tagging.
Description: The time in seconds elapsed between a deployment of a service and the deployment of the most recent version prior to that.
Metric type: Distribution
Tags: The metric is tagged with the service’senv,service, and second primary tag.
Examples
If you have a service that deploys version A at time = 0 and version B at time = 10, then the value of the metric datadog.service.time_between_deployments is 10:
- Time = 0
{service: foo, env: prod, cluster-name: dev-shopist, version: A}- Time = 10
{service: foo, env: prod, cluster_name: dev-shopist, version: B}- Time between deployments
datadog.service.time_between_deployments{env: prod, cluster_name: dev-shopist} = 10
If you deploy version X at time = 20 on cluster dev-shopist, version Y at time = 30 on cluster us-staging, and version Y again at time = 45 on cluster dev-shopist, the max value of the metric datadog.service.time_between_deployments for any cluster is 25 (the time of the most recent Y minus the last X):
- Time = 20
{service: foo, env: staging, cluster-name: dev-shopist, version: X}- Time = 30
{service: foo, env: staging, cluster-name: us-staging, version: Y}- Time = 45
{service: foo, env: staging, cluster-name: dev-shopist, version: Y}- Max time between deployments:
max:datadog.service.time_between_deployments{env: staging, cluster-name: *} = 25
Further Reading
Additional helpful documentation, links, and articles:
