- Agents
- Essentials
- Getting Started
- Agent
- API
- APM Tracing
- Containers
- Dashboards
- Database Monitoring
- Datadog
- Datadog Site
- DevSecOps
- Incident Management
- Integrations
- Internal Developer Portal
- Logs
- Monitors
- Notebooks
- OpenTelemetry
- Profiler
- Search
- Session Replay
- Security
- Serverless for AWS Lambda
- Software Delivery
- Synthetic Monitoring and Testing
- Tags
- Workflow Automation
- Learning Center
- Support
- Glossary
- Standard Attributes
- Guides
- Agent
- Integrations
- Extend Datadog
- Authorization
- DogStatsD
- Custom Checks
- Integrations
- Build an Integration with Datadog
- Create an Agent-based Integration
- Create an API-based Integration
- Create a Log Pipeline
- Integration Assets Reference
- Build a Marketplace Offering
- Create an Integration Dashboard
- Create a Monitor Template
- Create a Cloud SIEM Detection Rule
- Install Agent Integration Developer Tool
- Service Checks
- Community
- Guides
- OpenTelemetry
- Administrator's Guide
- API
- Partners
- Datadog Mobile App
- DDSQL Reference
- CoScreen
- CoTerm
- Remote Configuration
- Cloudcraft (Standalone)
- In The App
- Dashboards
- Notebooks
- DDSQL Editor
- Reference Tables
- Sheets
- Monitors and Alerting
- Service Level Objectives
- Metrics
- Watchdog
- Bits AI
- Internal Developer Portal
- Error Tracking
- Change Tracking
- Event Management
- Incident Response
- Actions & Remediations
- Infrastructure
- Cloudcraft
- Resource Catalog
- Universal Service Monitoring
- End User Device Monitoring
- Hosts
- Containers
- Processes
- Serverless
- Network Monitoring
- Storage Management
- Cloud Cost
- Application Performance
- APM
- Continuous Profiler
- Database Monitoring
- Agent Integration Overhead
- Setup Architectures
- Setting Up Postgres
- Setting Up MySQL
- Setting Up SQL Server
- Setting Up Oracle
- Setting Up Amazon DocumentDB
- Setting Up MongoDB
- Setting Up ClickHouse
- Connecting DBM and Traces
- Data Collected
- Exploring Database Hosts
- Exploring Query Metrics
- Exploring Query Samples
- Exploring Database Schemas
- Exploring Recommendations
- Troubleshooting
- Guides
- Data Streams Monitoring
- Data Observability
- Digital Experience
- Real User Monitoring
- Synthetic Testing and Monitoring
- Continuous Testing
- Experiments
- Product Analytics
- Session Replay
- Software Delivery
- CI Visibility
- CD Visibility
- Deployment Gates
- Test Optimization
- Code Coverage
- PR Gates
- DORA Metrics
- Feature Flags
- Developer Integrations
- Security
- Security Overview
- Cloud SIEM
- Code Security
- Cloud Security
- App and API Protection
- AI Guard
- Workload Protection
- Sensitive Data Scanner
- AI Observability
- Log Management
- Observability Pipelines
- Configuration
- Sources
- Processors
- Destinations
- Packs
- Akamai CDN
- Amazon CloudFront
- Amazon VPC Flow Logs
- AWS Application Load Balancer Logs
- AWS CloudTrail
- AWS Elastic Load Balancer Logs
- AWS Network Load Balancer Logs
- Cisco ASA
- Cloudflare
- F5
- Fastly
- Fortinet Firewall
- HAProxy Ingress
- Istio Proxy
- Juniper SRX Firewall Traffic Logs
- Netskope
- NGINX
- Okta
- Palo Alto Firewall
- Windows XML
- ZScaler ZIA DNS
- Zscaler ZIA Firewall
- Zscaler ZIA Tunnel
- Zscaler ZIA Web Logs
- Search Syntax
- Scaling and Performance
- Monitoring and Troubleshooting
- Guides and Resources
- Log Management
- CloudPrem
- Administration
Setting Up APM with C++
Overview
This guide expands on the C++ APM docs to provide step-by-step instructions on how to set up a simple C++ app with APM on your VM for troubleshooting.
Setting up your box
Basic environment
First, spin up a fresh ubuntu/jammy64 Vagrant box and ssh into it with:
vagrant init ubuntu/jammy64
vagrant up
vagrant ssh
Next, install the agent with the instructions in the UI.
Prepping for C++
Install g++ and cmake with:
sudo apt-get update
sudo apt-get -y install g++ cmake
Download and install dd-trace-cpp library with:
wget https://github.com/DataDog/dd-trace-cpp/archive/v1.0.0.tar.gz -O dd-trace-cpp.tar.gz
If you get a rate limited message from GitHub, wait a few minutes and run the command again.
After downloading the tar file, unzip it:
mkdir dd-trace-cpp
tar zxvf dd-trace-cpp.tar.gz -C ./dd-trace-cpp/ --strip-components=1
Finally, build and install the library:
cd dd-trace-cpp
cmake -B build -DCMAKE_BUILD_TYPE=Release .
cmake --build build -j
cmake --install build
Building a simple app
Create a new file called tracer_example.cpp and populate it with the below code:
#include <datadog/tracer.h>
#include <datadog/span_config.h>
#include <iostream>
#include <string>

int main(int argc, char* argv[]) {
  datadog::tracing::TracerConfig tracer_config;
  tracer_config.service = "compiled-in example";

  const auto validated_config = dd::finalize_config(tracer_config);
  if (!validated_config) {
    std::cerr << validated_config.error() << '\n';
    return 1;
  }

  dd::Tracer tracer{*validated_config};

  // Create some spans.
  {
    datadog::tracing::SpanConfig options;
    options.name = "A";
    options.tags.emplace("tag", "123");
    auto span_a = tracer.create_span(options);

    auto span_b = span_a.create_child();
    span_b.set_name("B");
    span_b.set_tag("tag", "value");
  }

  return 0;
}
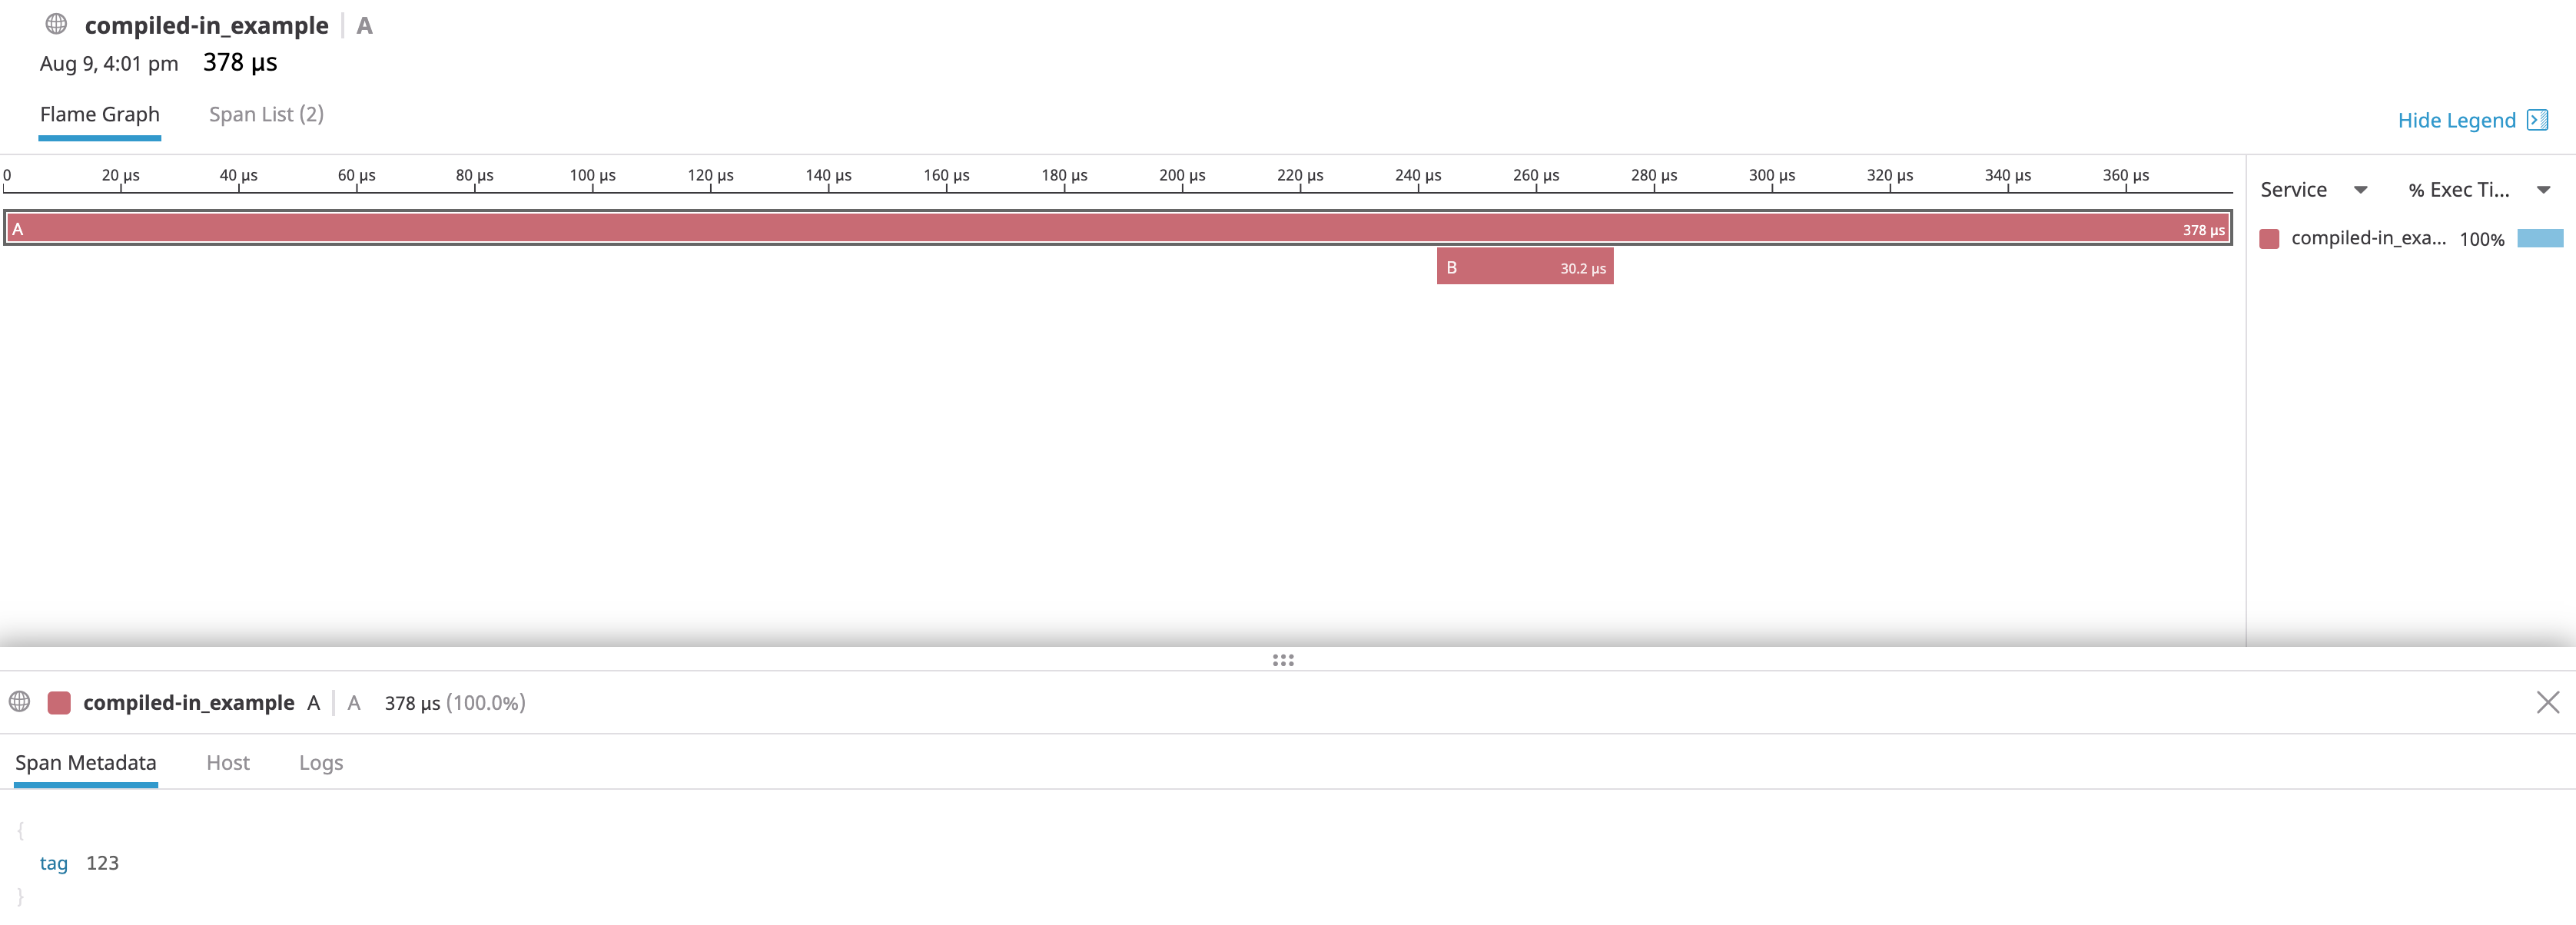
This creates a tracer that generates two spans, a parent span span_a and a child span span_b, and tags them.
Then, compile and link against libdd_trace_cpp with:
g++ -std=c++17 -o tracer_example tracer_example.cpp -ldd_trace_cpp-static -lcurl
Finally, run the app with:
./tracer_example
Sending traces
Now that an app exists, you can start sending traces and see the Trace Agent in action.
First, tail the Trace Agent log with:
tail -f /var/log/datadog/trace-agent.log
Next, open a new tab and run the example a couple times:
./tracer_example
On the Trace Agent tab, you will see something similar to:
2019-08-09 20:02:26 UTC | TRACE | INFO | (pkg/trace/info/stats.go:108 in LogStats) | [lang:cpp lang_version:201402 tracer_version:0.2.0] -> traces received: 1, traces filtered: 0, traces amount: 363 bytes, events extracted: 0, events sampled: 0
The service then shows up in the Software Catalog in Datadog.
Click on the service to view your traces.
Further Reading
Additional helpful documentation, links, and articles:


