- Agents
- Essentials
- Getting Started
- Agent
- API
- APM Tracing
- Containers
- Dashboards
- Database Monitoring
- Datadog
- Datadog Site
- DevSecOps
- Incident Management
- Integrations
- Internal Developer Portal
- Logs
- Monitors
- Notebooks
- OpenTelemetry
- Profiler
- Search
- Session Replay
- Security
- Serverless for AWS Lambda
- Software Delivery
- Synthetic Monitoring and Testing
- Tags
- Workflow Automation
- Learning Center
- Support
- Glossary
- Standard Attributes
- Guides
- Agent
- Integrations
- Extend Datadog
- Authorization
- DogStatsD
- Custom Checks
- Integrations
- Build an Integration with Datadog
- Create an Agent-based Integration
- Create an API-based Integration
- Create a Log Pipeline
- Integration Assets Reference
- Build a Marketplace Offering
- Create an Integration Dashboard
- Create a Monitor Template
- Create a Cloud SIEM Detection Rule
- Install Agent Integration Developer Tool
- Service Checks
- Community
- Guides
- OpenTelemetry
- Administrator's Guide
- API
- Partners
- Datadog Mobile App
- DDSQL Reference
- CoScreen
- CoTerm
- Remote Configuration
- Cloudcraft (Standalone)
- In The App
- Dashboards
- Notebooks
- DDSQL Editor
- Reference Tables
- Sheets
- Monitors and Alerting
- Service Level Objectives
- Metrics
- Watchdog
- Bits AI
- Internal Developer Portal
- Error Tracking
- Change Tracking
- Event Management
- Incident Response
- Actions & Remediations
- Infrastructure
- Cloudcraft
- Resource Catalog
- Universal Service Monitoring
- End User Device Monitoring
- Hosts
- Containers
- Processes
- Serverless
- Network Monitoring
- Storage Management
- Cloud Cost
- Application Performance
- APM
- Continuous Profiler
- Database Monitoring
- Agent Integration Overhead
- Setup Architectures
- Setting Up Postgres
- Setting Up MySQL
- Setting Up SQL Server
- Setting Up Oracle
- Setting Up Amazon DocumentDB
- Setting Up MongoDB
- Setting Up ClickHouse
- Connecting DBM and Traces
- Data Collected
- Exploring Database Hosts
- Exploring Query Metrics
- Exploring Query Samples
- Exploring Database Schemas
- Exploring Recommendations
- Troubleshooting
- Guides
- Data Streams Monitoring
- Data Observability
- Digital Experience
- Real User Monitoring
- Synthetic Testing and Monitoring
- Continuous Testing
- Experiments
- Product Analytics
- Session Replay
- Software Delivery
- CI Visibility
- CD Visibility
- Deployment Gates
- Test Optimization
- Code Coverage
- PR Gates
- DORA Metrics
- Feature Flags
- Developer Integrations
- Security
- Security Overview
- Cloud SIEM
- Code Security
- Cloud Security
- App and API Protection
- AI Guard
- Workload Protection
- Sensitive Data Scanner
- AI Observability
- Log Management
- Observability Pipelines
- Configuration
- Sources
- Processors
- Destinations
- Packs
- Akamai CDN
- Amazon CloudFront
- Amazon VPC Flow Logs
- AWS Application Load Balancer Logs
- AWS CloudTrail
- AWS Elastic Load Balancer Logs
- AWS Network Load Balancer Logs
- Cisco ASA
- Cloudflare
- F5
- Fastly
- Fortinet Firewall
- HAProxy Ingress
- Istio Proxy
- Juniper SRX Firewall Traffic Logs
- Netskope
- NGINX
- Okta
- Palo Alto Firewall
- Windows XML
- ZScaler ZIA DNS
- Zscaler ZIA Firewall
- Zscaler ZIA Tunnel
- Zscaler ZIA Web Logs
- Search Syntax
- Scaling and Performance
- Monitoring and Troubleshooting
- Guides and Resources
- Log Management
- CloudPrem
- Administration
- Account Management
- Data Security
- Help
Configure Apdex score by service
Apdex (Application Performance Index) is an open standard developed by an alliance of companies that defines a standardized method to report, benchmark, and track application performance. Based on user experience satisfaction by measuring the response time of web applications and services, its role is to counterbalance response time average and percentiles which can be misleading when there are extreme data points.
Definition
Apdex is a numerical measure of user satisfaction with the performance of enterprise web applications. It converts many measurements into one number on a uniform scale on the [0;1] interval:
- 0 = no users satisfied
- 1 = all users satisfied
To define your Apdex, you need to be an administrator of your Datadog account. First define a time threshold—T—separating satisfactory response times from unsatisfactory response times from your web application or service. With one threshold you can then define three categories:
- Satisfied requests have a response time below T.
- Tolerated requests have a response time equal to or above T and below or equal to 4T.
- Frustrated requests have a response time above 4T or returns an error.
Once the threshold is defined and your requests are categorized, the Apdex is defined as:
$$\bo\text"Apdex"=({\bo\text"Satisfied"\text" requests" + {{\bo\text"Tolerated"\text" requests"} / 2}})/{\bo\text"Total"\text" requests"} $$
Selecting the correct threshold is important because the Frustrated requests are 4 times slower than “normal”. If T=3 the user waits 3 seconds for a page to load but does not tolerate waiting 12 seconds.
Apdex thresholds must be set by administrators, per service, before Apdex scores calculated.
Set your Apdex for your traces
To visualize your web application or service Apdex:
In Software Catalog, hover over your web service and select Service Page.
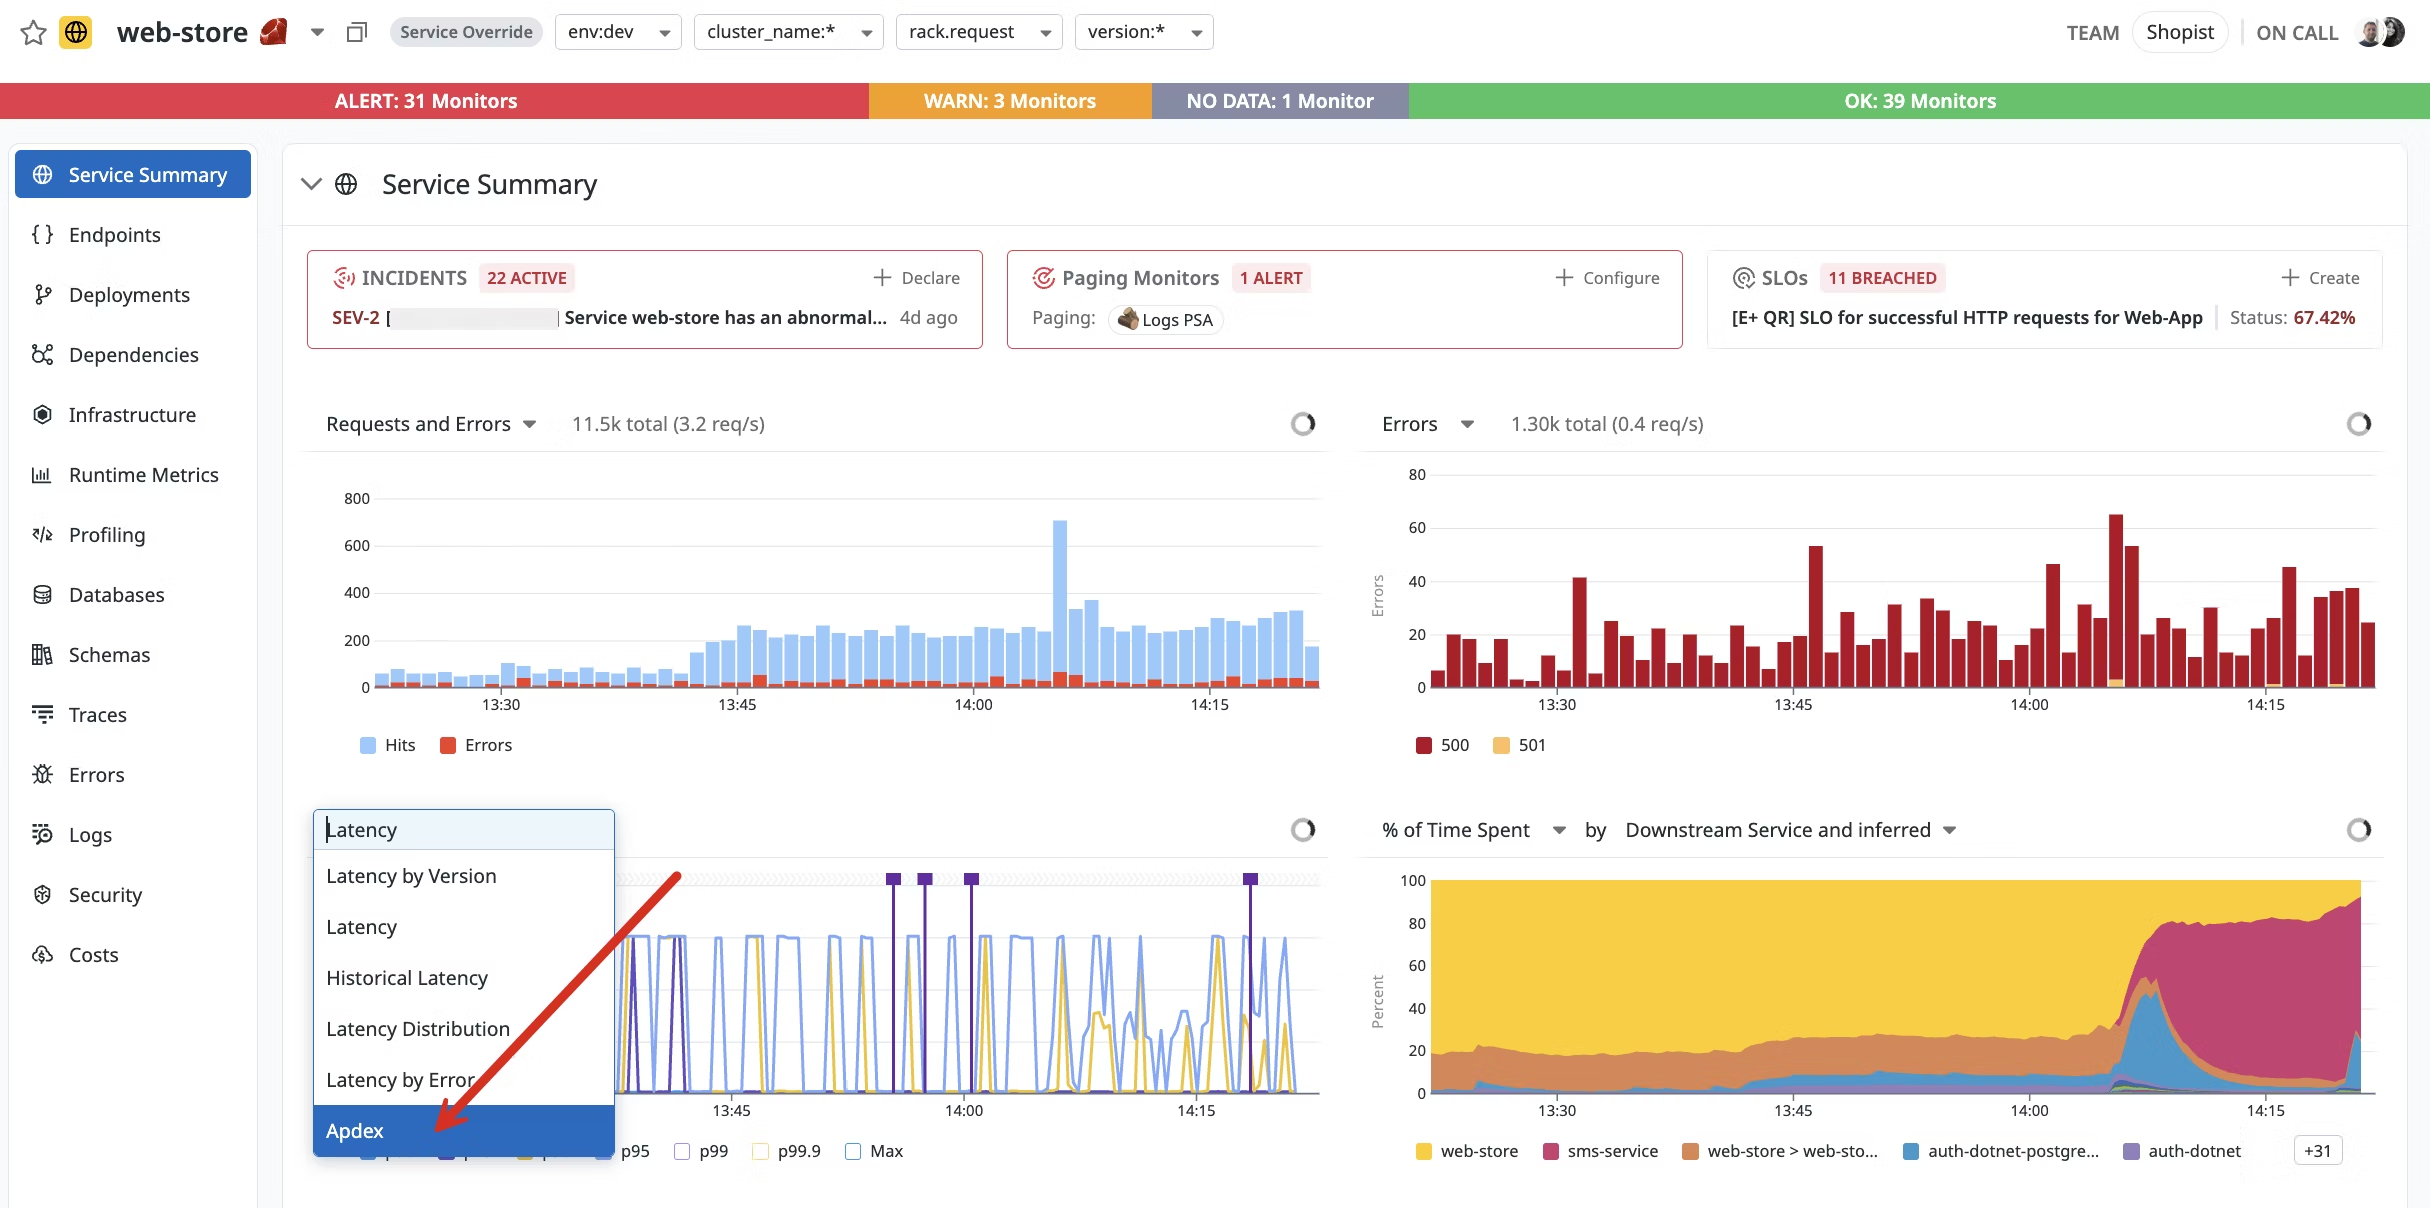
Click the Latency graph title to open a drop-down menu, and select Apdex.
Note: The Apdex option is only available for web services.
Use the pencil icon on the top left of your widget to edit your Apdex configuration.
Note: You must be an administrator to see this icon.
Enter your threshold to visualize your request distribution.
Save your widget to follow your Apdex evolution over time.
Display your Apdex on the Software Catalog
To display Apdex scores on the Software Catalog, select it in the configuration menu on the upper right corner of the page:


