Correlated Logs Are Not Showing Up In The Trace ID Panel
Overview
The trace panel contains information about the trace, host, and correlated logs.
There are four types of logs that appear in a trace:
trace_id: Display logs that have the corresponding trace ID.host: Display logs from the trace’s host within the trace’s timeframe.container_id: Display logs from the trace’s container within the trace’s timeframe.pod_name: Display logs from the trace’s pod within the trace’s timeframe.
In some cases, the Logs section in the trace panel may appear empty. This guide walks you through how to fix this issue.
Infrastructure options
If the Log section is empty for the host, container_id, or pod_name options, navigate to the Log Explorer and ensure the following conditions:
- Logs are being sent from the host/container/pod that emitted the trace.
- There are logs for that host within the trace’s timeframe.
- The logs’ timestamp is properly set. For more information, see Logs Not Showing Expected Timestamp.
Trace ID option
If the Log section is empty for the trace_id option, ensure you have a standard trace_id attribute in your logs. If your logs do not contain trace_id, correlate your traces and logs in order to do the following:
Extract the trace ID in a log attribute.
Remap this attribute to the reserved trace_id attribute.
For JSON logs, Step 1 and 2 are automatic. The tracer injects the trace and span IDs into the logs, which are automatically remapped by the reserved attribute remappers.
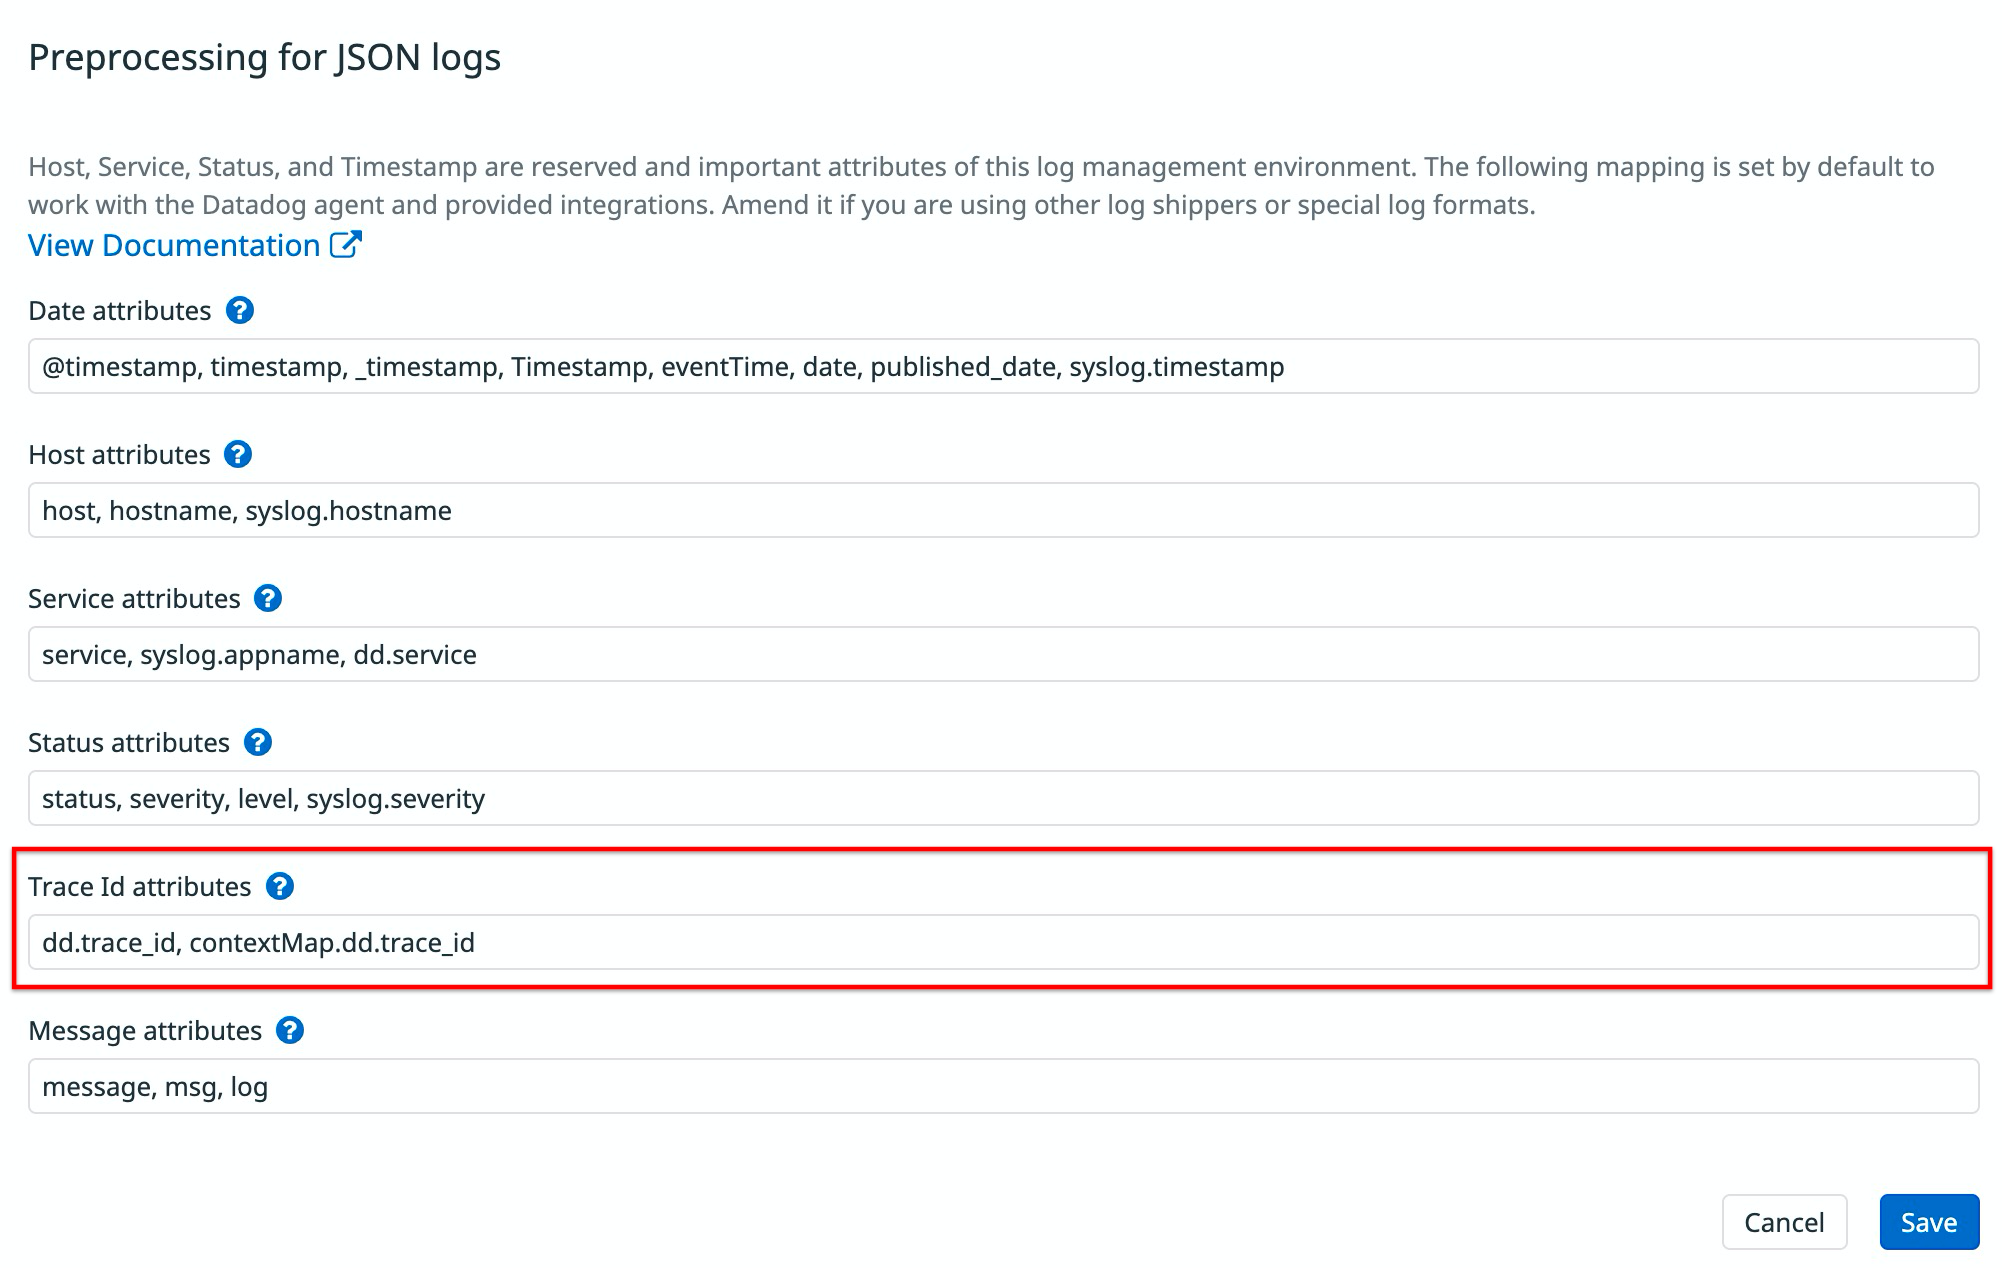
If this process is not working as expected, ensure the logs attribute’s name containing the trace ID is dd.trace_id and verify that the attribute is correctly set in the reserved attributes’ Trace ID section.
For raw logs (where you are collecting the logs using a log integration for a specific language), set the source attribute to the language, such as java, python, ruby, and more. The integration automatically correlates traces and logs.
This example demonstrates the Java integration pipeline:
It is possible that the log format is not recognized by the integration pipeline. In this case, clone the pipeline and follow the parsing troubleshooting guide to make sure the pipeline accepts the log format.
For raw logs where you aren’t using an integration to collect the logs:
Make sure that the custom parsing rule extracts the trace and span IDs as a string, like in the following example:
Then define a Trace remapper on the extracted attribute to remap it to the official trace ID of the logs.
Once the IDs are properly injected and remapped to your logs, you can see the logs correlated to the trace in the trace panel.
Note: Trace IDs and span IDs are not displayed in your logs or log attributes in the UI.
Further Reading
Additional helpful documentation, links, and articles: