- Essentials
- Getting Started
- Agent
- API
- APM Tracing
- Containers
- Dashboards
- Database Monitoring
- Datadog
- Datadog Site
- DevSecOps
- Incident Management
- Integrations
- Internal Developer Portal
- Logs
- Monitors
- OpenTelemetry
- Profiler
- Session Replay
- Security
- Serverless for AWS Lambda
- Software Delivery
- Synthetic Monitoring and Testing
- Tags
- Workflow Automation
- Learning Center
- Support
- Glossary
- Standard Attributes
- Guides
- Agent
- Integrations
- Developers
- Authorization
- DogStatsD
- Custom Checks
- Integrations
- Create an Agent-based Integration
- Create an API Integration
- Create a Log Pipeline
- Integration Assets Reference
- Build a Marketplace Offering
- Create a Tile
- Create an Integration Dashboard
- Create a Monitor Template
- Create a Cloud SIEM Detection Rule
- OAuth for Integrations
- Install Agent Integration Developer Tool
- Service Checks
- IDE Plugins
- Community
- Guides
- OpenTelemetry
- Administrator's Guide
- API
- Partners
- Datadog Mobile App
- DDSQL Reference
- CoScreen
- CoTerm
- Cloudcraft (Standalone)
- In The App
- Dashboards
- Notebooks
- DDSQL Editor
- Reference Tables
- Sheets
- Monitors and Alerting
- Metrics
- Watchdog
- Bits AI
- Internal Developer Portal
- Error Tracking
- Change Tracking
- Service Management
- Actions & Remediations
- Infrastructure
- Cloudcraft
- Resource Catalog
- Universal Service Monitoring
- Hosts
- Containers
- Processes
- Serverless
- Network Monitoring
- Cloud Cost
- Application Performance
- APM
- APM Terms and Concepts
- Application Instrumentation
- APM Metrics Collection
- Trace Pipeline Configuration
- Correlate Traces with Other Telemetry
- Trace Explorer
- Recommendations
- Code Origins for Spans
- Service Observability
- Endpoint Observability
- Dynamic Instrumentation
- Live Debugger
- Error Tracking
- Data Security
- Guides
- Troubleshooting
- Continuous Profiler
- Database Monitoring
- Agent Integration Overhead
- Setup Architectures
- Setting Up Postgres
- Setting Up MySQL
- Setting Up SQL Server
- Setting Up Oracle
- Setting Up Amazon DocumentDB
- Setting Up MongoDB
- Connecting DBM and Traces
- Data Collected
- Exploring Database Hosts
- Exploring Query Metrics
- Exploring Query Samples
- Exploring Database Schemas
- Exploring Recommendations
- Troubleshooting
- Guides
- Data Streams Monitoring
- Data Jobs Monitoring
- Data Observability
- Digital Experience
- Real User Monitoring
- Synthetic Testing and Monitoring
- Continuous Testing
- Product Analytics
- Software Delivery
- CI Visibility
- CD Visibility
- Deployment Gates
- Test Optimization
- Quality Gates
- DORA Metrics
- Security
- Security Overview
- Cloud SIEM
- Code Security
- Cloud Security
- App and API Protection
- Workload Protection
- Sensitive Data Scanner
- AI Observability
- Log Management
- Observability Pipelines
- Log Management
- Administration
Datadog Clipboard
Overview
The Datadog Clipboard is a cross-platform tool for collecting and sharing signals across contexts. It is personal to each user and stores all copied graphs alongside any saved links. Signals can be grouped and exported to a dashboard, notebook, or incident.
Cross-page exploration
The Clipboard works on all pages in Datadog and keeps a record of all graphs copied by an individual user. The Clipboard does not automatically copy query text, event JSON, or other text-based content.
Opening the Clipboard
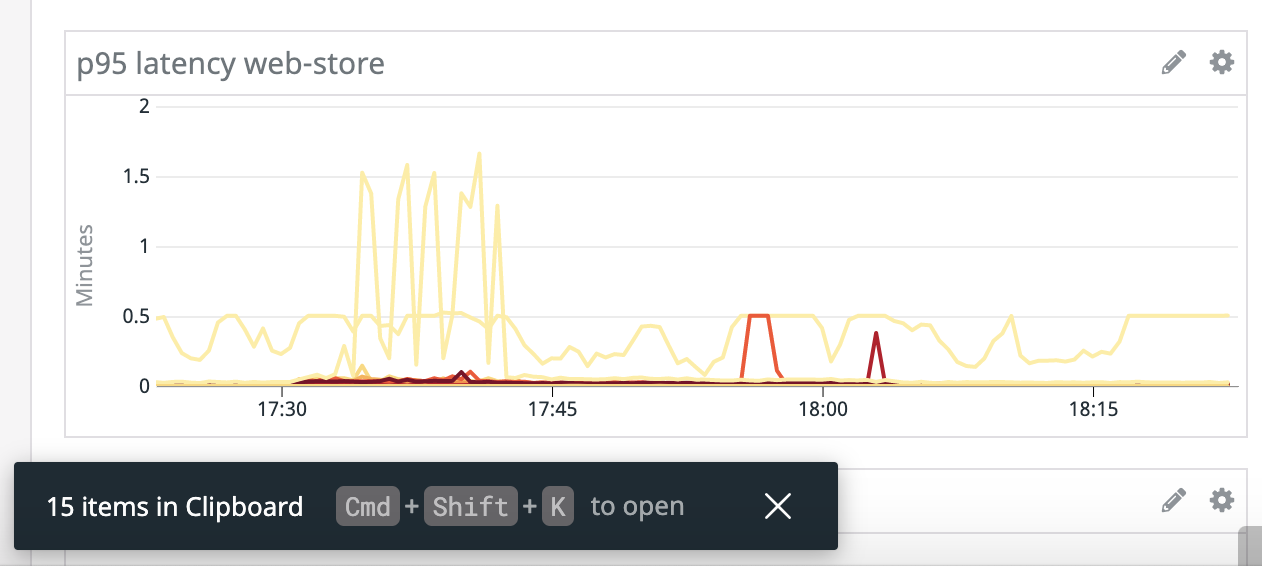
To open the Clipboard, copy any graph and click Open Clipboard in the popup.
Or, click “Cmd/Ctrl + Shift + K to open” on the minimized Clipboard.
The Clipboard can also be opened and closed using Cmd/Ctrl + Shift + K. To minimize the Clipboard, click the Minimize icon. The minimized Clipboard persists on all pages of Datadog.
Adding clips
To add a graph, copy it with Cmd/Ctrl + C or click Copy in the export menu. Once the Clipboard is open, copied graphs get added automatically.
To add a URL, open the Clipboard and click Add current page.
Managing clips
Each item in the Clipboard can be opened, cloned, or deleted; these options are available when you hover over any signal. Opening an item navigates to the link of the original signal. Open the source of any graph (like the dashboard it was clipped from) by clicking the title of the item.
The Clipboard holds a maximum of 20 signals. Remove signals by deleting them individually, or by clicking Remove All. If more than 20 signals are added, the oldest signals, stored furthest to the left, are removed automatically.
Exporting
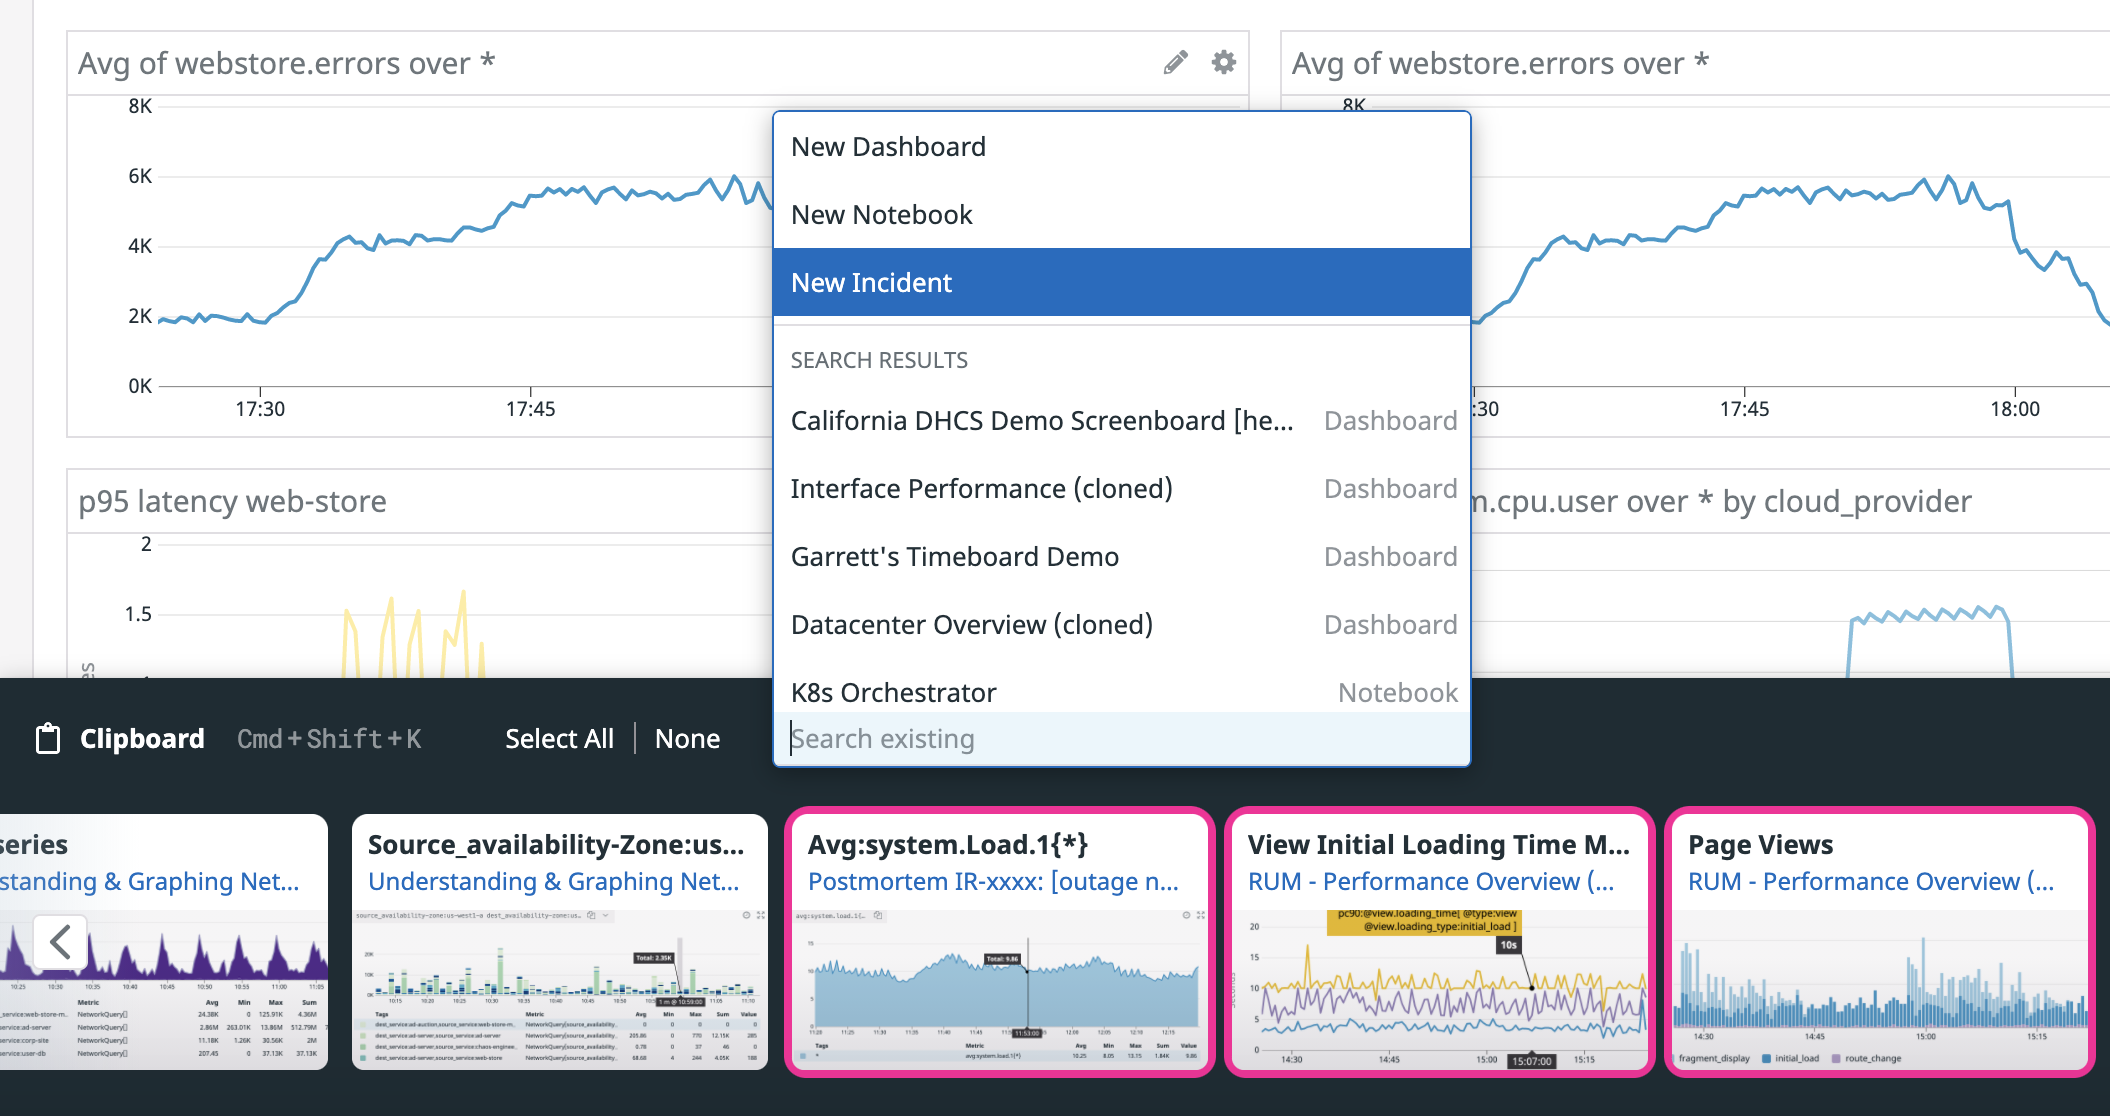
Items on the Clipboard can be exported to Dashboards, Notebooks, or Incidents using keyboard shortcuts or the export menu. To copy an individual signal, hover over it and use Cmd/Ctrl + C to copy, and paste it into a dashboard or notebook with Cmd/Ctrl + V. To copy multiple signals, use Shift + Click to select graphs and links, and use Cmd/Ctrl + C to copy them.
Alternatively, export your selection to a new or existing dashboard, notebook, or incident using the export menu. Only supported graphs can be exported to Notebooks.
Further Reading
Additional helpful documentation, links, and articles:


