- Agents
- Essentials
- Getting Started
- Agent
- API
- APM Tracing
- Containers
- Dashboards
- Database Monitoring
- Datadog
- Datadog Site
- DevSecOps
- Incident Management
- Integrations
- Internal Developer Portal
- Logs
- Monitors
- Notebooks
- OpenTelemetry
- Profiler
- Search
- Session Replay
- Security
- Serverless for AWS Lambda
- Software Delivery
- Synthetic Monitoring and Testing
- Tags
- Workflow Automation
- Learning Center
- Support
- Glossary
- Standard Attributes
- Guides
- Agent
- Integrations
- Extend Datadog
- Authorization
- DogStatsD
- Custom Checks
- Integrations
- Build an Integration with Datadog
- Create an Agent-based Integration
- Create an API-based Integration
- Create a Log Pipeline
- Integration Assets Reference
- Build a Marketplace Offering
- Create an Integration Dashboard
- Create a Monitor Template
- Create a Cloud SIEM Detection Rule
- Install Agent Integration Developer Tool
- Service Checks
- Community
- Guides
- OpenTelemetry
- Administrator's Guide
- API
- Partners
- Datadog Mobile App
- DDSQL Reference
- CoScreen
- CoTerm
- Remote Configuration
- Cloudcraft (Standalone)
- In The App
- Dashboards
- Notebooks
- DDSQL Editor
- Reference Tables
- Sheets
- Monitors and Alerting
- Service Level Objectives
- Metrics
- Watchdog
- Bits AI
- Internal Developer Portal
- Error Tracking
- Change Tracking
- Event Management
- Incident Response
- Actions & Remediations
- Infrastructure
- Cloudcraft
- Resource Catalog
- Universal Service Monitoring
- End User Device Monitoring
- Hosts
- Containers
- Processes
- Serverless
- Network Monitoring
- Storage Management
- Cloud Cost
- Application Performance
- APM
- Continuous Profiler
- Database Monitoring
- Agent Integration Overhead
- Setup Architectures
- Setting Up Postgres
- Setting Up MySQL
- Setting Up SQL Server
- Setting Up Oracle
- Setting Up Amazon DocumentDB
- Setting Up MongoDB
- Setting Up ClickHouse
- Connecting DBM and Traces
- Data Collected
- Exploring Database Hosts
- Exploring Query Metrics
- Exploring Query Samples
- Exploring Database Schemas
- Exploring Recommendations
- Troubleshooting
- Guides
- Data Streams Monitoring
- Data Observability
- Digital Experience
- Real User Monitoring
- Synthetic Testing and Monitoring
- Continuous Testing
- Experiments
- Product Analytics
- Session Replay
- Software Delivery
- CI Visibility
- CD Visibility
- Deployment Gates
- Test Optimization
- Code Coverage
- PR Gates
- DORA Metrics
- Feature Flags
- Developer Integrations
- Security
- Security Overview
- Cloud SIEM
- Code Security
- Cloud Security
- App and API Protection
- AI Guard
- Workload Protection
- Sensitive Data Scanner
- AI Observability
- Log Management
- Observability Pipelines
- Configuration
- Sources
- Processors
- Destinations
- Packs
- Akamai CDN
- Amazon CloudFront
- Amazon VPC Flow Logs
- AWS Application Load Balancer Logs
- AWS CloudTrail
- AWS Elastic Load Balancer Logs
- AWS Network Load Balancer Logs
- Cisco ASA
- Cloudflare
- F5
- Fastly
- Fortinet Firewall
- HAProxy Ingress
- Istio Proxy
- Juniper SRX Firewall Traffic Logs
- Netskope
- NGINX
- Okta
- Palo Alto Firewall
- Windows XML
- ZScaler ZIA DNS
- Zscaler ZIA Firewall
- Zscaler ZIA Tunnel
- Zscaler ZIA Web Logs
- Search Syntax
- Scaling and Performance
- Monitoring and Troubleshooting
- Guides and Resources
- Log Management
- CloudPrem
- Administration
Navigate the Explorer
Overview
The Events Explorer displays the most recent events generated by your infrastructure and services such as code deployments, service health, configuration changes, or monitoring alerts. By default, the Events Explorer displays event types. You can filter your events by facets or search queries.
Event side panel
Click any event in the Events Explorer to open the event side panel, which shows tags and messages associated with the event.
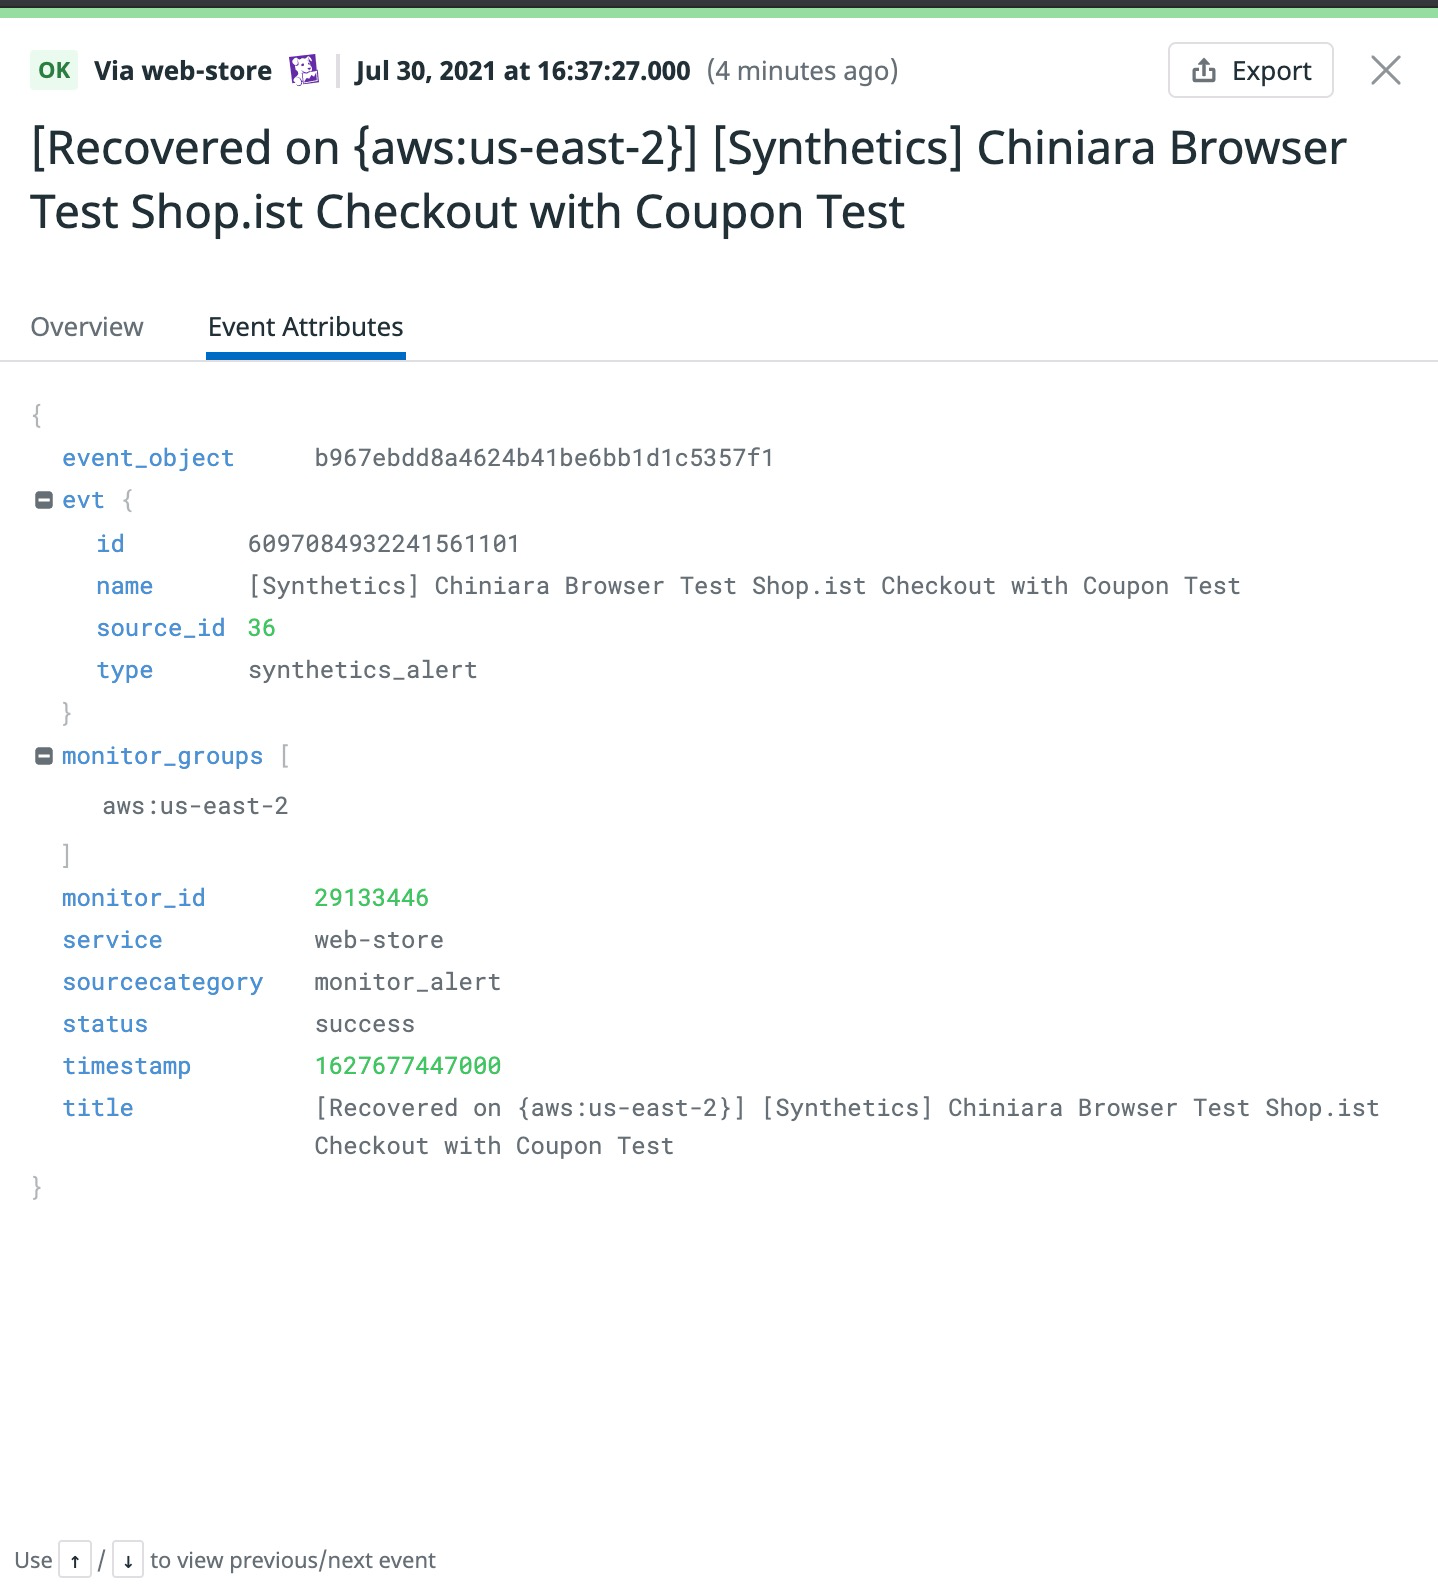
Attributes tab
The attributes tab of the side panel lists event attributes as JSON. Click an attribute to add it to or exclude it from the existing query, or to add a column for this attribute.
Events attributes can be normalized or enriched at intake with processing pipelines.
Time range
The time frame selector controls the time range of events that are shown in the Explorer or Analytics, and sets the range of the timeline under the search bar.
Change the time range by selecting a preset range from the time frame dropdown, or by entering a custom time range.
Because all search parameters are contained within the URL, you can share your view by sharing the URL.


