- Agents
- Essentials
- Getting Started
- Agent
- API
- APM Tracing
- Containers
- Dashboards
- Database Monitoring
- Datadog
- Datadog Site
- DevSecOps
- Incident Management
- Integrations
- Internal Developer Portal
- Logs
- Monitors
- Notebooks
- OpenTelemetry
- Profiler
- Search
- Session Replay
- Security
- Serverless for AWS Lambda
- Software Delivery
- Synthetic Monitoring and Testing
- Tags
- Workflow Automation
- Learning Center
- Support
- Glossary
- Standard Attributes
- Guides
- Agent
- Integrations
- Extend Datadog
- Authorization
- DogStatsD
- Custom Checks
- Integrations
- Build an Integration with Datadog
- Create an Agent-based Integration
- Create an API-based Integration
- Create a Log Pipeline
- Integration Assets Reference
- Build a Marketplace Offering
- Create an Integration Dashboard
- Create a Monitor Template
- Create a Cloud SIEM Detection Rule
- Install Agent Integration Developer Tool
- Service Checks
- Community
- Guides
- OpenTelemetry
- Administrator's Guide
- API
- Partners
- Datadog Mobile App
- DDSQL Reference
- CoScreen
- CoTerm
- Remote Configuration
- Cloudcraft (Standalone)
- In The App
- Dashboards
- Notebooks
- DDSQL Editor
- Reference Tables
- Sheets
- Monitors and Alerting
- Service Level Objectives
- Metrics
- Watchdog
- Bits AI
- Internal Developer Portal
- Error Tracking
- Change Tracking
- Event Management
- Incident Response
- Actions & Remediations
- Infrastructure
- Cloudcraft
- Resource Catalog
- Universal Service Monitoring
- End User Device Monitoring
- Hosts
- Containers
- Processes
- Serverless
- Network Monitoring
- Storage Management
- Cloud Cost
- Application Performance
- APM
- Continuous Profiler
- Database Monitoring
- Agent Integration Overhead
- Setup Architectures
- Setting Up Postgres
- Setting Up MySQL
- Setting Up SQL Server
- Setting Up Oracle
- Setting Up Amazon DocumentDB
- Setting Up MongoDB
- Setting Up ClickHouse
- Connecting DBM and Traces
- Data Collected
- Exploring Database Hosts
- Exploring Query Metrics
- Exploring Query Samples
- Exploring Database Schemas
- Exploring Recommendations
- Troubleshooting
- Guides
- Data Streams Monitoring
- Data Observability
- Digital Experience
- Real User Monitoring
- Synthetic Testing and Monitoring
- Continuous Testing
- Experiments
- Product Analytics
- Session Replay
- Software Delivery
- CI Visibility
- CD Visibility
- Deployment Gates
- Test Optimization
- Code Coverage
- PR Gates
- DORA Metrics
- Feature Flags
- Developer Integrations
- Security
- Security Overview
- Cloud SIEM
- Code Security
- Cloud Security
- App and API Protection
- AI Guard
- Workload Protection
- Sensitive Data Scanner
- AI Observability
- Log Management
- Observability Pipelines
- Configuration
- Sources
- Processors
- Destinations
- Packs
- Akamai CDN
- Amazon CloudFront
- Amazon VPC Flow Logs
- AWS Application Load Balancer Logs
- AWS CloudTrail
- AWS Elastic Load Balancer Logs
- AWS Network Load Balancer Logs
- Cisco ASA
- Cloudflare
- F5
- Fastly
- Fortinet Firewall
- HAProxy Ingress
- Istio Proxy
- Juniper SRX Firewall Traffic Logs
- Netskope
- NGINX
- Okta
- Palo Alto Firewall
- Windows XML
- ZScaler ZIA DNS
- Zscaler ZIA Firewall
- Zscaler ZIA Tunnel
- Zscaler ZIA Web Logs
- Search Syntax
- Scaling and Performance
- Monitoring and Troubleshooting
- Guides and Resources
- Log Management
- CloudPrem
- Administration
- Account Management
- Data Security
- Help
Getting Started with RUM Deployment Tracking
Overview
As teams iterate quickly and deploy code, it can be difficult to find the exact change that caused a spike in errors or slower page load times. RUM Deployment Tracking enables you to identify when a recent deployment or release is causing performance issues within your application and help you identify the source of the problem.
Setup
You can use the version tag to monitor deployments and service behavior in support of your software deployment strategy. To get started with RUM Deployment tracking you must add RUM versions to your application.
Browser RUM
import { datadogRum } from '@datadog/browser-rum';

// Initialize Datadog Browser SDK
datadogRum.init({
  ...
  version: '1.0.0',
  ...
});
window.DD_RUM.onReady(function() {
    window.DD_RUM.init({
      ...
      version: '1.0.0',
      ...
    })
})
window.DD_RUM &&
    window.DD_RUM.init({
      ...
      version: '1.0.0',
      ...
    })
Mobile RUM
Android RUM
The version tag is captured automatically from the application’s manifest.
iOS RUM
The version tag is captured automatically from the application’s info.plist.
Analyze your deployment performance in RUM
Using version tags on the Application Overview page
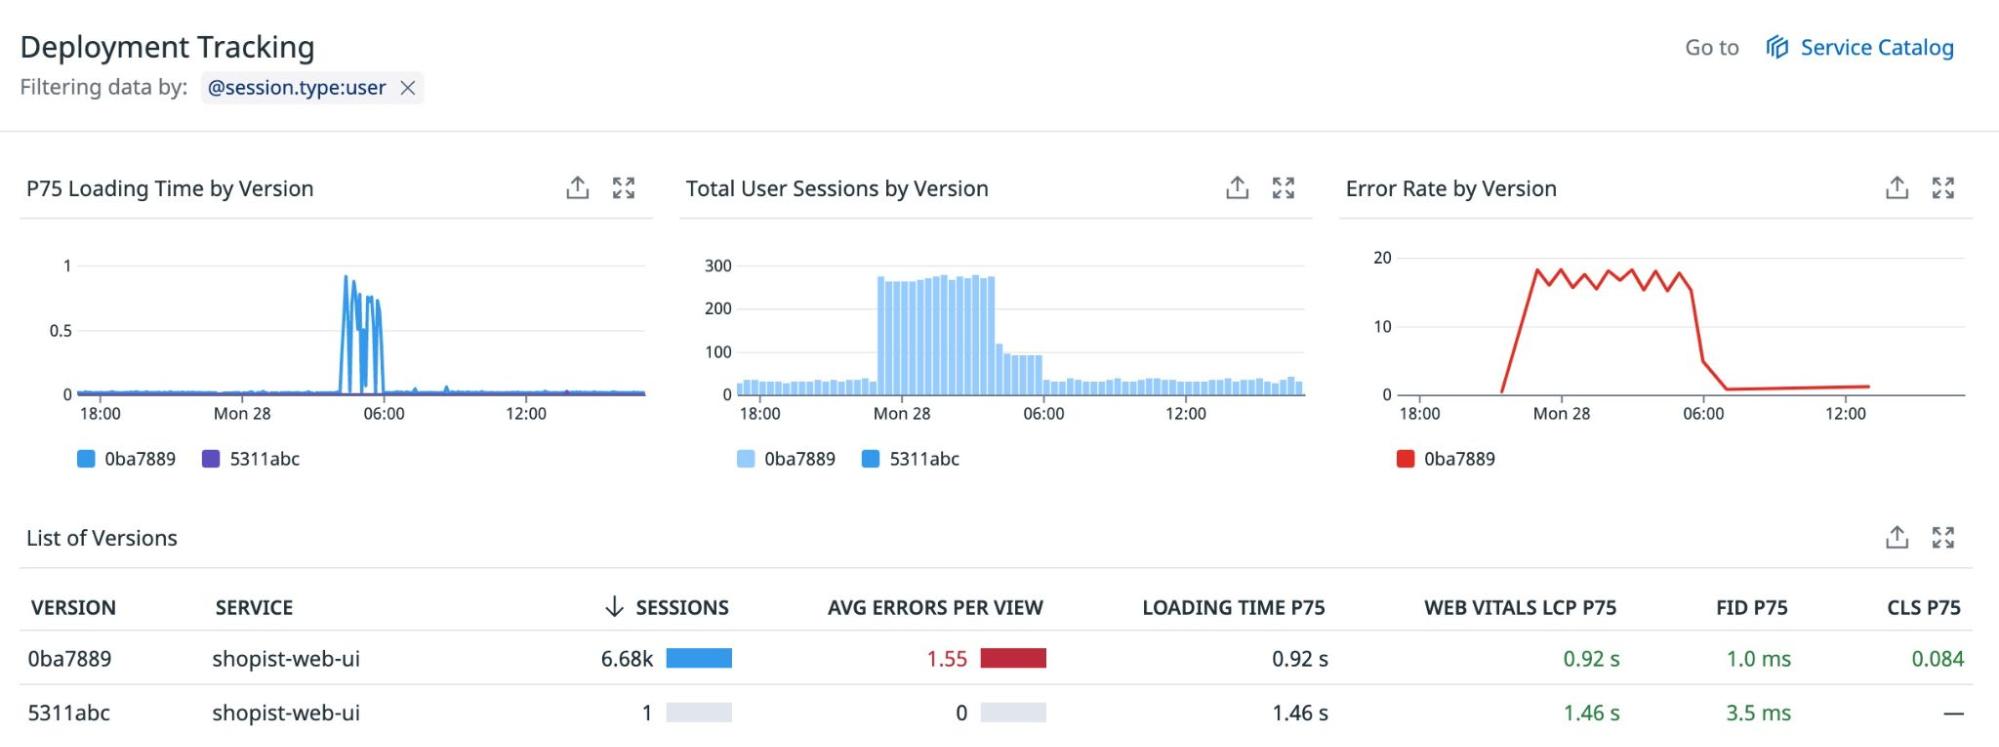
An application configured with version tags has a Deployment Tracking section on the Application Overview page. The Deployment Tracking section shows all versions of the application and services that were active during the selected time interval.
This enables you to roll back release candidates as soon as you notice an issue so you can avoid negative user experiences. These out of the box graphs are aggregated across versions, making it easier to identify problems in your application before they turn into serious issues.
You will see:
- P75 Loading Time by Version
- Total User Sessions by Version
- Error Rate by Version
In the table below these widgets, you will see:
- The version names deployed for the application and its services over the timeframe.
- Number of user session for that version
- Average errors per view
- P75 Loading Time
- P75 for Core Web Vitals
These widgets can be exported to dashboards and monitors.
Deployment Comparison
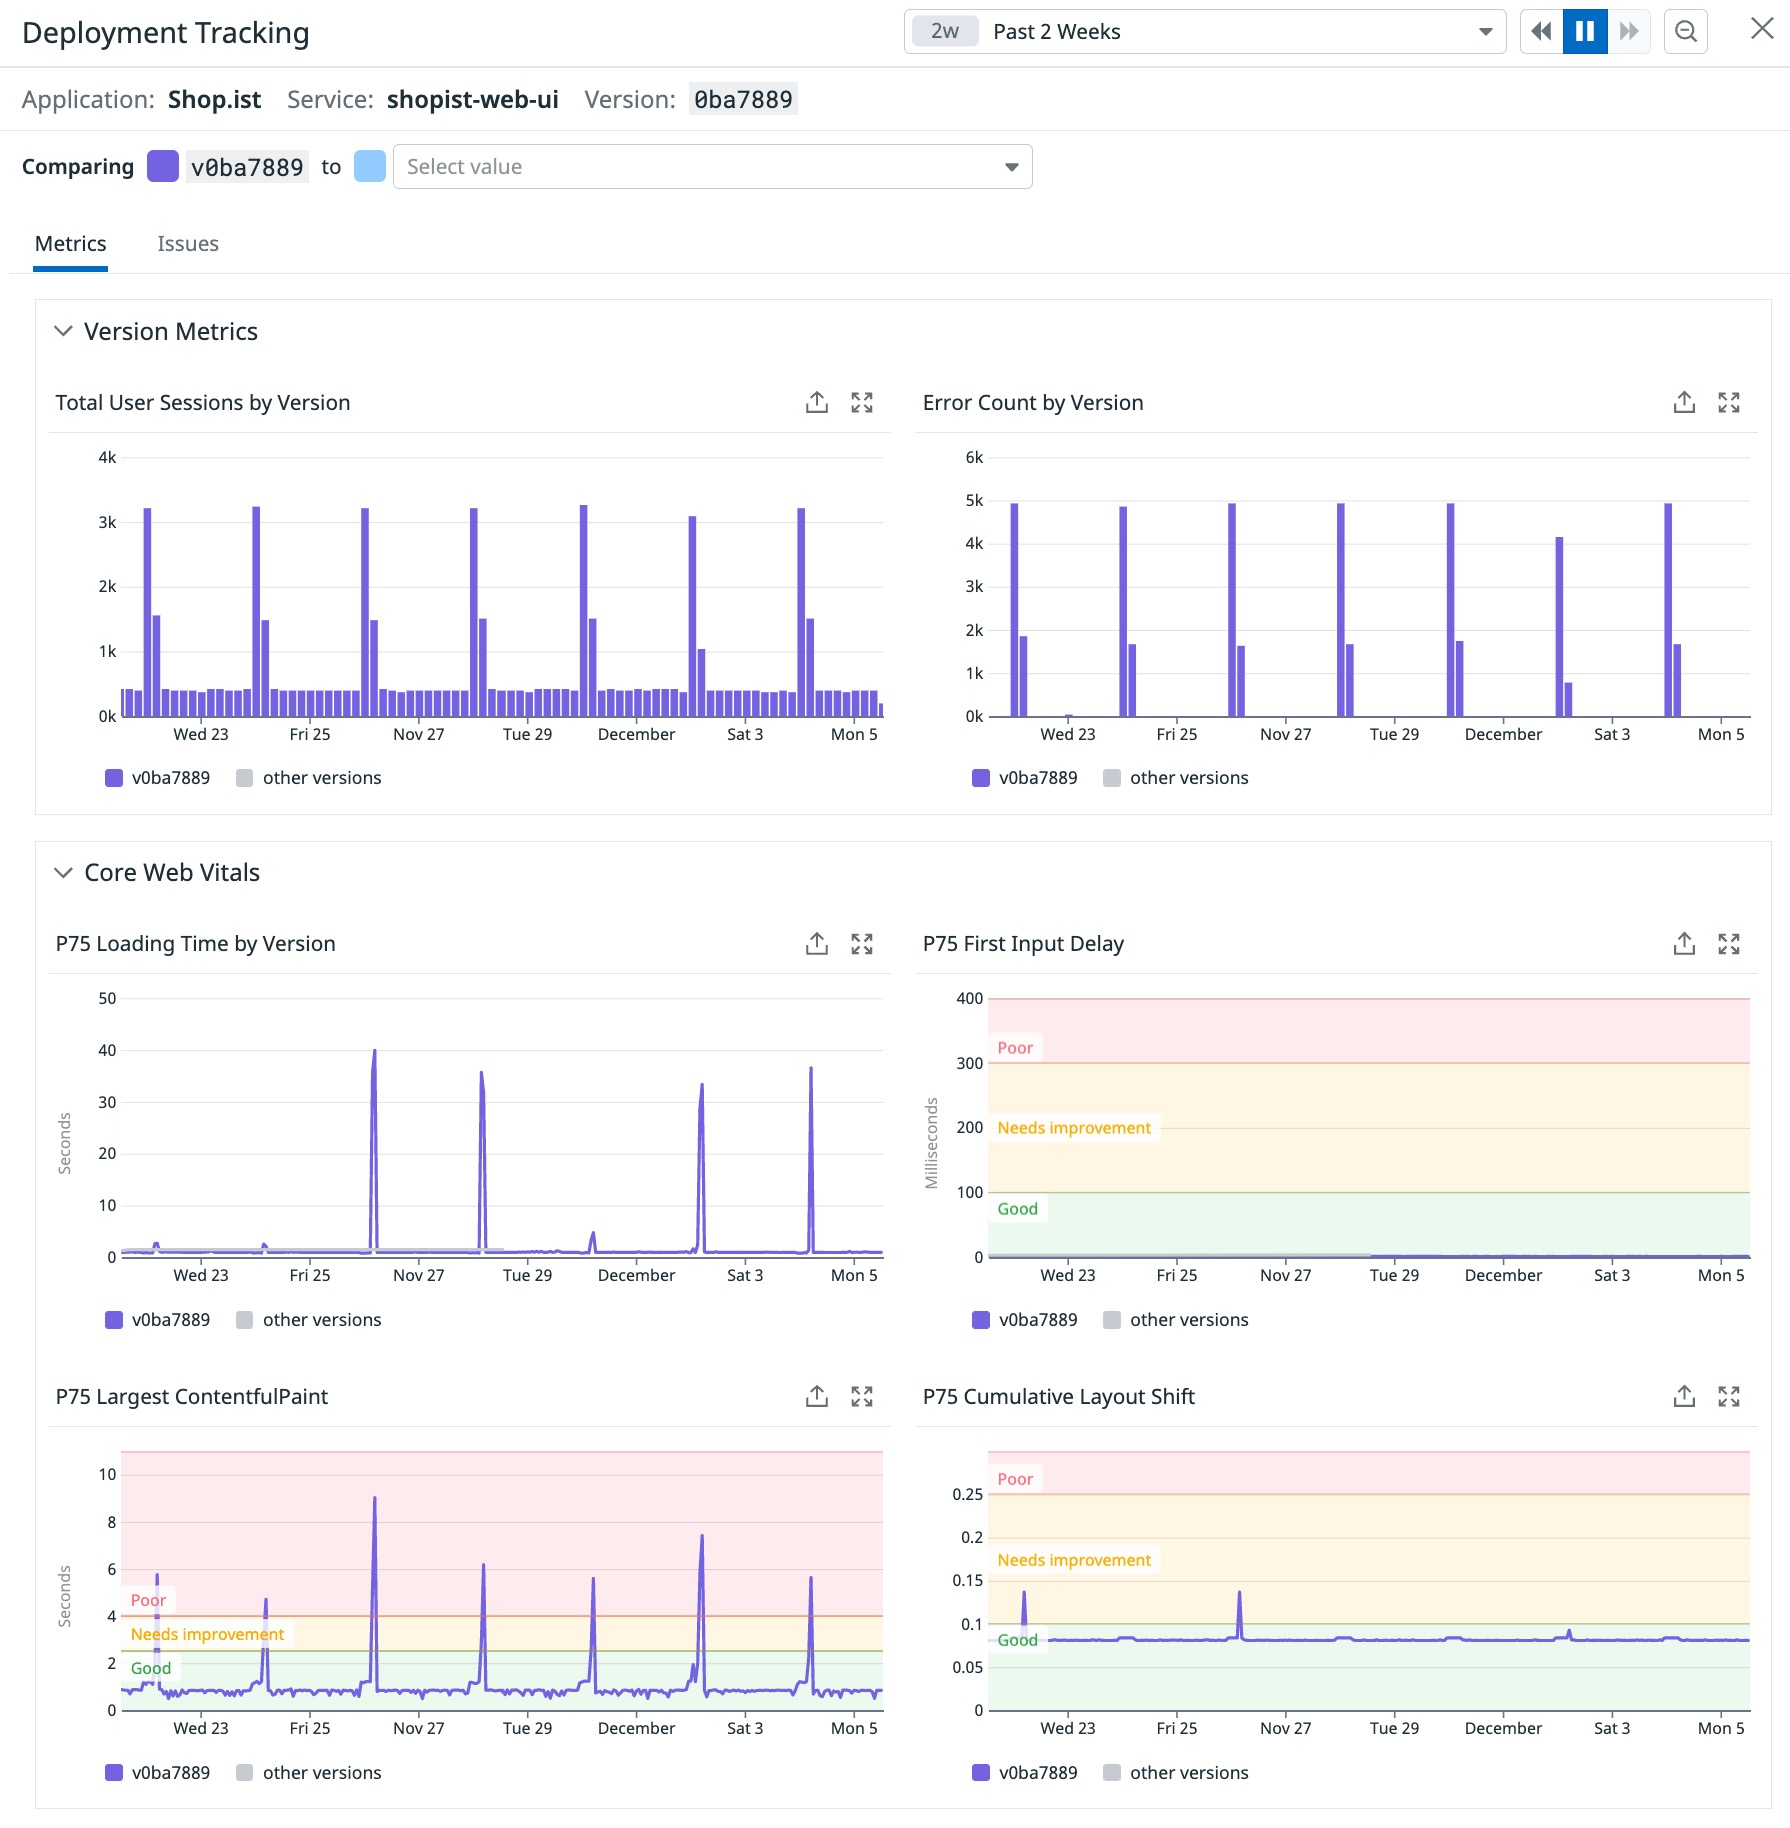
Click on any version row in the List of Versions* table to open a version comparison page, allowing you to compare two versions of the same service. By default, the selected version is compared to all previous versions. You can change the selection to compare any two versions within the past 30 days.
Similar to the graphs on the Application Overview page, the User Sessions, Core Web Vitals, and Errors graphs show an overview of a deployment rollout or spikes in error rates. On this page, the graphs highlight the selected versions for comparison and display all other versions in gray for additional context.
As you are monitoring your release, this helps you to compare the performance of code deployments against existing live code to verify that new code is performing properly, and that no new errors have surfaced in between versions.
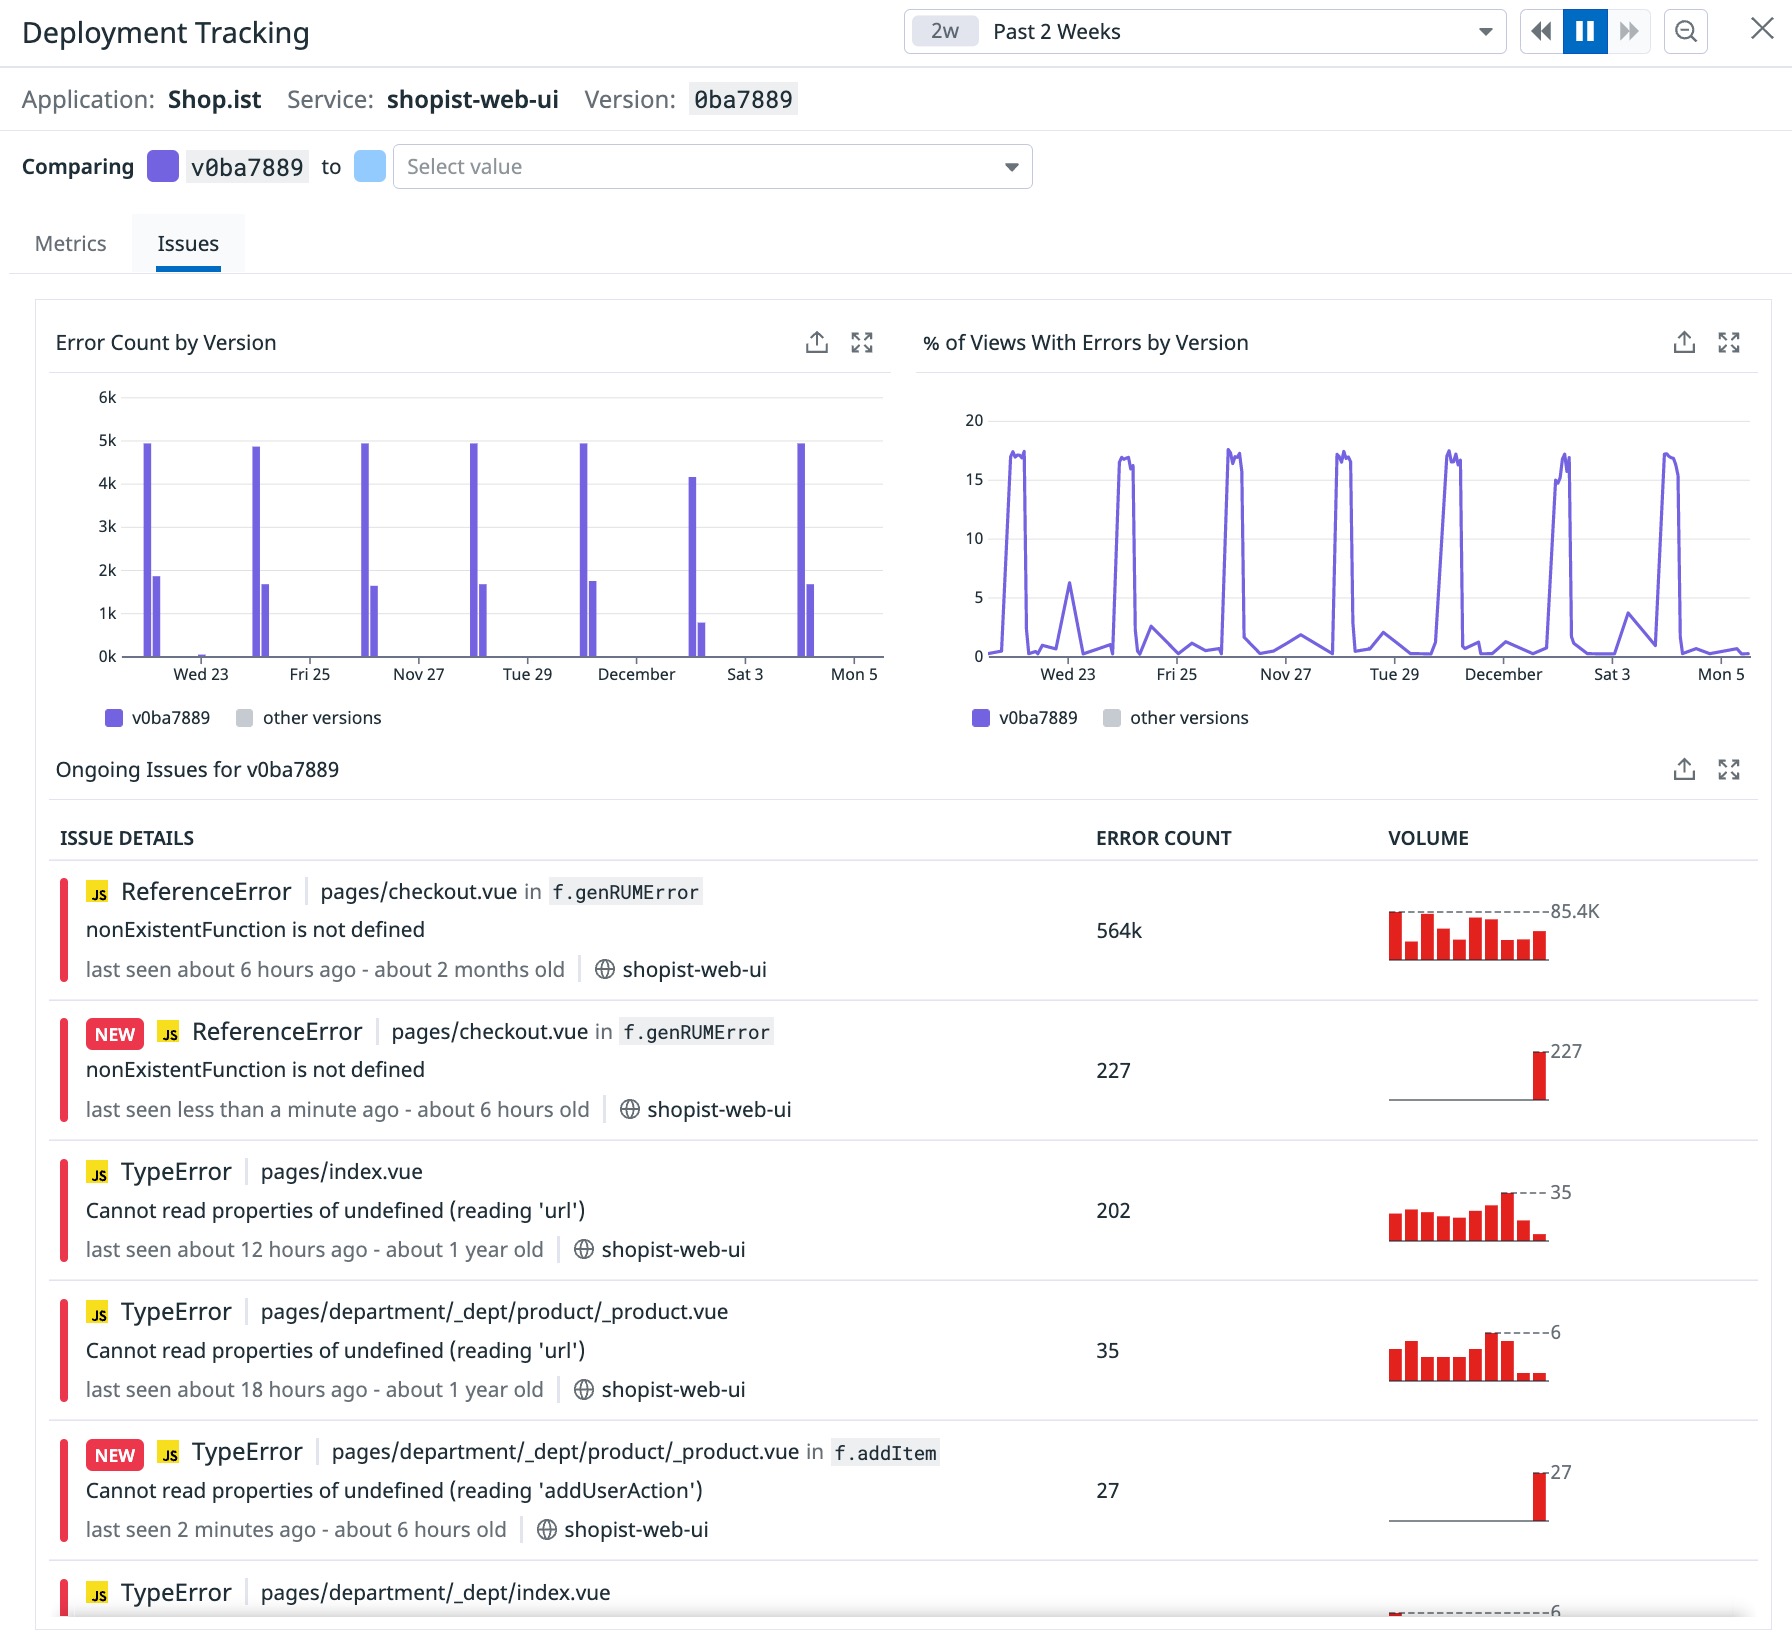
The Issues tab lists differences in errors detected for each of the two versions, highlighting:
Error Count by Version
% of Views with Errors by Version
Error Tracking issues
Explore the RUM deployment tracking powerpacks
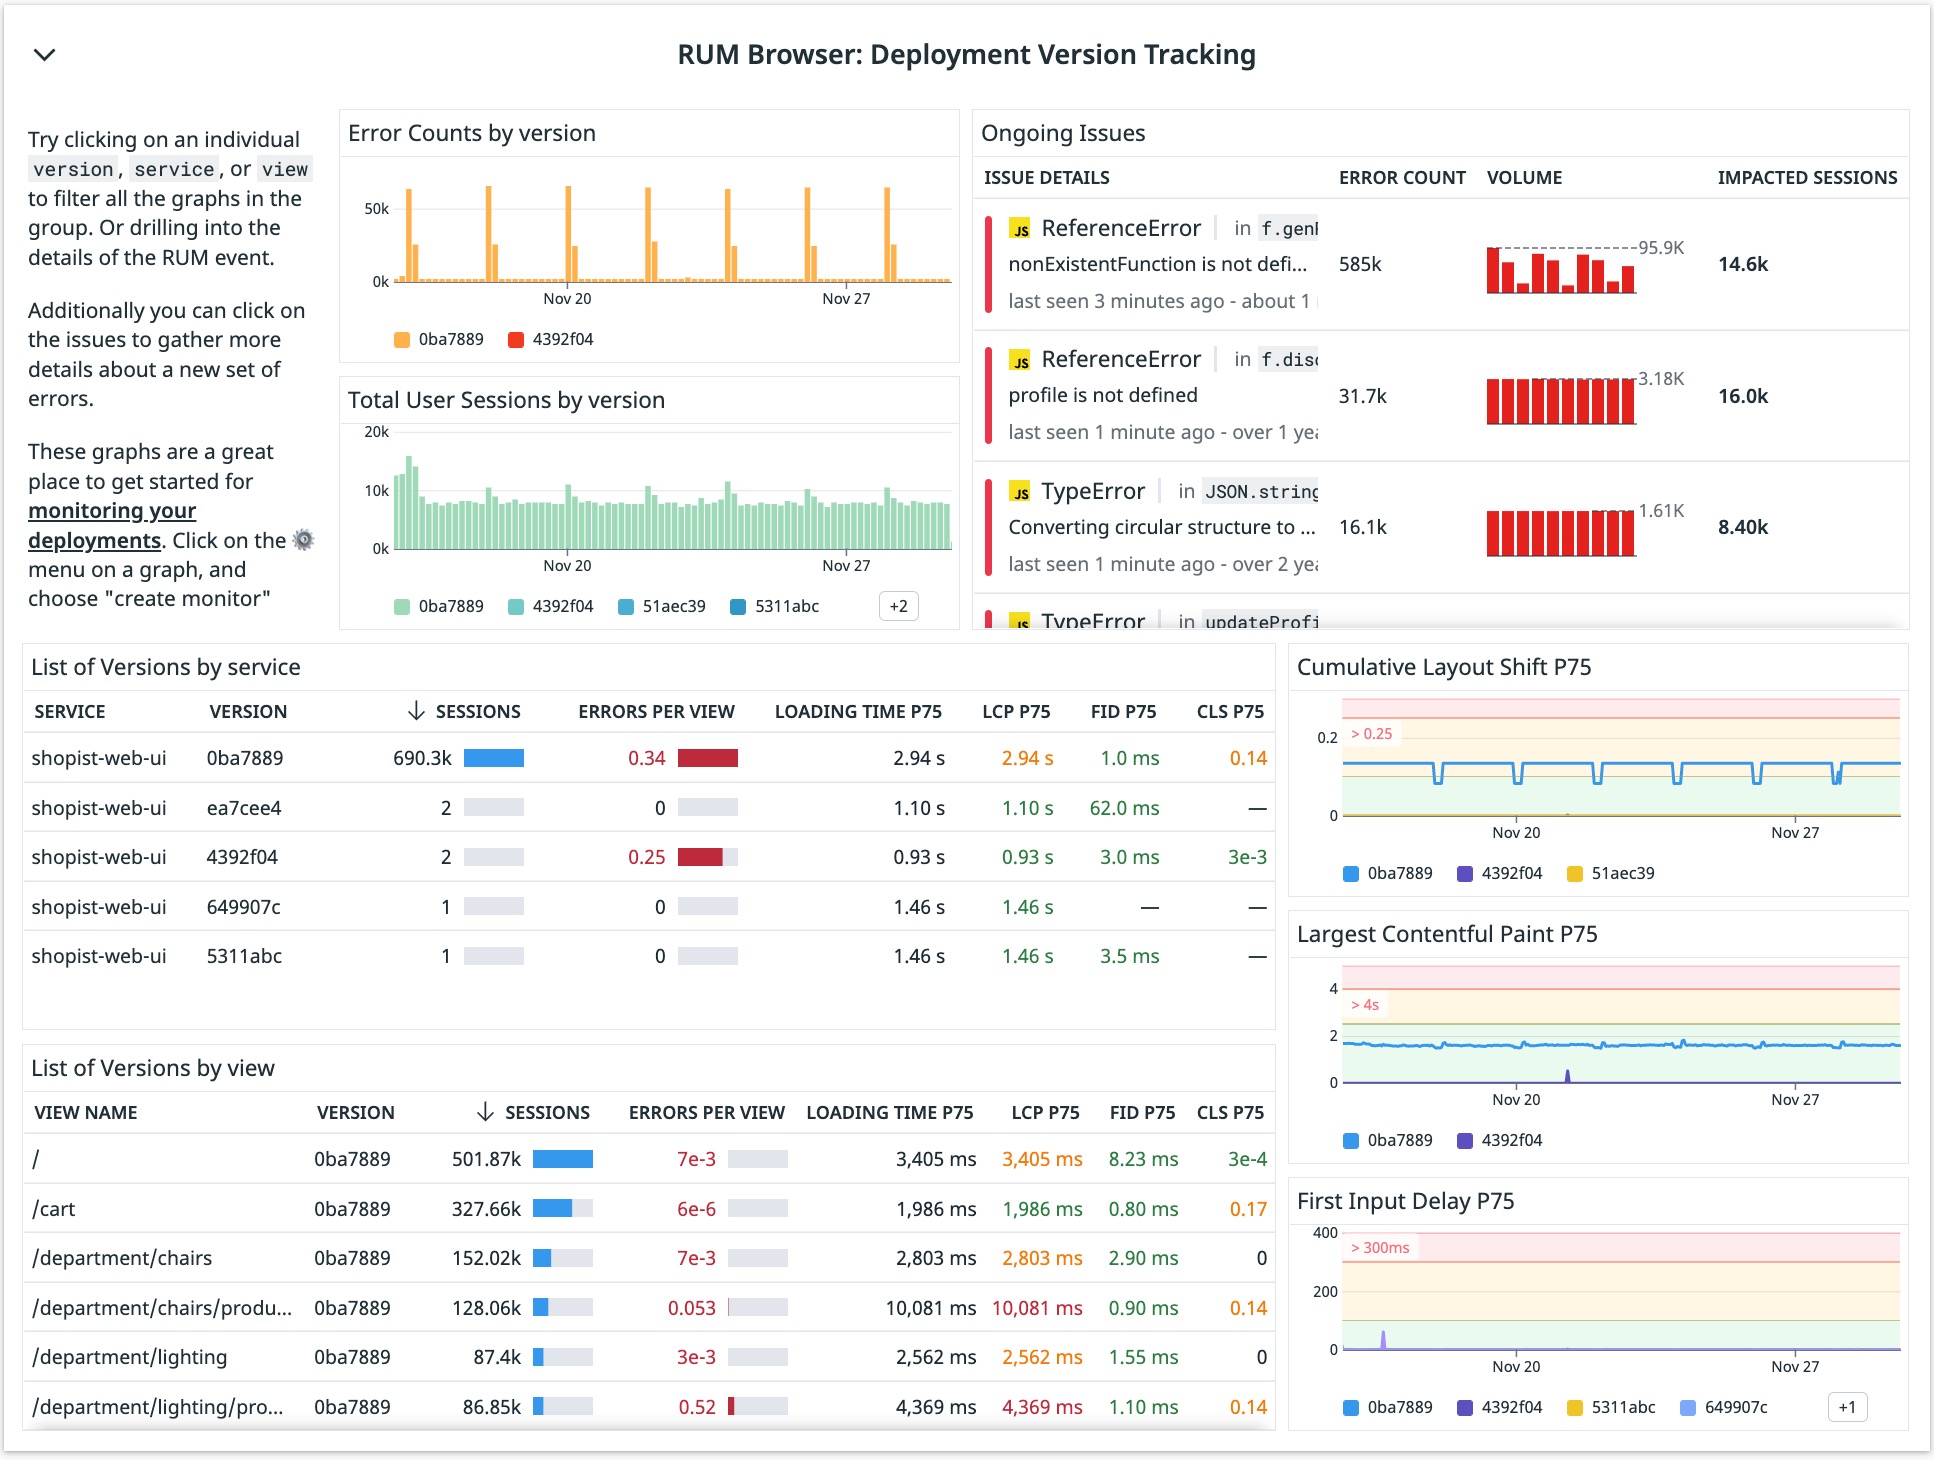
You can add deployment tracking for your RUM services to dashboards using the powerpacks menu on a dashboard and searching for the “Deployment Version Tracking” powerpack. You can then iterate and add any other widgets to your dashboards to help your teams release new features safely.
Using version tags on the Application Overview page
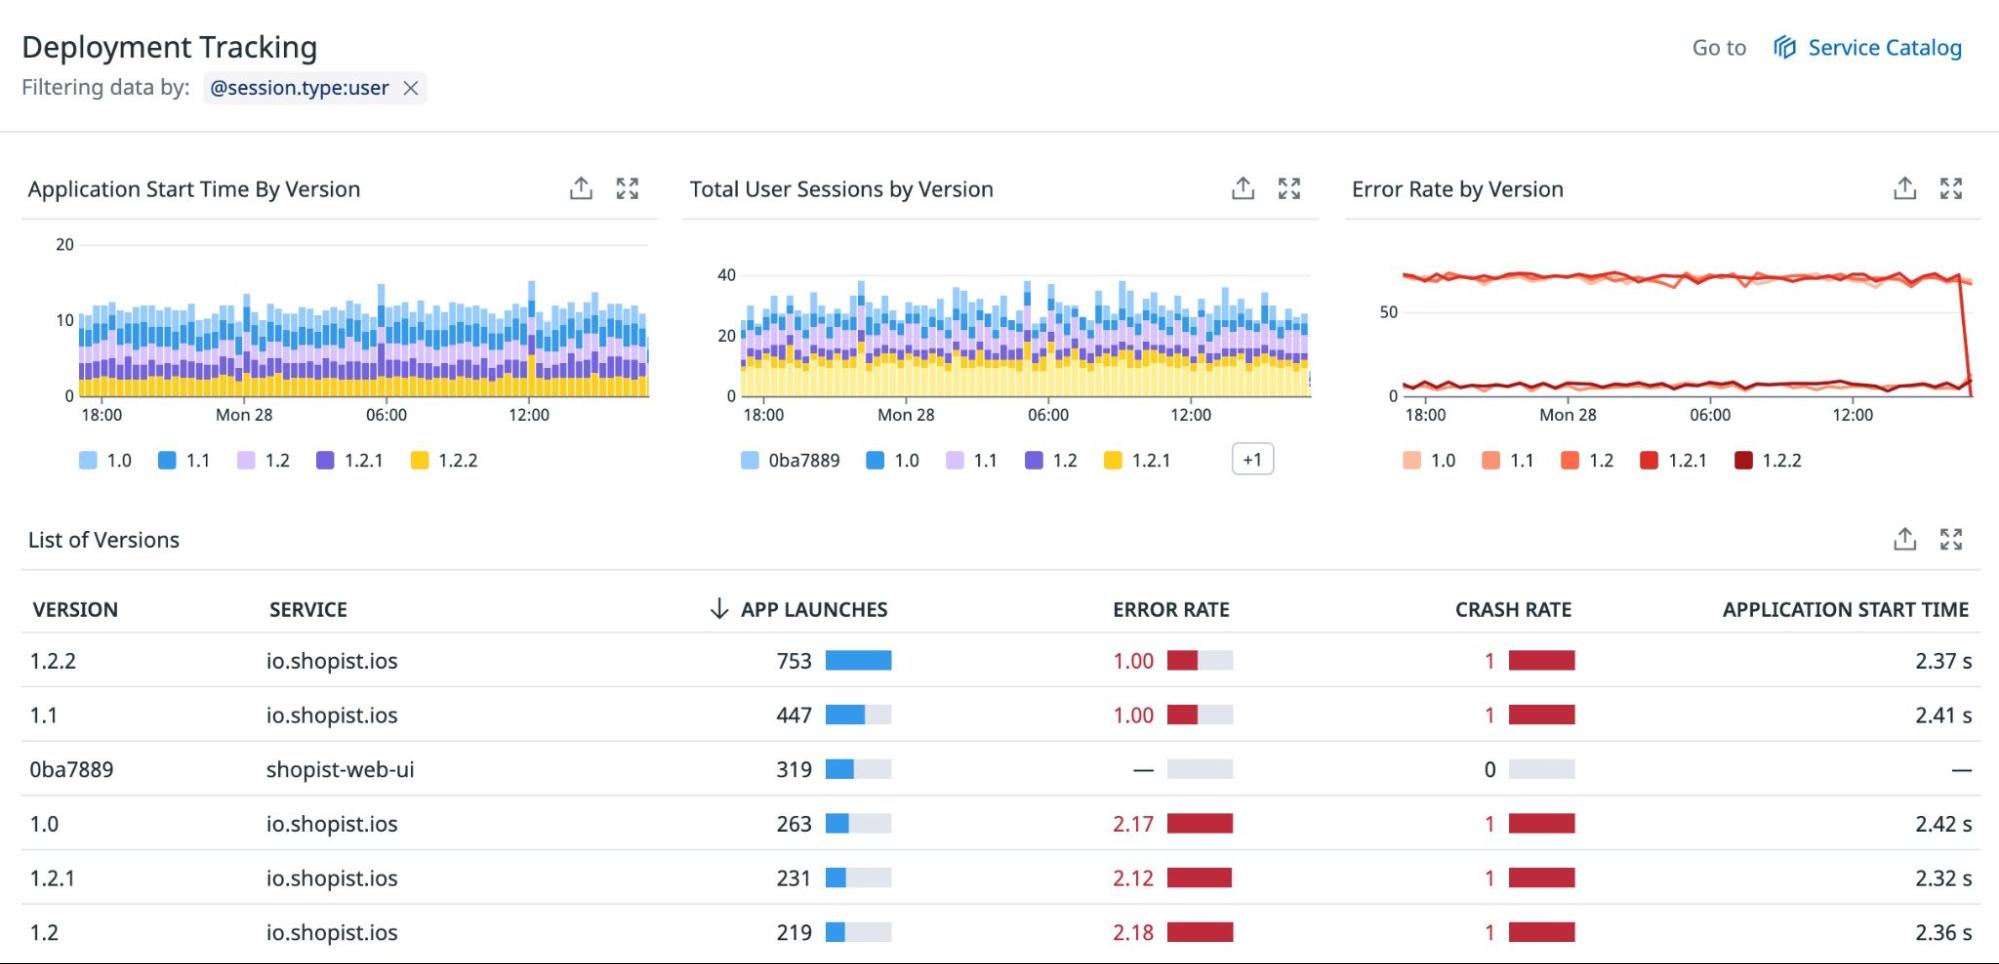
An application configured with version tags has a Deployment Tracking section on the Application Overview page. The Deployment Tracking section shows all versions of the application and services that were active during the selected time interval.
This enables you to quickly roll back release candidates as soon as you spot an issue so you can avoid negative user experiences. These out of the box graphs are aggregated across versions, making it easier to identify problems in your application before they turn into serious issues.
You will see:
- Average Application Start Time by Version
- Total User Sessions by Version
- Error Rate by Version
In the table below these widgets, you will see:
- The version names deployed for the application and its services over the timeframe.
- Number of app launches for that version
- Error Rate
- Crash Rate
- P90 Application Start Time
These widgets can be exported to dashboards and monitors.
Deployment comparison
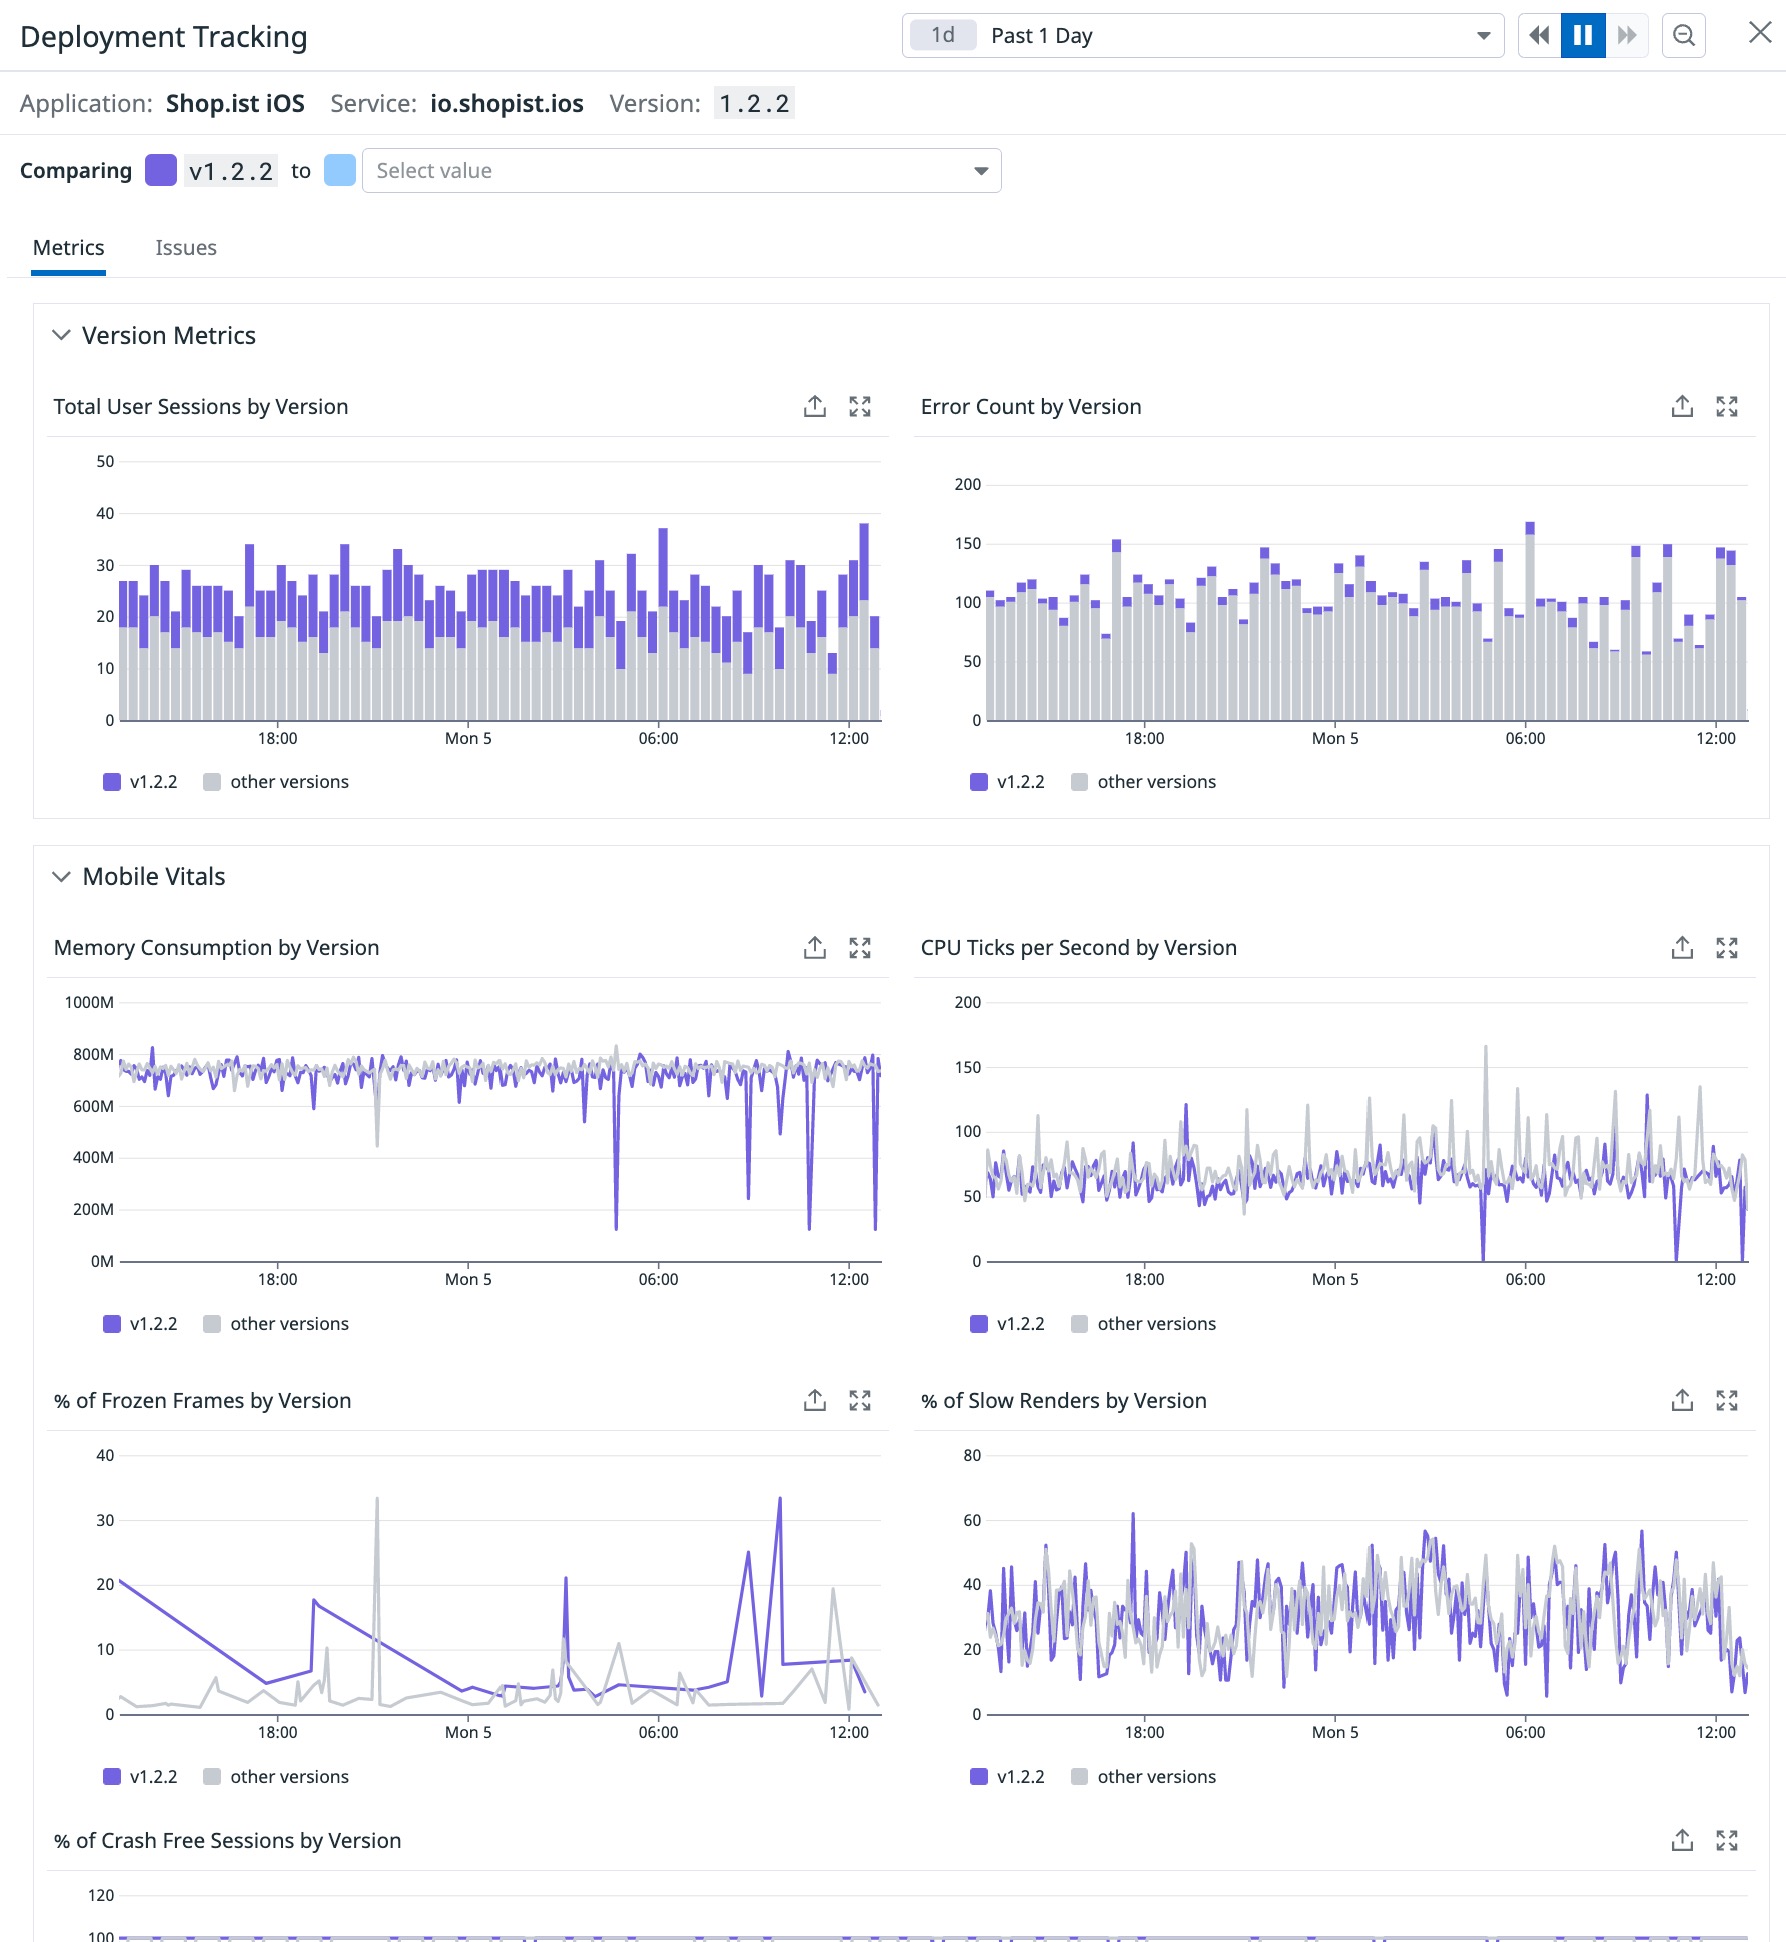
Click on any version row in the List of Versions table to open a version comparison page, allowing you to compare two versions of the same service. By default, the selected version is compared to all previous versions. You can change the selection to compare any two versions within the past 30 days.
Similar to the graphs on the Application Overview page, the User Sessions, Mobile Vitals, and Errors graphs show an overview of a deployment rollout or spikes in error rates. On this page, the graphs highlight the selected versions for comparison and display all other versions in gray for additional context.
As you are monitoring your release, this makes it easy for you to compare the performance of code deployments against existing live code to verify that new code is performing properly and that no new errors have surfaced in between versions.
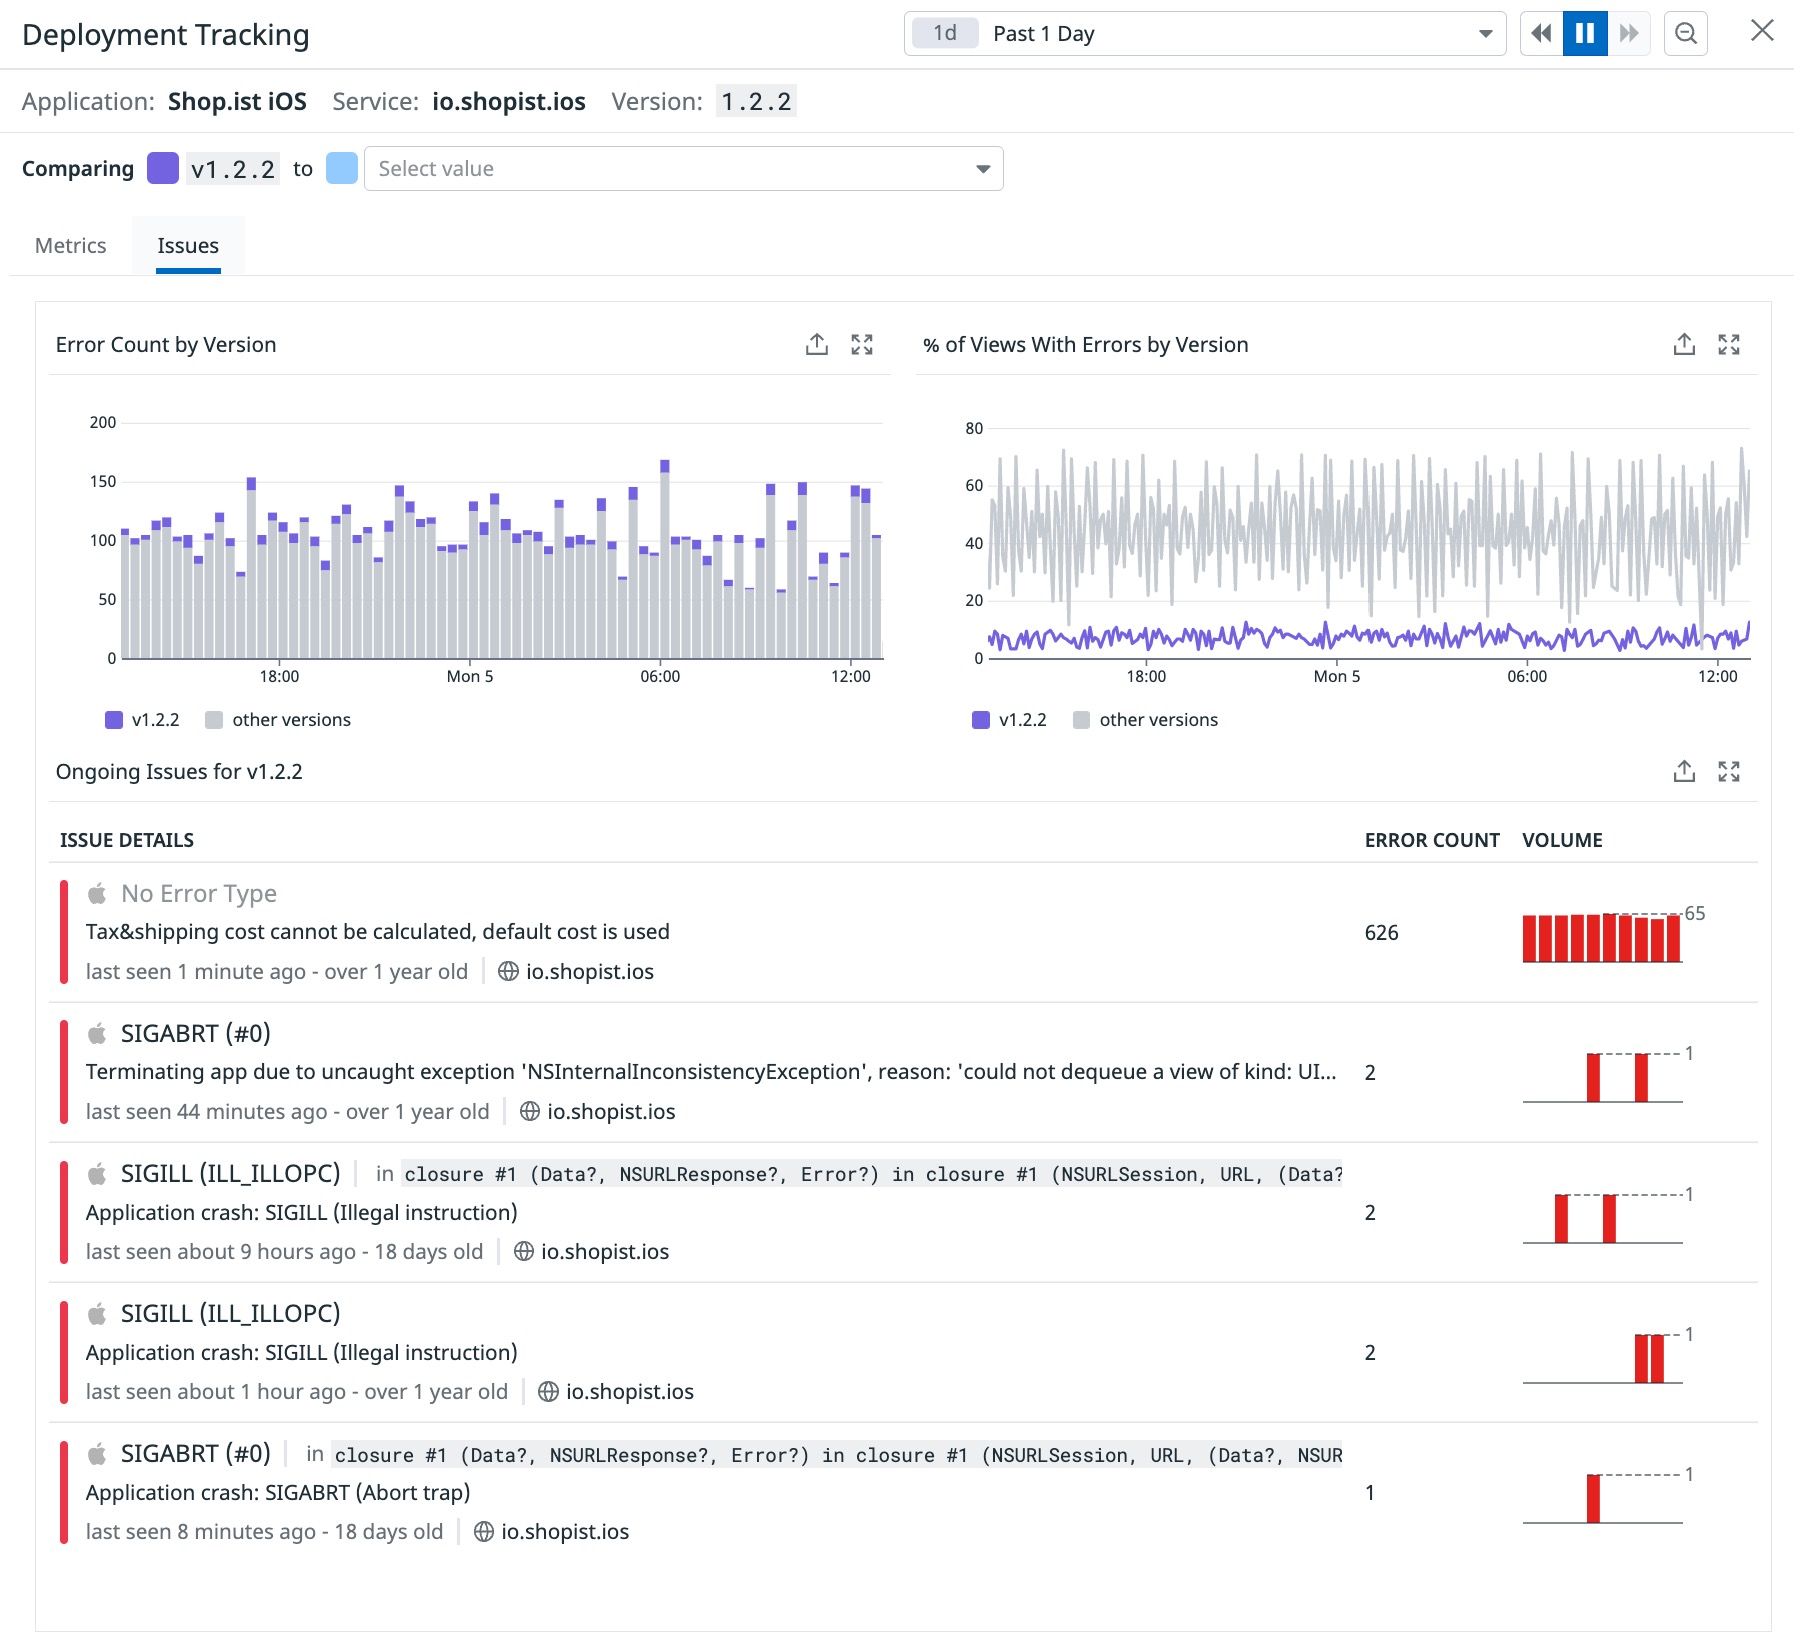
The Issues tab lists differences in errors detected for each of the two versions, highlighting:
Error Count by Version
% of Views with Errors by Version
Error Tracking issues
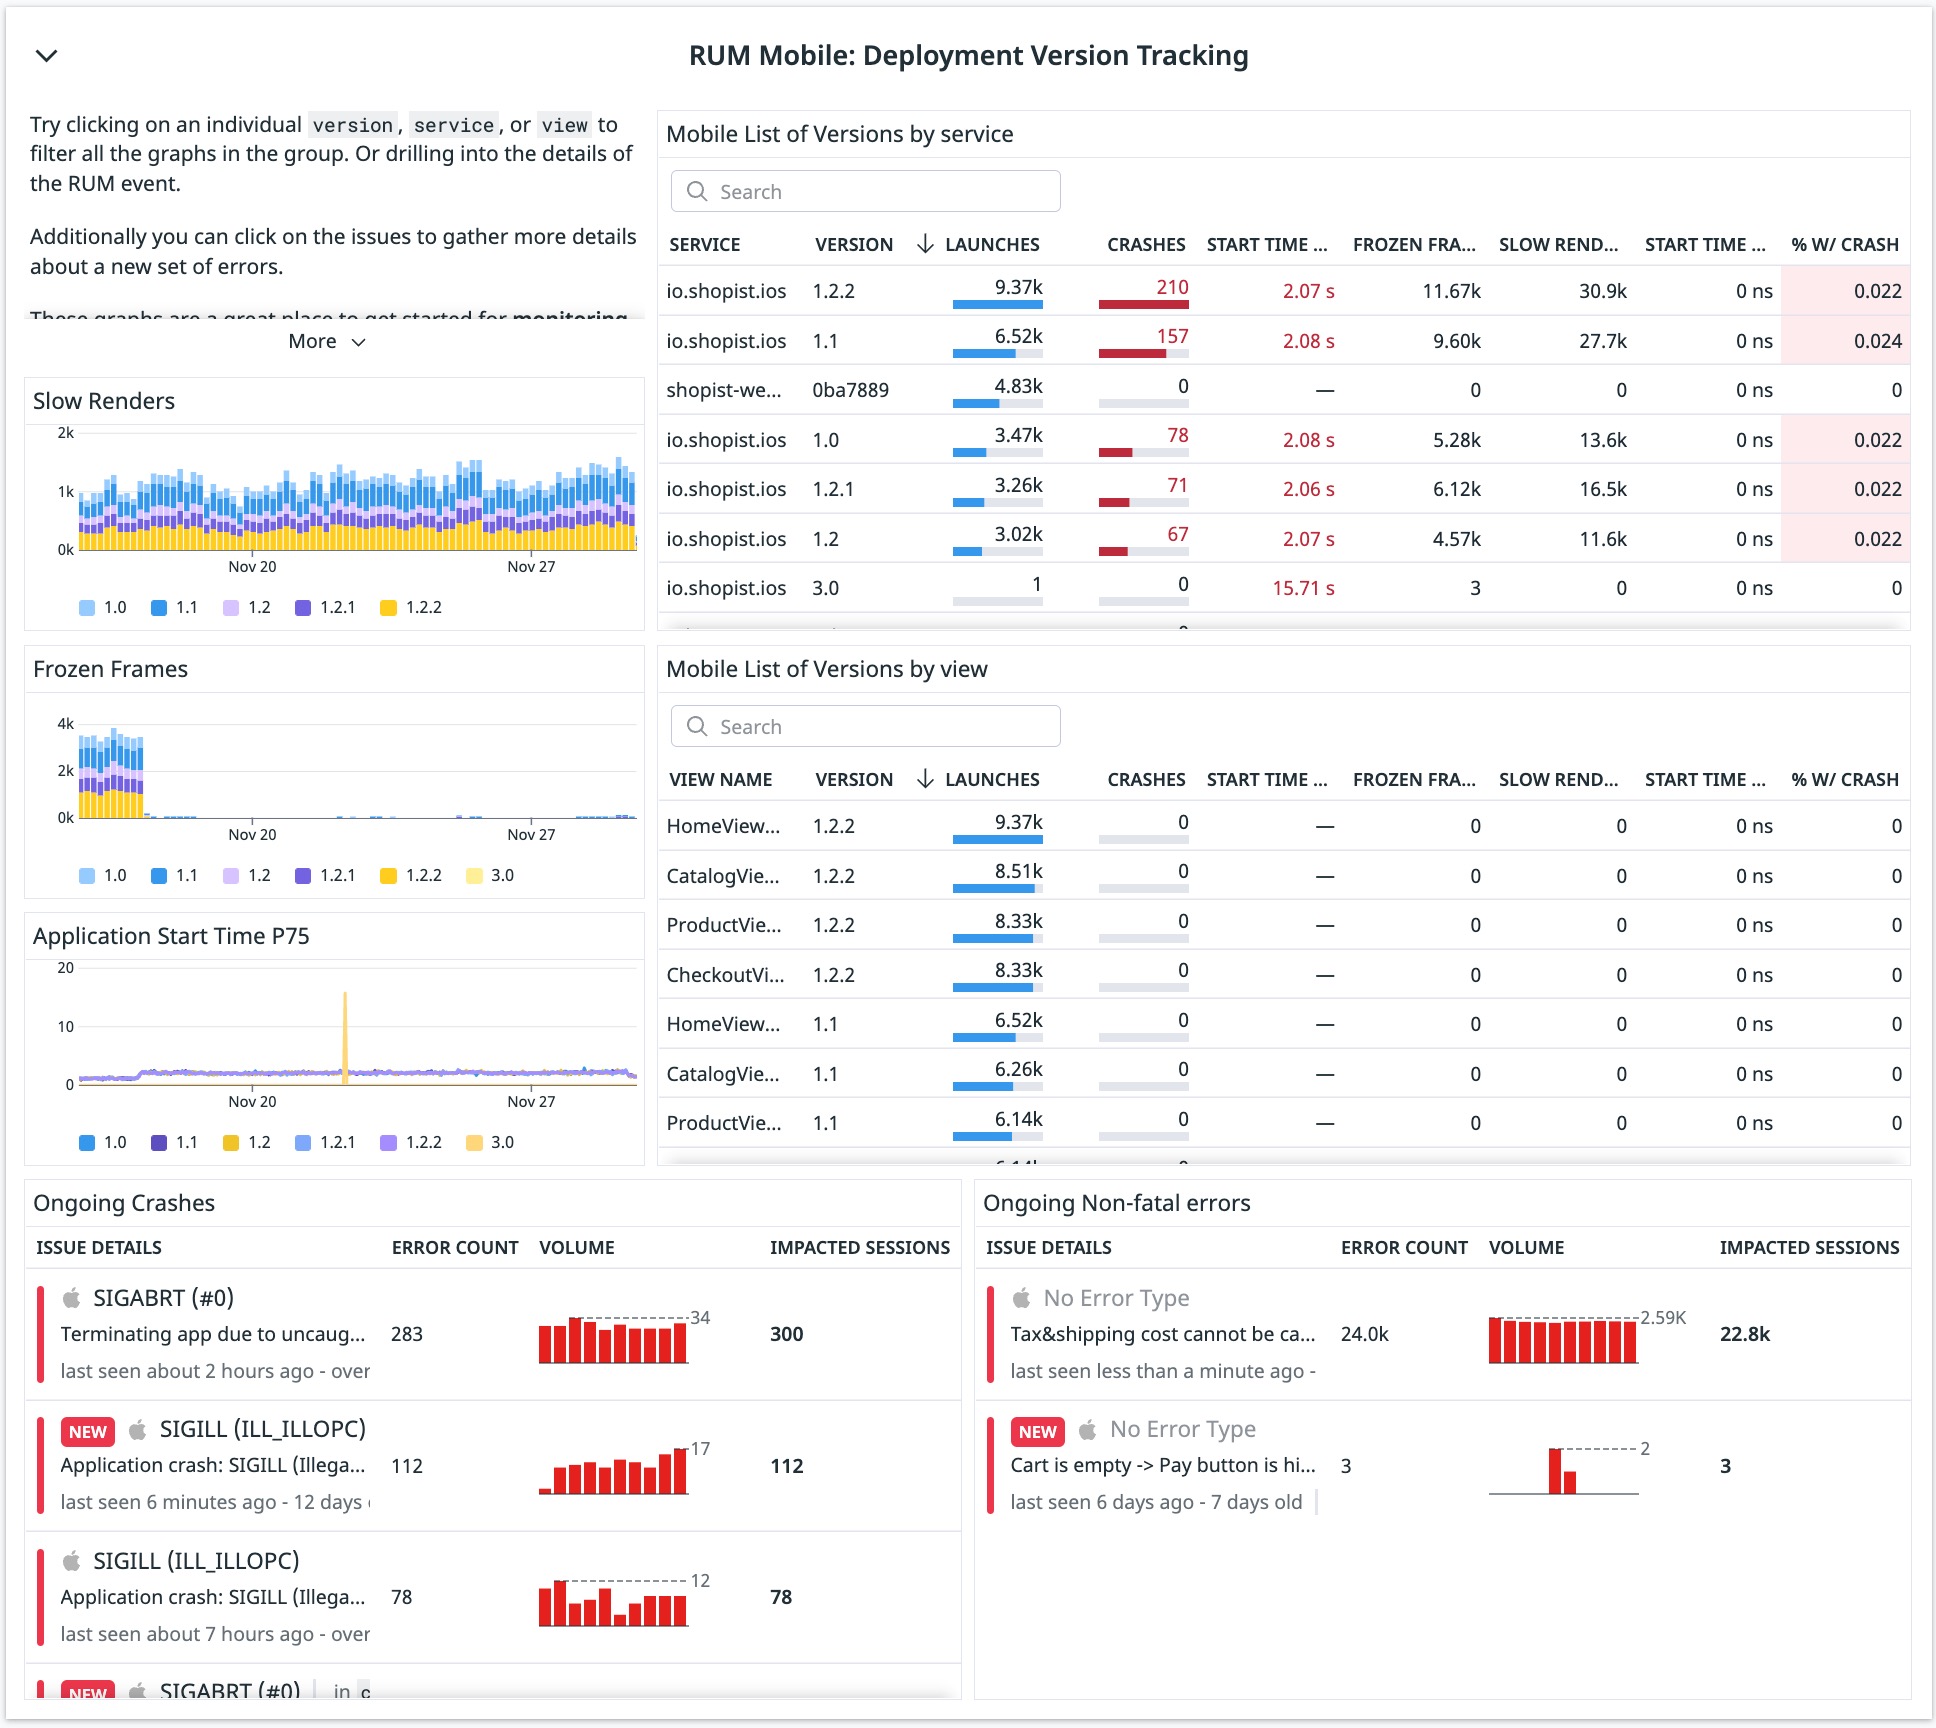
Explore the RUM Deployment Tracking Powerpacks
You can add deployment tracking for your RUM services to dashboards using the powerpacks menu on a dashboard and searching for the “Deployment Version Tracking” powerpack. You can then iterate and add any other widgets to your dashboards to help your teams release new features safely.
Further Reading
Additional helpful documentation, links, and articles:
