- Essentials
- Getting Started
- Agent
- API
- APM Tracing
- Containers
- Dashboards
- Database Monitoring
- Datadog
- Datadog Site
- DevSecOps
- Incident Management
- Integrations
- Internal Developer Portal
- Logs
- Monitors
- Notebooks
- OpenTelemetry
- Profiler
- Search
- Session Replay
- Security
- Serverless for AWS Lambda
- Software Delivery
- Synthetic Monitoring and Testing
- Tags
- Workflow Automation
- Learning Center
- Support
- Glossary
- Standard Attributes
- Guides
- Agent
- Integrations
- Extend Datadog
- Authorization
- DogStatsD
- Custom Checks
- Integrations
- Build an Integration with Datadog
- Create an Agent-based Integration
- Create an API-based Integration
- Create a Log Pipeline
- Integration Assets Reference
- Build a Marketplace Offering
- Create an Integration Dashboard
- Create a Monitor Template
- Create a Cloud SIEM Detection Rule
- Install Agent Integration Developer Tool
- Service Checks
- Community
- Guides
- OpenTelemetry
- Administrator's Guide
- API
- Partners
- Datadog Mobile App
- DDSQL Reference
- CoScreen
- CoTerm
- Remote Configuration
- Cloudcraft (Standalone)
- In The App
- Dashboards
- Notebooks
- DDSQL Editor
- Reference Tables
- Sheets
- Monitors and Alerting
- Service Level Objectives
- Metrics
- Watchdog
- Bits AI
- Internal Developer Portal
- Error Tracking
- Change Tracking
- Event Management
- Incident Response
- Actions & Remediations
- Infrastructure
- Cloudcraft
- Resource Catalog
- Universal Service Monitoring
- End User Device Monitoring
- Hosts
- Containers
- Processes
- Serverless
- Network Monitoring
- Storage Management
- Cloud Cost
- Application Performance
- APM
- Continuous Profiler
- Database Monitoring
- Agent Integration Overhead
- Setup Architectures
- Setting Up Postgres
- Setting Up MySQL
- Setting Up SQL Server
- Setting Up Oracle
- Setting Up Amazon DocumentDB
- Setting Up MongoDB
- Setting Up ClickHouse
- Connecting DBM and Traces
- Data Collected
- Exploring Database Hosts
- Exploring Query Metrics
- Exploring Query Samples
- Exploring Database Schemas
- Exploring Recommendations
- Troubleshooting
- Guides
- Data Streams Monitoring
- Data Observability
- Digital Experience
- Real User Monitoring
- Synthetic Testing and Monitoring
- Continuous Testing
- Product Analytics
- Session Replay
- Software Delivery
- CI Visibility
- CD Visibility
- Deployment Gates
- Test Optimization
- Code Coverage
- PR Gates
- DORA Metrics
- Feature Flags
- Developer Integrations
- Security
- Security Overview
- Cloud SIEM
- Code Security
- Cloud Security
- App and API Protection
- AI Guard
- Workload Protection
- Sensitive Data Scanner
- AI Observability
- Log Management
- Observability Pipelines
- Configuration
- Sources
- Processors
- Destinations
- Packs
- Akamai CDN
- Amazon CloudFront
- Amazon VPC Flow Logs
- AWS Application Load Balancer Logs
- AWS CloudTrail
- AWS Elastic Load Balancer Logs
- AWS Network Load Balancer Logs
- Cisco ASA
- Cloudflare
- F5
- Fastly
- Fortinet Firewall
- HAProxy Ingress
- Istio Proxy
- Juniper SRX Firewall Traffic Logs
- Netskope
- NGINX
- Okta
- Palo Alto Firewall
- Windows XML
- ZScaler ZIA DNS
- Zscaler ZIA Firewall
- Zscaler ZIA Tunnel
- Zscaler ZIA Web Logs
- Search Syntax
- Scaling and Performance
- Monitoring and Troubleshooting
- Guides and Resources
- Log Management
- CloudPrem
- Administration
- Account Management
- Data Security
- Help
- feature_flags_client
Alerting With RUM Data
Overview
Real User Monitoring (RUM) lets you create alerts about atypical behavior in your applications. With RUM without Limits™, use metric-based monitors to alert on your full unsampled traffic with 15-month retention. Metric-based monitors support advanced alerting conditions such as anomaly detection.
Create a RUM monitor
To create a RUM monitor in Datadog, first, navigate to Monitors > New Monitor > Real User Monitoring.
Next, choose one of the following methods to create your monitor:
- Start with a template: Datadog provides several pre-built templates for common RUM monitoring scenarios like error rates, performance vitals, or availability checks. Browse the full template gallery to get started.
- Build a custom monitor: Choose from out-of-the-box metrics or custom metrics, then scope to your application, specific pages, or views.
Learn more about creating RUM Monitors.
Choosing between monitoring metrics and events
Choose what to monitor based on your use case:
Full traffic metrics - Best for monitoring availability, loading times, error rates, and user experience trends. For RUM without Limits™ customers, metric-based monitors provide full unsampled traffic visibility (before retention filters apply), 15-month retention, and advanced capabilities like anomaly detection and forecasts.
Retained events - Best for detecting critical, low-frequency issues that require full event context. Use event-based monitors when you need to alert on indexed data or specific attributes not available as metrics. Configure retention filters to ensure the relevant data is captured.
To create an event-based monitor, you can export search queries from the RUM Explorer. Use any facets that RUM collects, including custom facets and measures, and the
measure byfield for view-related counts like load time and error count.
Export queries from the RUM homepage
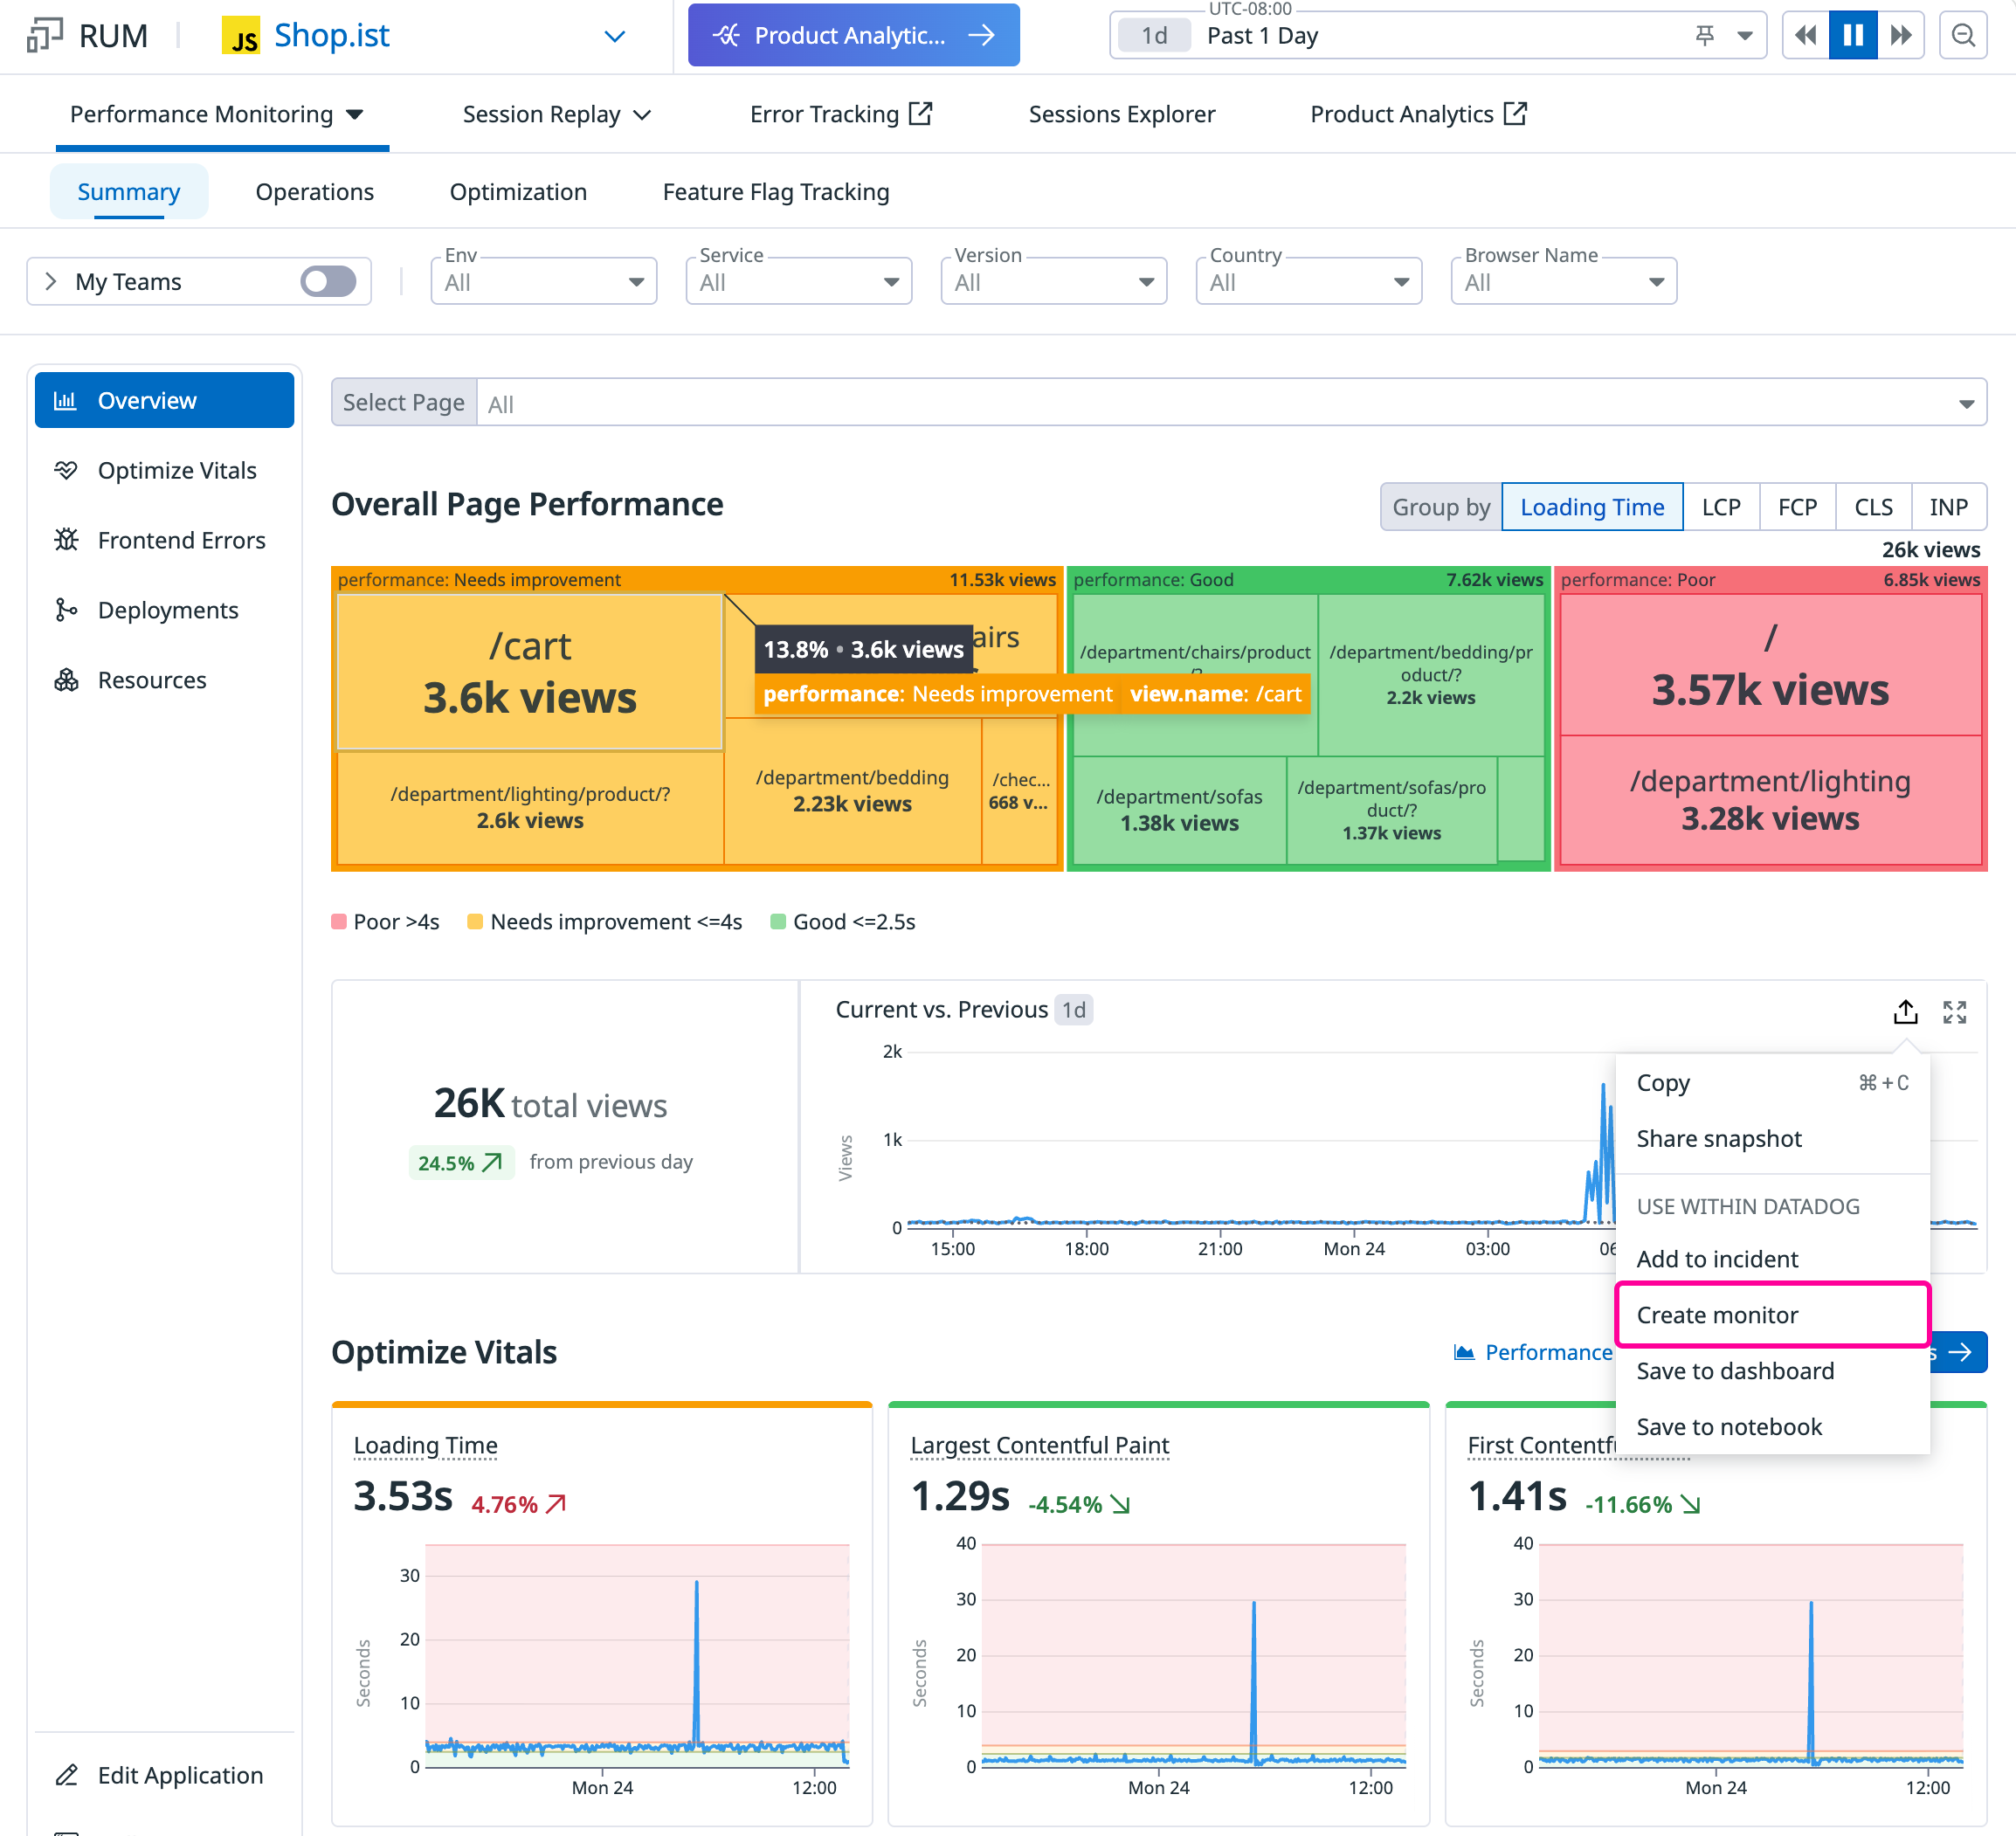
You can export existing queries from the RUM homepage to create a monitor with all queries and context preserved. For customers on RUM without Limits™, the queries powering those widgets are based on the out-of-the-box metrics. For customers on the legacy model, they are based on events.
Click the Export > Create Monitor button to export a widget to a pre-configured RUM monitor. For more information, see Export RUM Events. Remember that event-based monitors should be used alongside properly configured retention filters.
Route your alert
After creating an alert, route it to people or channels by writing a message and sending a test notification. For more information, see Notifications.
Alerting examples
The following examples highlight common use cases for RUM monitors. For RUM without Limits customers, these scenarios can be implemented using metric-based monitors for visibility into your full traffic and advanced alerting capabilities.
Traffic monitoring with anomaly detection
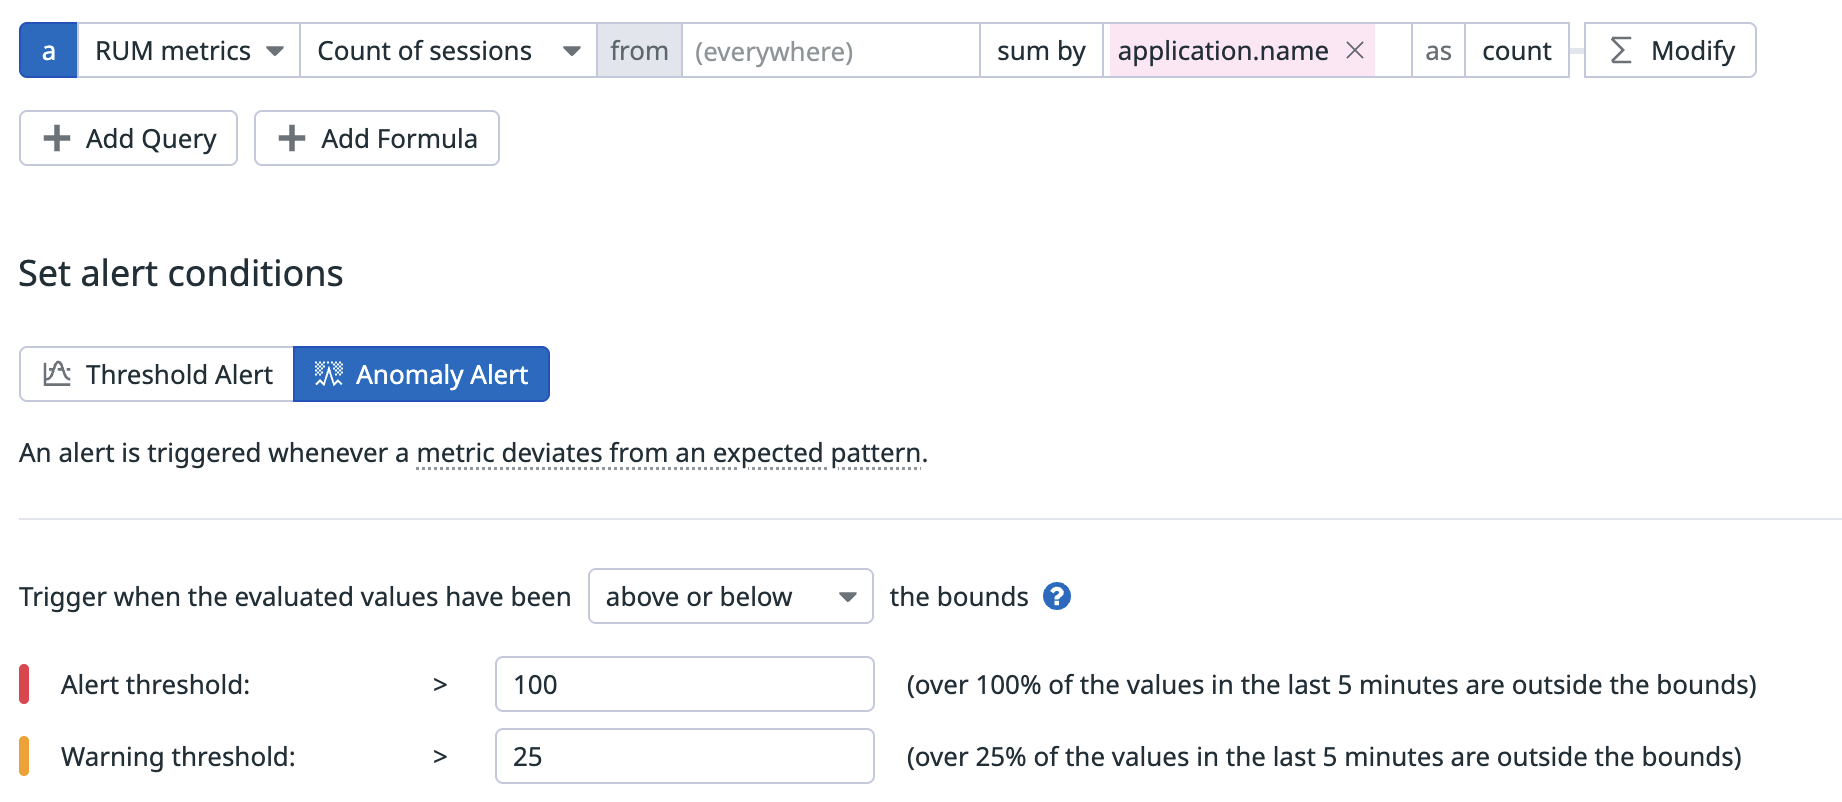
Session count monitoring helps teams detect unusual traffic patterns that could indicate issues or opportunities. Unlike threshold-based alerts, anomaly detection automatically learns normal traffic patterns and alerts when behavior deviates significantly.
This example shows a RUM monitor using anomaly detection to track session counts over time. The monitor can be scoped to a specific application or service to detect unexpected drops or spikes in user traffic. Anomaly detection is particularly useful for traffic monitoring because it adapts to daily and weekly patterns, reducing false alerts from expected traffic variations.
Crash-free sessions
The crash-free rate helps teams track how often mobile sessions complete without errors.
This example uses mobile RUM to evaluate application stability across release versions. The monitor is filtered to a specific application (for example, Shop.ist iOS) and grouped by version to help identify regressions tied to specific releases. The query combines crash-free sessions and total sessions to calculate the crash-free rate as a percentage.
Performance vitals
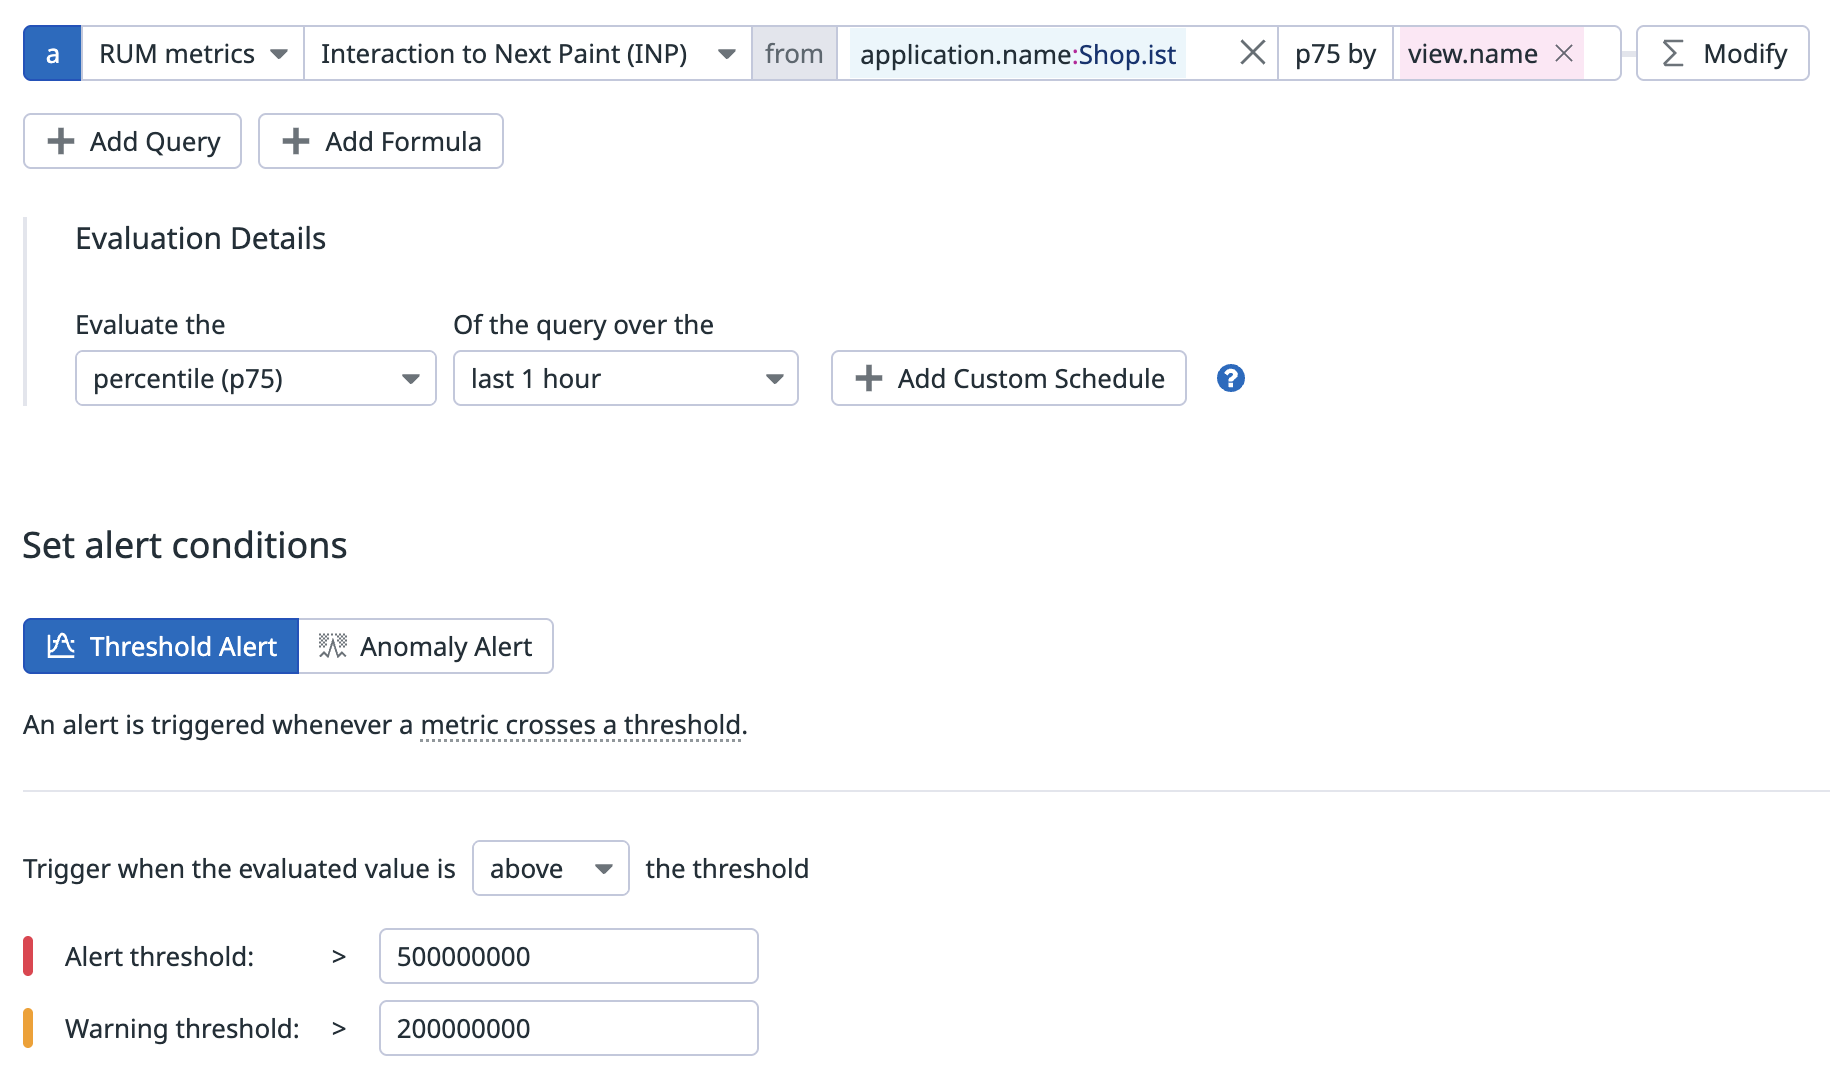
Real User Monitoring measures, calculates, and scores application performance as Core Web Vitals and Mobile Vitals. For example, Interaction to Next Paint (INP) measures responsiveness by tracking the time from a user interaction to the next paint. A widely used benchmark is 200 milliseconds or less for good responsiveness.
This example shows a RUM monitor for the INP metric filtered to a specific application (for example, Shop.ist) and grouped by view name to track performance across different pages. Grouping by view name helps pinpoint which pages have performance issues.
This example monitor warns when INP exceeds 200 milliseconds and alerts when INP exceeds 500 milliseconds. With metric-based monitors, you can also use anomaly detection to help identify when performance metrics deviate from normal patterns, or use forecast alerts to predict when thresholds might be breached.
Further reading
Additional helpful documentation, links, and articles:


