- Agents
- Essentials
- Getting Started
- Agent
- API
- APM Tracing
- Containers
- Dashboards
- Database Monitoring
- Datadog
- Datadog Site
- DevSecOps
- Incident Management
- Integrations
- Internal Developer Portal
- Logs
- Monitors
- Notebooks
- OpenTelemetry
- Profiler
- Search
- Session Replay
- Security
- Serverless for AWS Lambda
- Software Delivery
- Synthetic Monitoring and Testing
- Tags
- Workflow Automation
- Learning Center
- Support
- Glossary
- Standard Attributes
- Guides
- Agent
- Integrations
- Extend Datadog
- Authorization
- DogStatsD
- Custom Checks
- Integrations
- Build an Integration with Datadog
- Create an Agent-based Integration
- Create an API-based Integration
- Create a Log Pipeline
- Integration Assets Reference
- Build a Marketplace Offering
- Create an Integration Dashboard
- Create a Monitor Template
- Create a Cloud SIEM Detection Rule
- Install Agent Integration Developer Tool
- Service Checks
- Community
- Guides
- OpenTelemetry
- Administrator's Guide
- API
- Partners
- Datadog Mobile App
- DDSQL Reference
- CoScreen
- CoTerm
- Remote Configuration
- Cloudcraft (Standalone)
- In The App
- Dashboards
- Notebooks
- DDSQL Editor
- Reference Tables
- Sheets
- Monitors and Alerting
- Service Level Objectives
- Metrics
- Watchdog
- Bits AI
- Internal Developer Portal
- Error Tracking
- Change Tracking
- Event Management
- Incident Response
- Actions & Remediations
- Infrastructure
- Cloudcraft
- Resource Catalog
- Universal Service Monitoring
- End User Device Monitoring
- Hosts
- Containers
- Processes
- Serverless
- Network Monitoring
- Storage Management
- Cloud Cost
- Application Performance
- APM
- Continuous Profiler
- Database Monitoring
- Agent Integration Overhead
- Setup Architectures
- Setting Up Postgres
- Setting Up MySQL
- Setting Up SQL Server
- Setting Up Oracle
- Setting Up Amazon DocumentDB
- Setting Up MongoDB
- Setting Up ClickHouse
- Connecting DBM and Traces
- Data Collected
- Exploring Database Hosts
- Exploring Query Metrics
- Exploring Query Samples
- Exploring Database Schemas
- Exploring Recommendations
- Troubleshooting
- Guides
- Data Streams Monitoring
- Data Observability
- Digital Experience
- Real User Monitoring
- Synthetic Testing and Monitoring
- Continuous Testing
- Experiments
- Product Analytics
- Session Replay
- Software Delivery
- CI Visibility
- CD Visibility
- Deployment Gates
- Test Optimization
- Code Coverage
- PR Gates
- DORA Metrics
- Feature Flags
- Developer Integrations
- Security
- Security Overview
- Cloud SIEM
- Code Security
- Cloud Security
- App and API Protection
- AI Guard
- Workload Protection
- Sensitive Data Scanner
- AI Observability
- Log Management
- Observability Pipelines
- Configuration
- Sources
- Processors
- Destinations
- Packs
- Akamai CDN
- Amazon CloudFront
- Amazon VPC Flow Logs
- AWS Application Load Balancer Logs
- AWS CloudTrail
- AWS Elastic Load Balancer Logs
- AWS Network Load Balancer Logs
- Cisco ASA
- Cloudflare
- F5
- Fastly
- Fortinet Firewall
- HAProxy Ingress
- Istio Proxy
- Juniper SRX Firewall Traffic Logs
- Netskope
- NGINX
- Okta
- Palo Alto Firewall
- Windows XML
- ZScaler ZIA DNS
- Zscaler ZIA Firewall
- Zscaler ZIA Tunnel
- Zscaler ZIA Web Logs
- Search Syntax
- Scaling and Performance
- Monitoring and Troubleshooting
- Guides and Resources
- Log Management
- CloudPrem
- Administration
- Account Management
- Data Security
- Help
Watchdog Insights for RUM
Overview
Datadog Real User Monitoring (RUM) offers Watchdog Insights to help you navigate to the root cause of problems with contextual insights in the RUM Explorer. Watchdog Insights complement your expertise and instincts by recommending outliers and potential performance bottlenecks impacting a subset of users.
For more information, see Watchdog Insights.
Explore collected insights
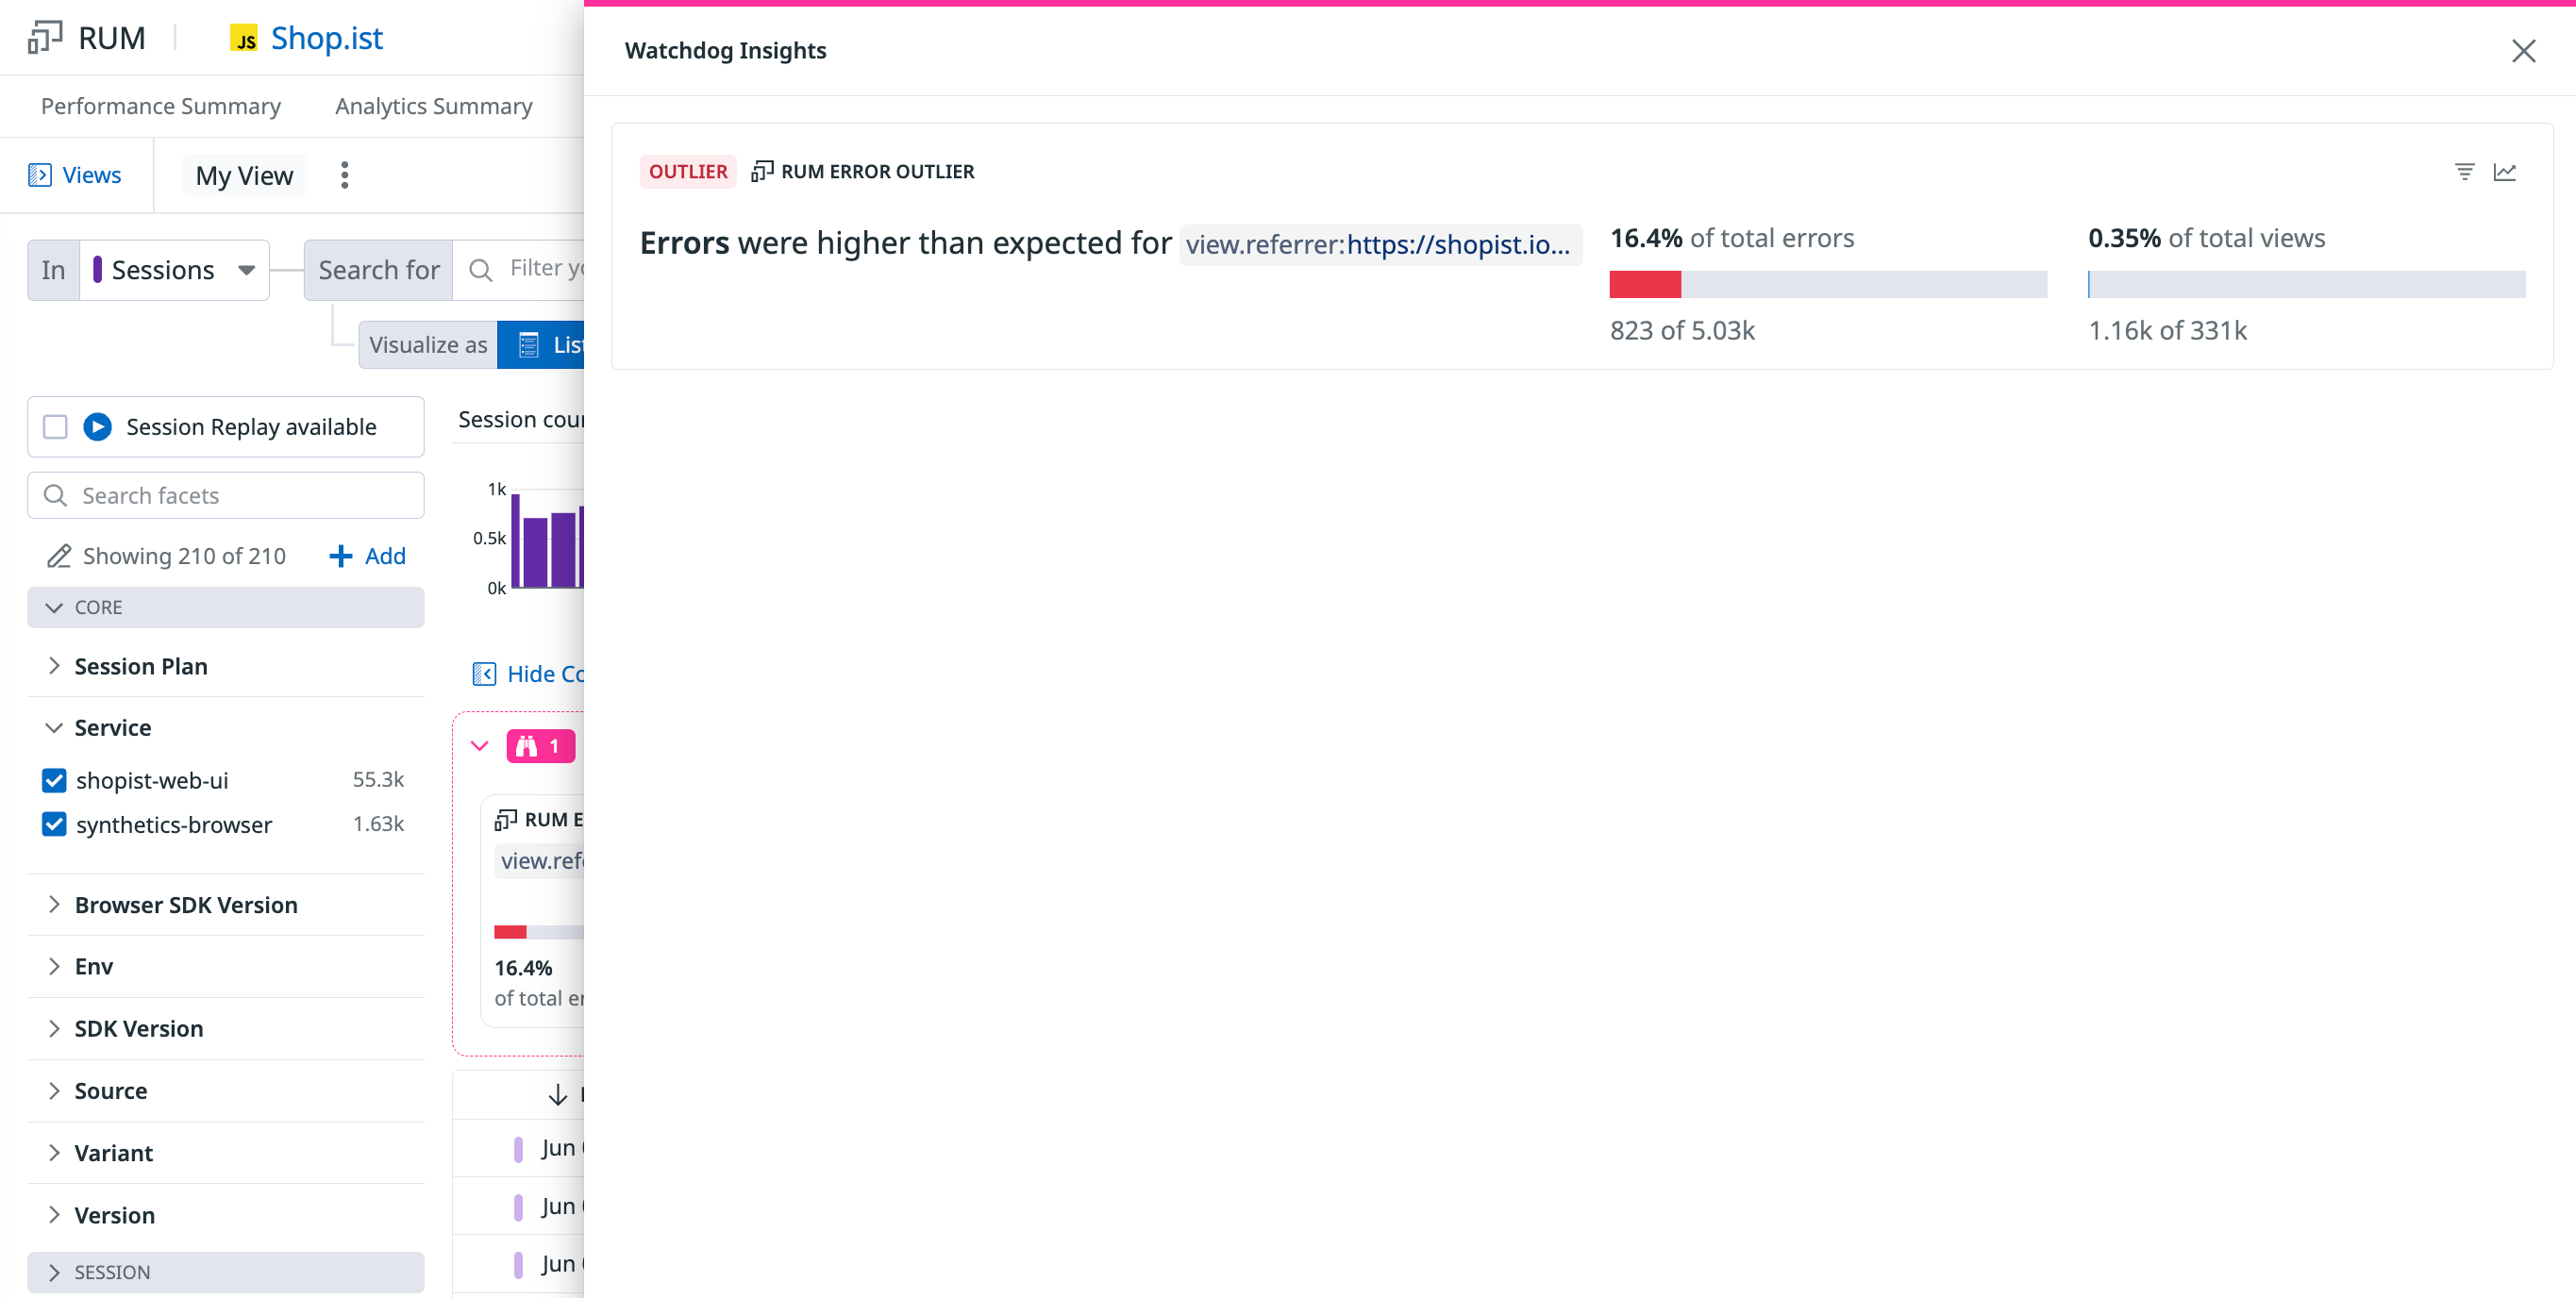
The pink Watchdog Insights banner appears in the RUM Explorer and displays insights about the search query over a period of time. This example demonstrates how Watchdog Insights surfaces issues in a deployed application instance of view.url_host:www.shopist.io, which caused a certain amount of errors in a given time range (for example, the past day).
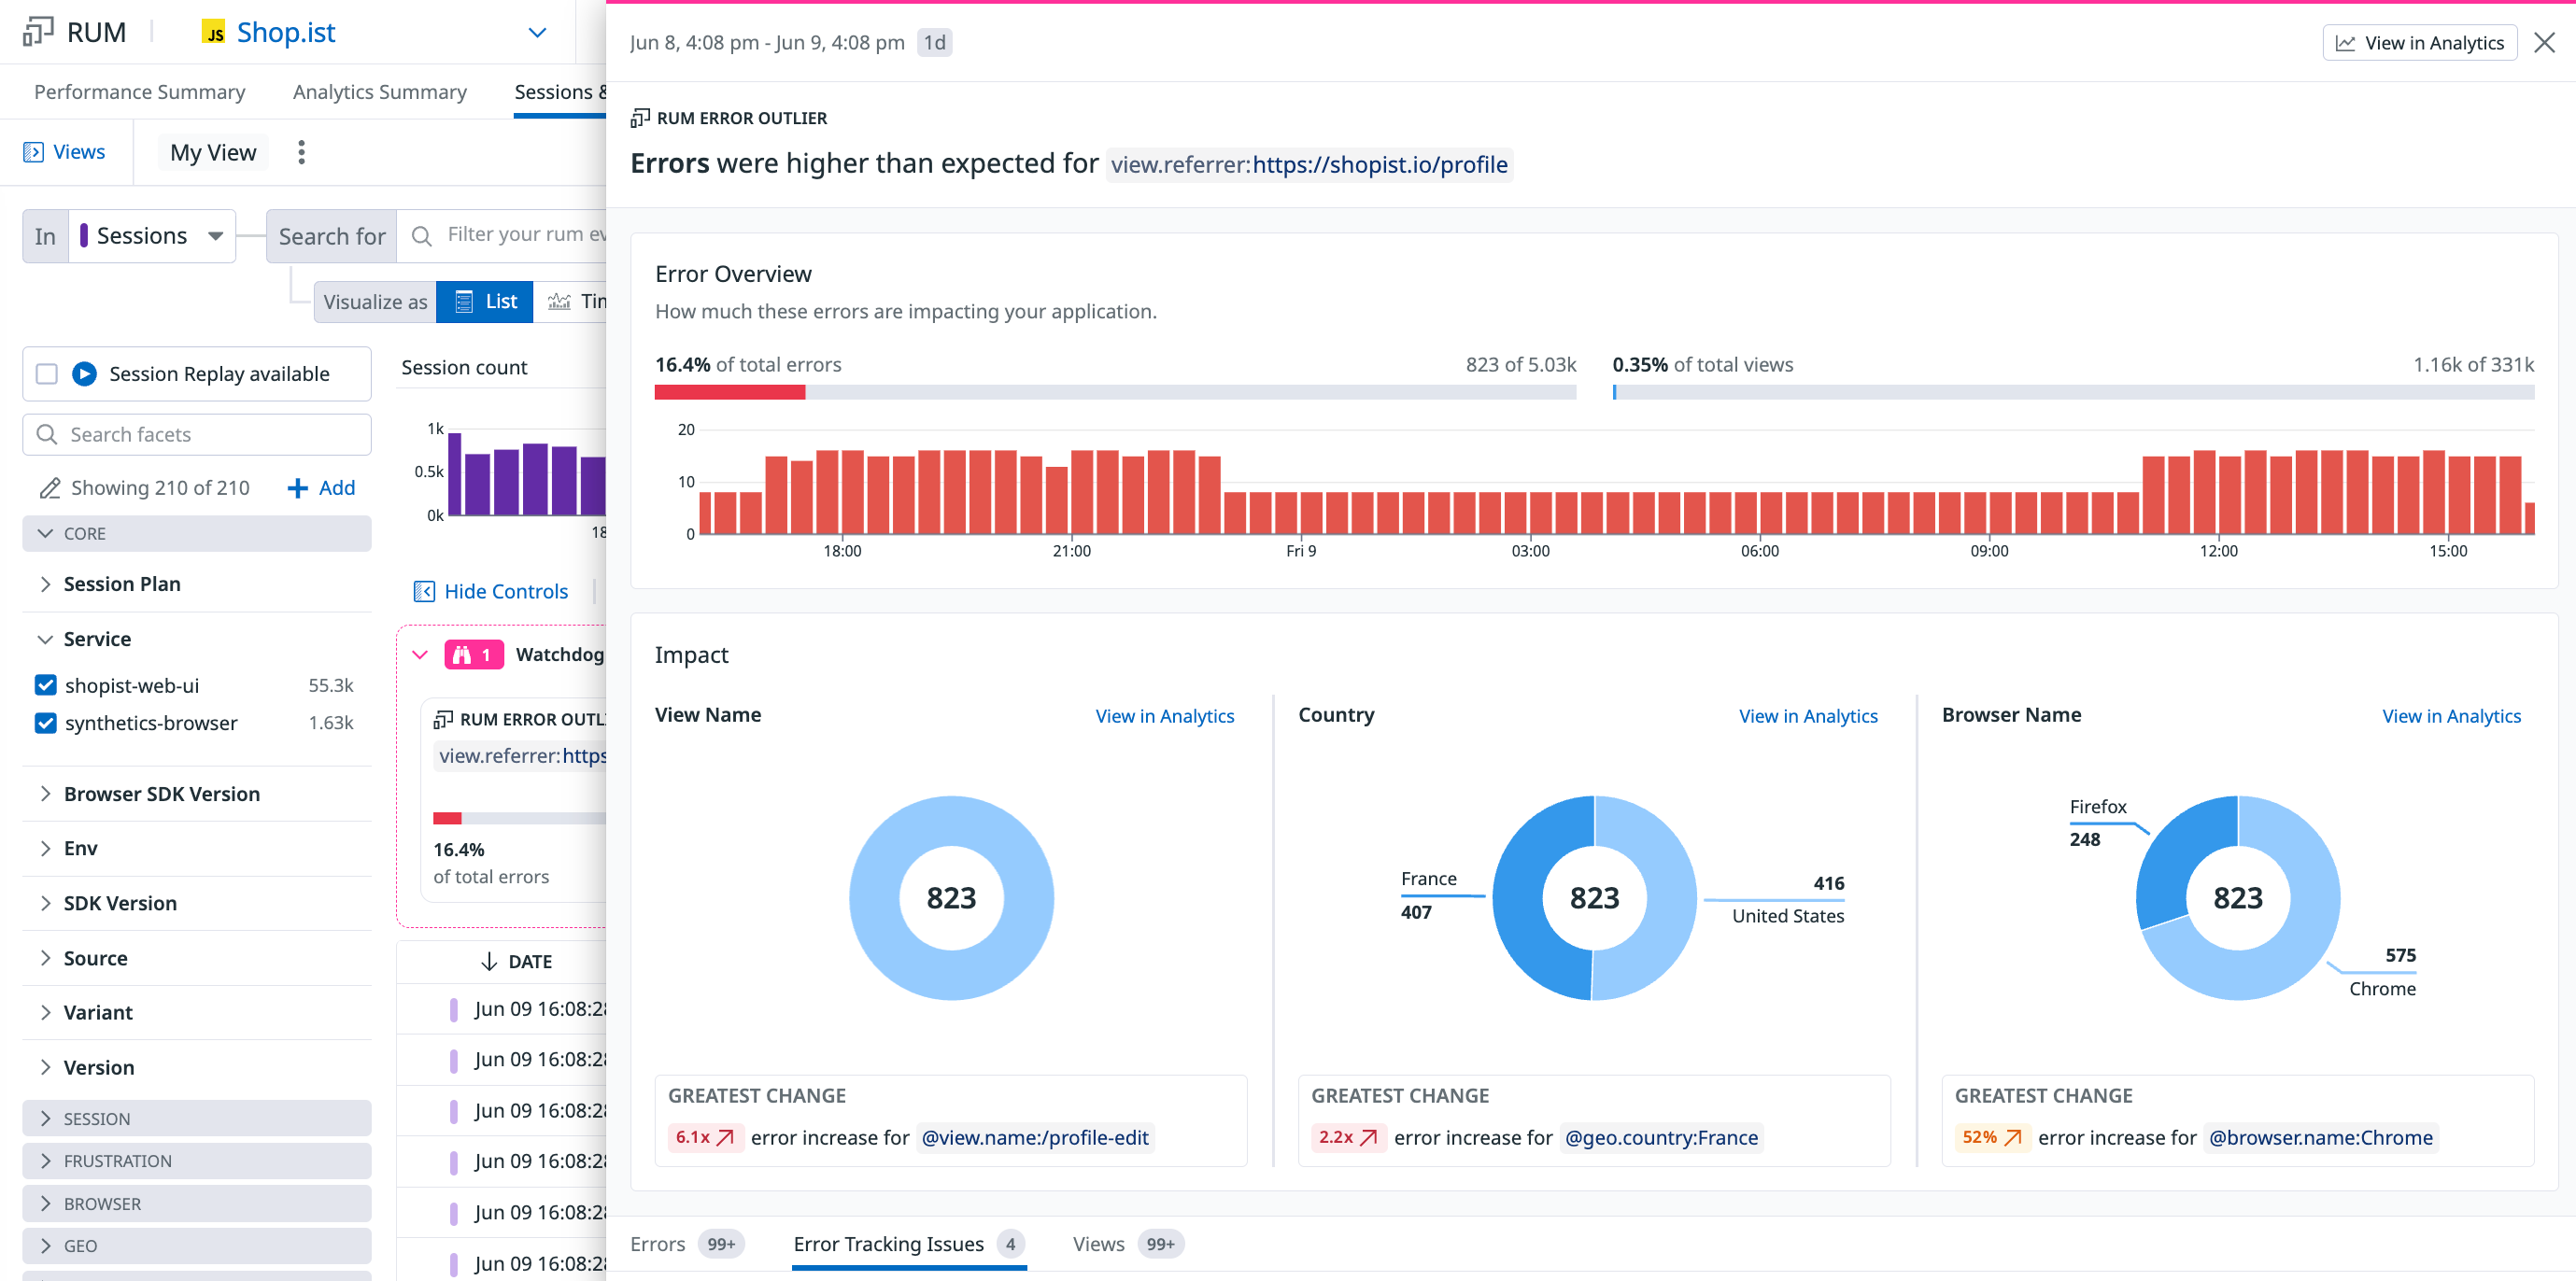
Click on an error or latency outlier to interact with the visualizations embedded in the side panel and find views from the list of impacted events. Click View all to see all outstanding error outliers in a side panel.
Hover over a card in the banner and click Filter on Insight to add the anomalous insight behavior to your search query. For example, you can hone in on a particular view path or a specific continent like North America.
Click View in Analytics to automatically set the Group into fields formulas and select the Visualize as type under the search query to reflect the card’s outlier behavior. For example, you can create a timeseries graph about an unusually high error rate on a Synthetic test by using the synthetics.test_id in a search formula and export it into a monitor or dashboard.
Error outliers
Error outliers display fields such as faceted tags or attributes that contain characteristics of errors that match the current search query. Statistically overrepresented key:value pairs among errors can provide hints into the root cause of issues. Typical examples of error outliers include env:staging, version:1234, and browser.name:Chrome.
In the banner card view, you can see:
- The field name
- The proportion of total errors and overall RUM events that the field contributes to
- Related tags
In the full side panel, you can see a timeseries graph about the total number of RUM errors with the field along with a impact pie charts and a list of RUM events that contain the field.
Latency outliers
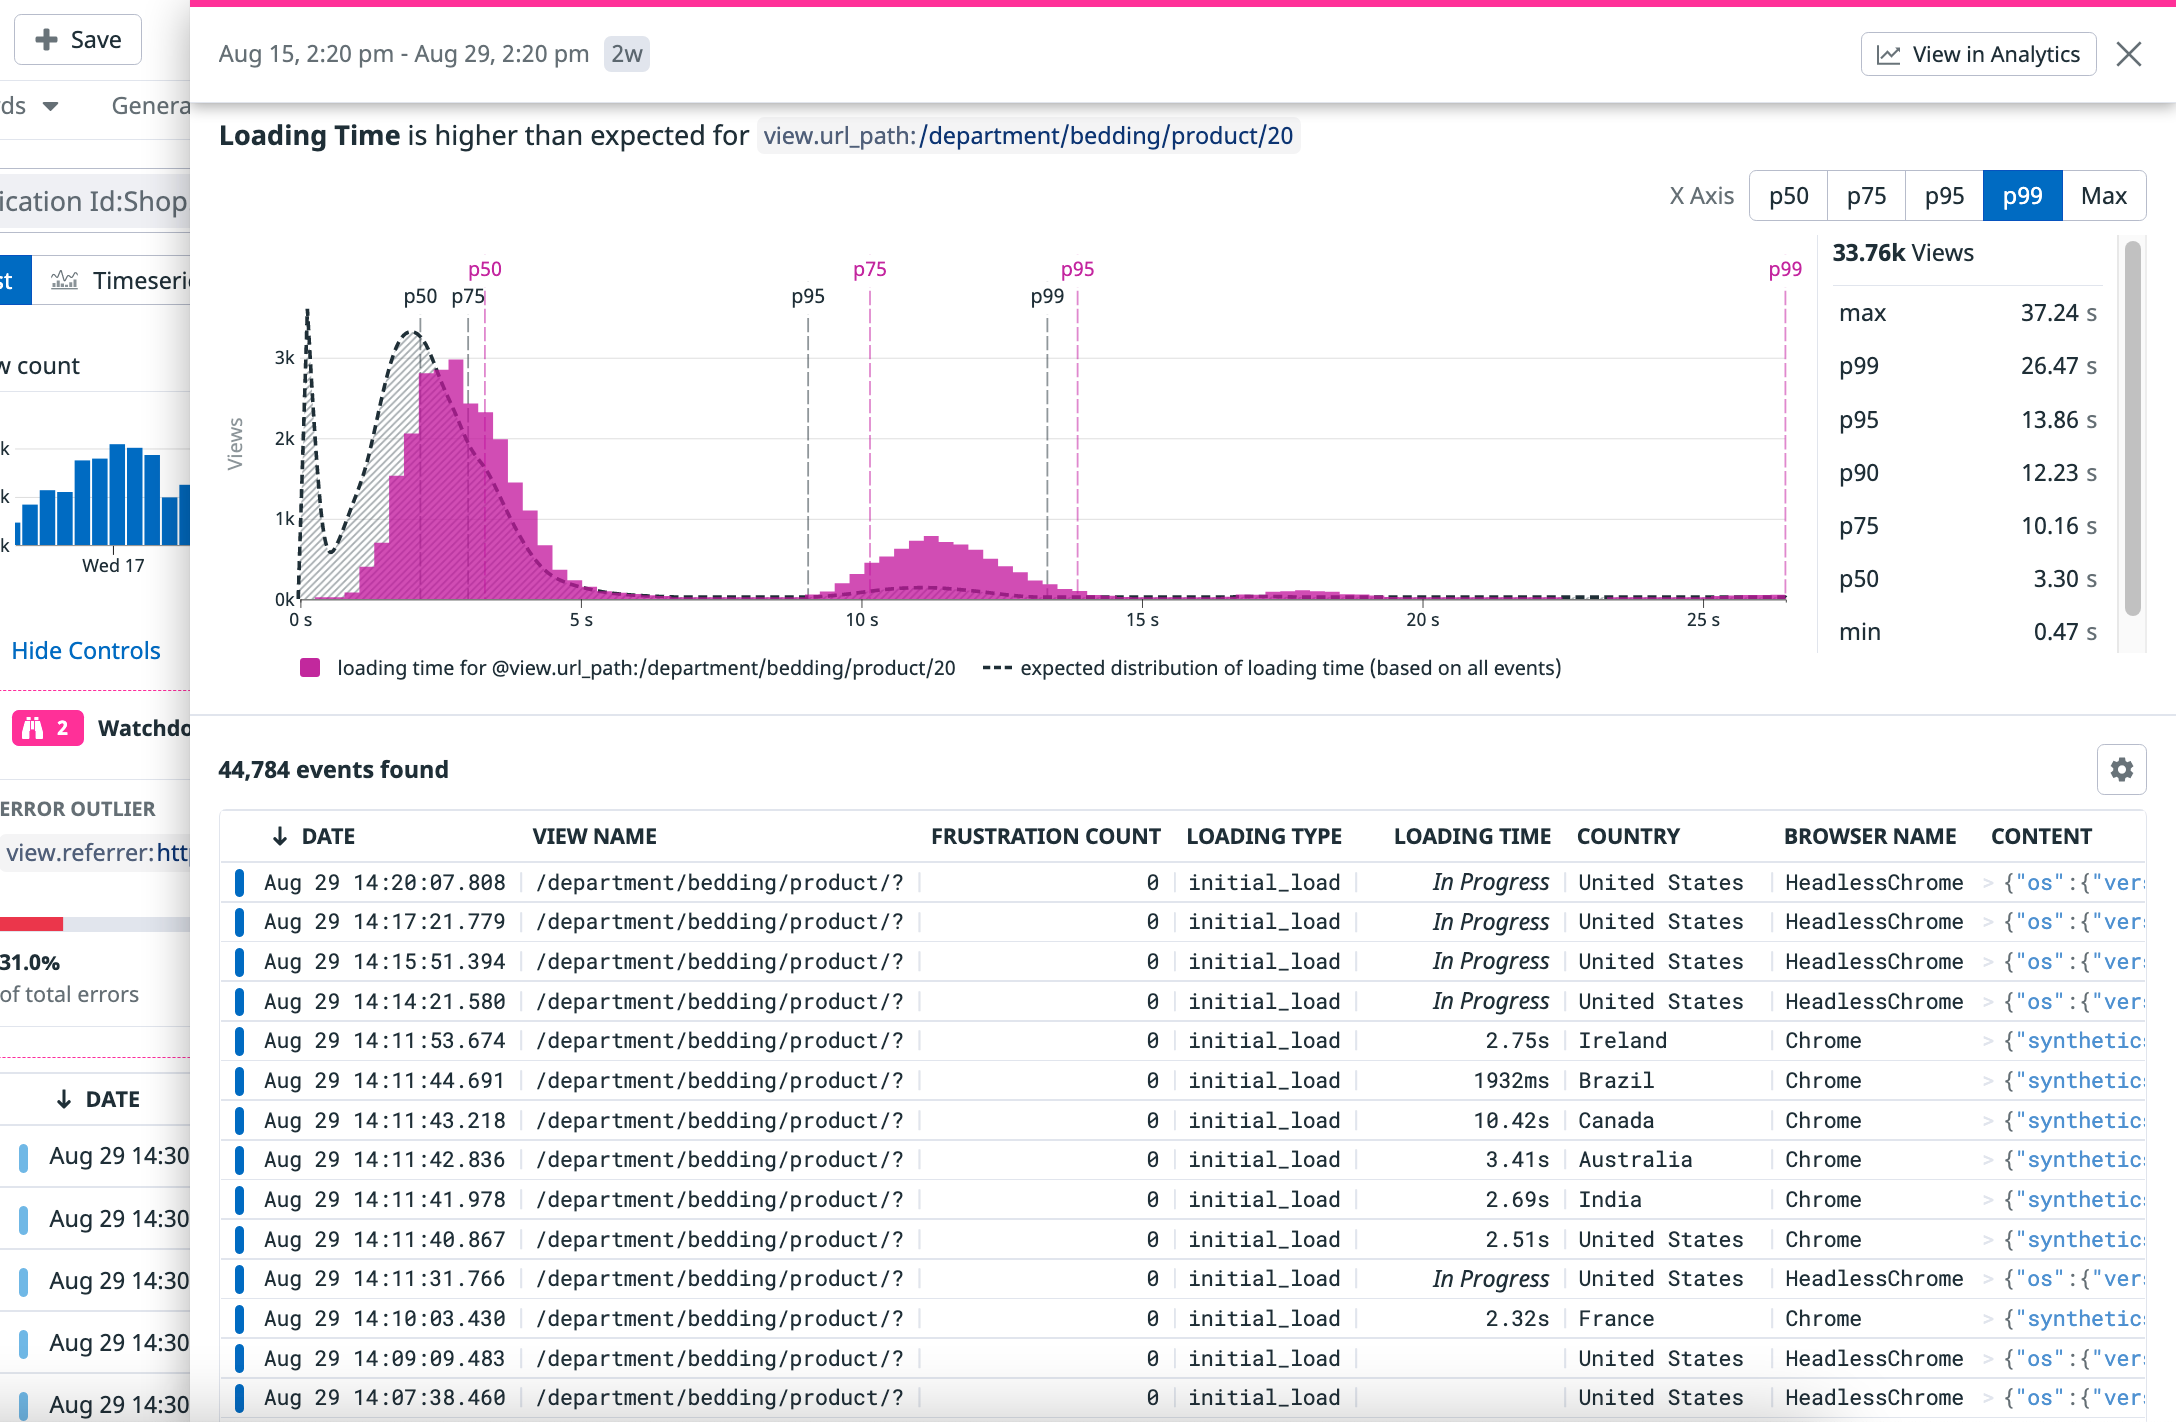
Latency outliers display fields such as faceted tags or attributes that are associated with performance bottlenecks that match the current search query. key:value pairs with worse performance than the baseline can provide hints into the performance bottlenecks among a subset of real users.
Latency outliers are computed for Core Web Vitals such as First Contentful Paint, First Input Delay, Cumulative Layout Shift, and Loading Time. For more information, see Monitoring Page Performance.
In the banner card view, you can see:
- The field name
- The performance telemetry value containing the field and the baseline for the rest of the data
In the full side panel, you can see a timeseries graph about the performance telemetry with an X axis of increments of p50, p75, p99, and max, along with a list of RUM events that contain the field.
You can begin your investigation for the root cause of a performance issue in this timeseries graph.
Further Reading
Additional helpful documentation, links, and articles:


