- Agents
- Essentials
- Getting Started
- Agent
- API
- APM Tracing
- Containers
- Dashboards
- Database Monitoring
- Datadog
- Datadog Site
- DevSecOps
- Incident Management
- Integrations
- Internal Developer Portal
- Logs
- Monitors
- Notebooks
- OpenTelemetry
- Profiler
- Search
- Session Replay
- Security
- Serverless for AWS Lambda
- Software Delivery
- Synthetic Monitoring and Testing
- Tags
- Workflow Automation
- Learning Center
- Support
- Glossary
- Standard Attributes
- Guides
- Agent
- Integrations
- Extend Datadog
- Authorization
- DogStatsD
- Custom Checks
- Integrations
- Build an Integration with Datadog
- Create an Agent-based Integration
- Create an API-based Integration
- Create a Log Pipeline
- Integration Assets Reference
- Build a Marketplace Offering
- Create an Integration Dashboard
- Create a Monitor Template
- Create a Cloud SIEM Detection Rule
- Install Agent Integration Developer Tool
- Service Checks
- Community
- Guides
- OpenTelemetry
- Administrator's Guide
- API
- Partners
- Datadog Mobile App
- DDSQL Reference
- CoScreen
- CoTerm
- Remote Configuration
- Cloudcraft (Standalone)
- In The App
- Dashboards
- Notebooks
- DDSQL Editor
- Reference Tables
- Sheets
- Monitors and Alerting
- Service Level Objectives
- Metrics
- Watchdog
- Bits AI
- Internal Developer Portal
- Error Tracking
- Change Tracking
- Event Management
- Incident Response
- Actions & Remediations
- Infrastructure
- Cloudcraft
- Resource Catalog
- Universal Service Monitoring
- End User Device Monitoring
- Hosts
- Containers
- Processes
- Serverless
- Network Monitoring
- Storage Management
- Cloud Cost
- Application Performance
- APM
- Continuous Profiler
- Database Monitoring
- Agent Integration Overhead
- Setup Architectures
- Setting Up Postgres
- Setting Up MySQL
- Setting Up SQL Server
- Setting Up Oracle
- Setting Up Amazon DocumentDB
- Setting Up MongoDB
- Setting Up ClickHouse
- Connecting DBM and Traces
- Data Collected
- Exploring Database Hosts
- Exploring Query Metrics
- Exploring Query Samples
- Exploring Database Schemas
- Exploring Recommendations
- Troubleshooting
- Guides
- Data Streams Monitoring
- Data Observability
- Digital Experience
- Real User Monitoring
- Synthetic Testing and Monitoring
- Continuous Testing
- Experiments
- Product Analytics
- Session Replay
- Software Delivery
- CI Visibility
- CD Visibility
- Deployment Gates
- Test Optimization
- Code Coverage
- PR Gates
- DORA Metrics
- Feature Flags
- Developer Integrations
- Security
- Security Overview
- Cloud SIEM
- Code Security
- Cloud Security
- App and API Protection
- AI Guard
- Workload Protection
- Sensitive Data Scanner
- AI Observability
- Log Management
- Observability Pipelines
- Configuration
- Sources
- Processors
- Destinations
- Packs
- Akamai CDN
- Amazon CloudFront
- Amazon VPC Flow Logs
- AWS Application Load Balancer Logs
- AWS CloudTrail
- AWS Elastic Load Balancer Logs
- AWS Network Load Balancer Logs
- Cisco ASA
- Cloudflare
- F5
- Fastly
- Fortinet Firewall
- HAProxy Ingress
- Istio Proxy
- Juniper SRX Firewall Traffic Logs
- Netskope
- NGINX
- Okta
- Palo Alto Firewall
- Windows XML
- ZScaler ZIA DNS
- Zscaler ZIA Firewall
- Zscaler ZIA Tunnel
- Zscaler ZIA Web Logs
- Search Syntax
- Scaling and Performance
- Monitoring and Troubleshooting
- Guides and Resources
- Log Management
- CloudPrem
- Administration
- Account Management
- Data Security
- Help
Investigate Slow Traces or Endpoints
If your application is showing performance problems in production, integrating distributed tracing with code stack trace benchmarks from profiling is a powerful way to identify the performance bottlenecks. Application processes that have both APM distributed tracing and continuous profiler enabled are automatically linked.
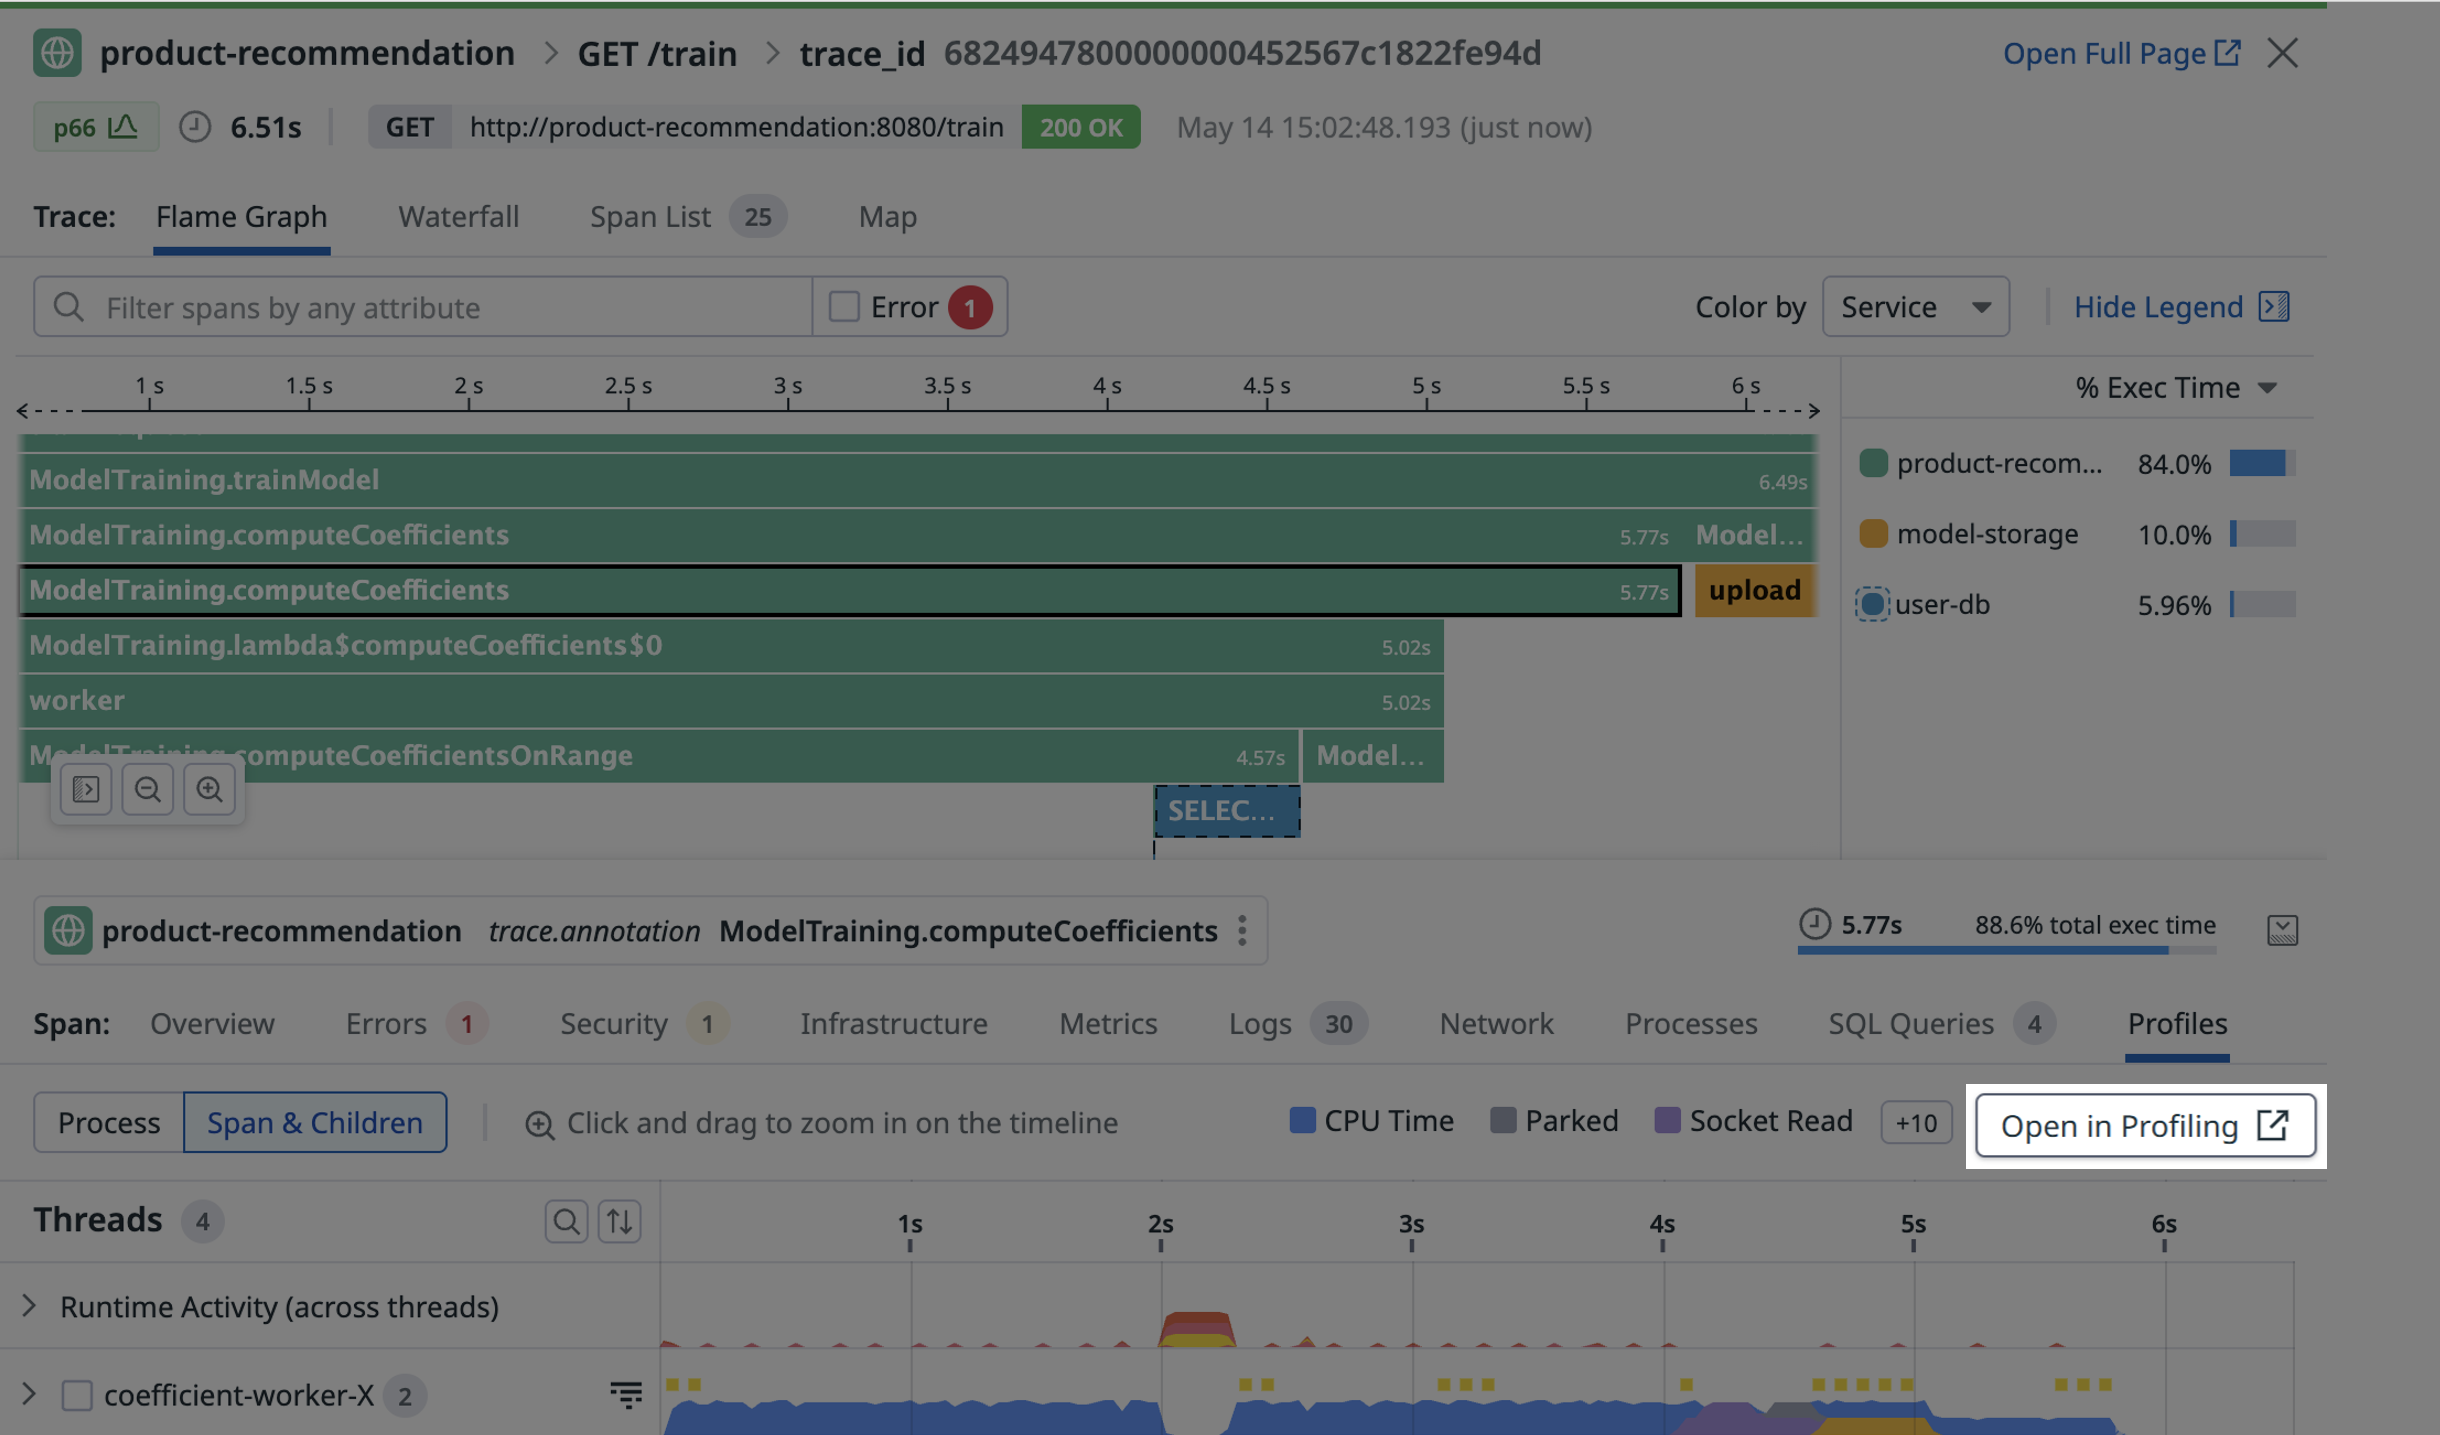
You can move directly from span information to profiling data on the Profiles tab, and find specific lines of code related to performance issues. Similarly, you can also debug slow and resource consuming endpoints directly in the Profiling UI.
Identify code performance issues in slow traces
Prerequisites
The Trace to Profiling integration is enabled by default when you turn on profiling for your Java service on Linux and macOS. The feature is not available on Windows.
For manually instrumented code, continuous profiler requires scope activation of spans:
final Span span = tracer.buildSpan("ServicehandlerSpan").start();
try (final Scope scope = tracer.activateSpan(span)) { // mandatory for Datadog continuous profiler to link with span
    // worker thread impl
  } finally {
    // Step 3: Finish Span when work is complete
    span.finish();
  }
It's highly recommended to use the Datadog profiler instead of Java Flight Recorder (JFR).
The Trace to Profiling integration is enabled when you:
- Upgrade
dd-trace-pyto version 2.12.0+, 2.11.4+, or 2.10.7+. - Set environment variable
DD_PROFILING_TIMELINE_ENABLEDtotrue
The Trace to Profiling integration is enabled by default when you turn on profiling for your Ruby service and update
dd-trace-rb to 1.22.0+.The Trace to Profiling integration is enabled by default when you turn on profiling for your Node.js service on Linux and macOS. The feature is not available on Windows.
Requires dd-trace-js 5.11.0+, 4.35.0+, and 3.56.0+.
The Trace to Profiling integration is enabled when you turn on profiling for your Go service and set the environment variables below:
os.Setenv("DD_PROFILING_EXECUTION_TRACE_ENABLED", "true")
os.Setenv("DD_PROFILING_EXECUTION_TRACE_PERIOD", "15m")
Setting these variables will record up to 1 minute (or 5 MiB) of execution tracing data every 15 minutes.
You can find this data:
- In the Profile List by adding
go_execution_traced:yesto your search query. Click on a profile to view the Profile Timeline. To go even deeper, download the profile and usego tool traceor gotraceui to view the containedgo.tracefiles. - In the Trace Explorer by adding
@go_execution_traced:yes(note the@) to your search query. Click on a span and then select the Profiles tab to view the Span Timeline.
While recording execution traces, your application may observe an increase in CPU usage similar to a garbage collection. Although this should not have a significant impact for most applications, Go 1.21 includes patches to eliminate this overhead.
This capability requires dd-trace-go version 1.37.0+ (1.52.0+ for timeline view) and works best with Go version 1.18 or later (1.21 or later for timeline view).
The Trace to Profiling integration is enabled by default when you turn on profiling for your .NET service.
This capability requires dd-trace-dotnet version 2.30.0+.
The Trace to Profiling integration is enabled when you turn on profiling for your PHP service and meet the following criteria:
- You are on
dd-trace-phpversion 0.98+ - You set the environment variable
DD_PROFILING_TIMELINE_ENABLED=1or INI settingdatadog.profiling.timeline_enabled=1
Span execution timeline view
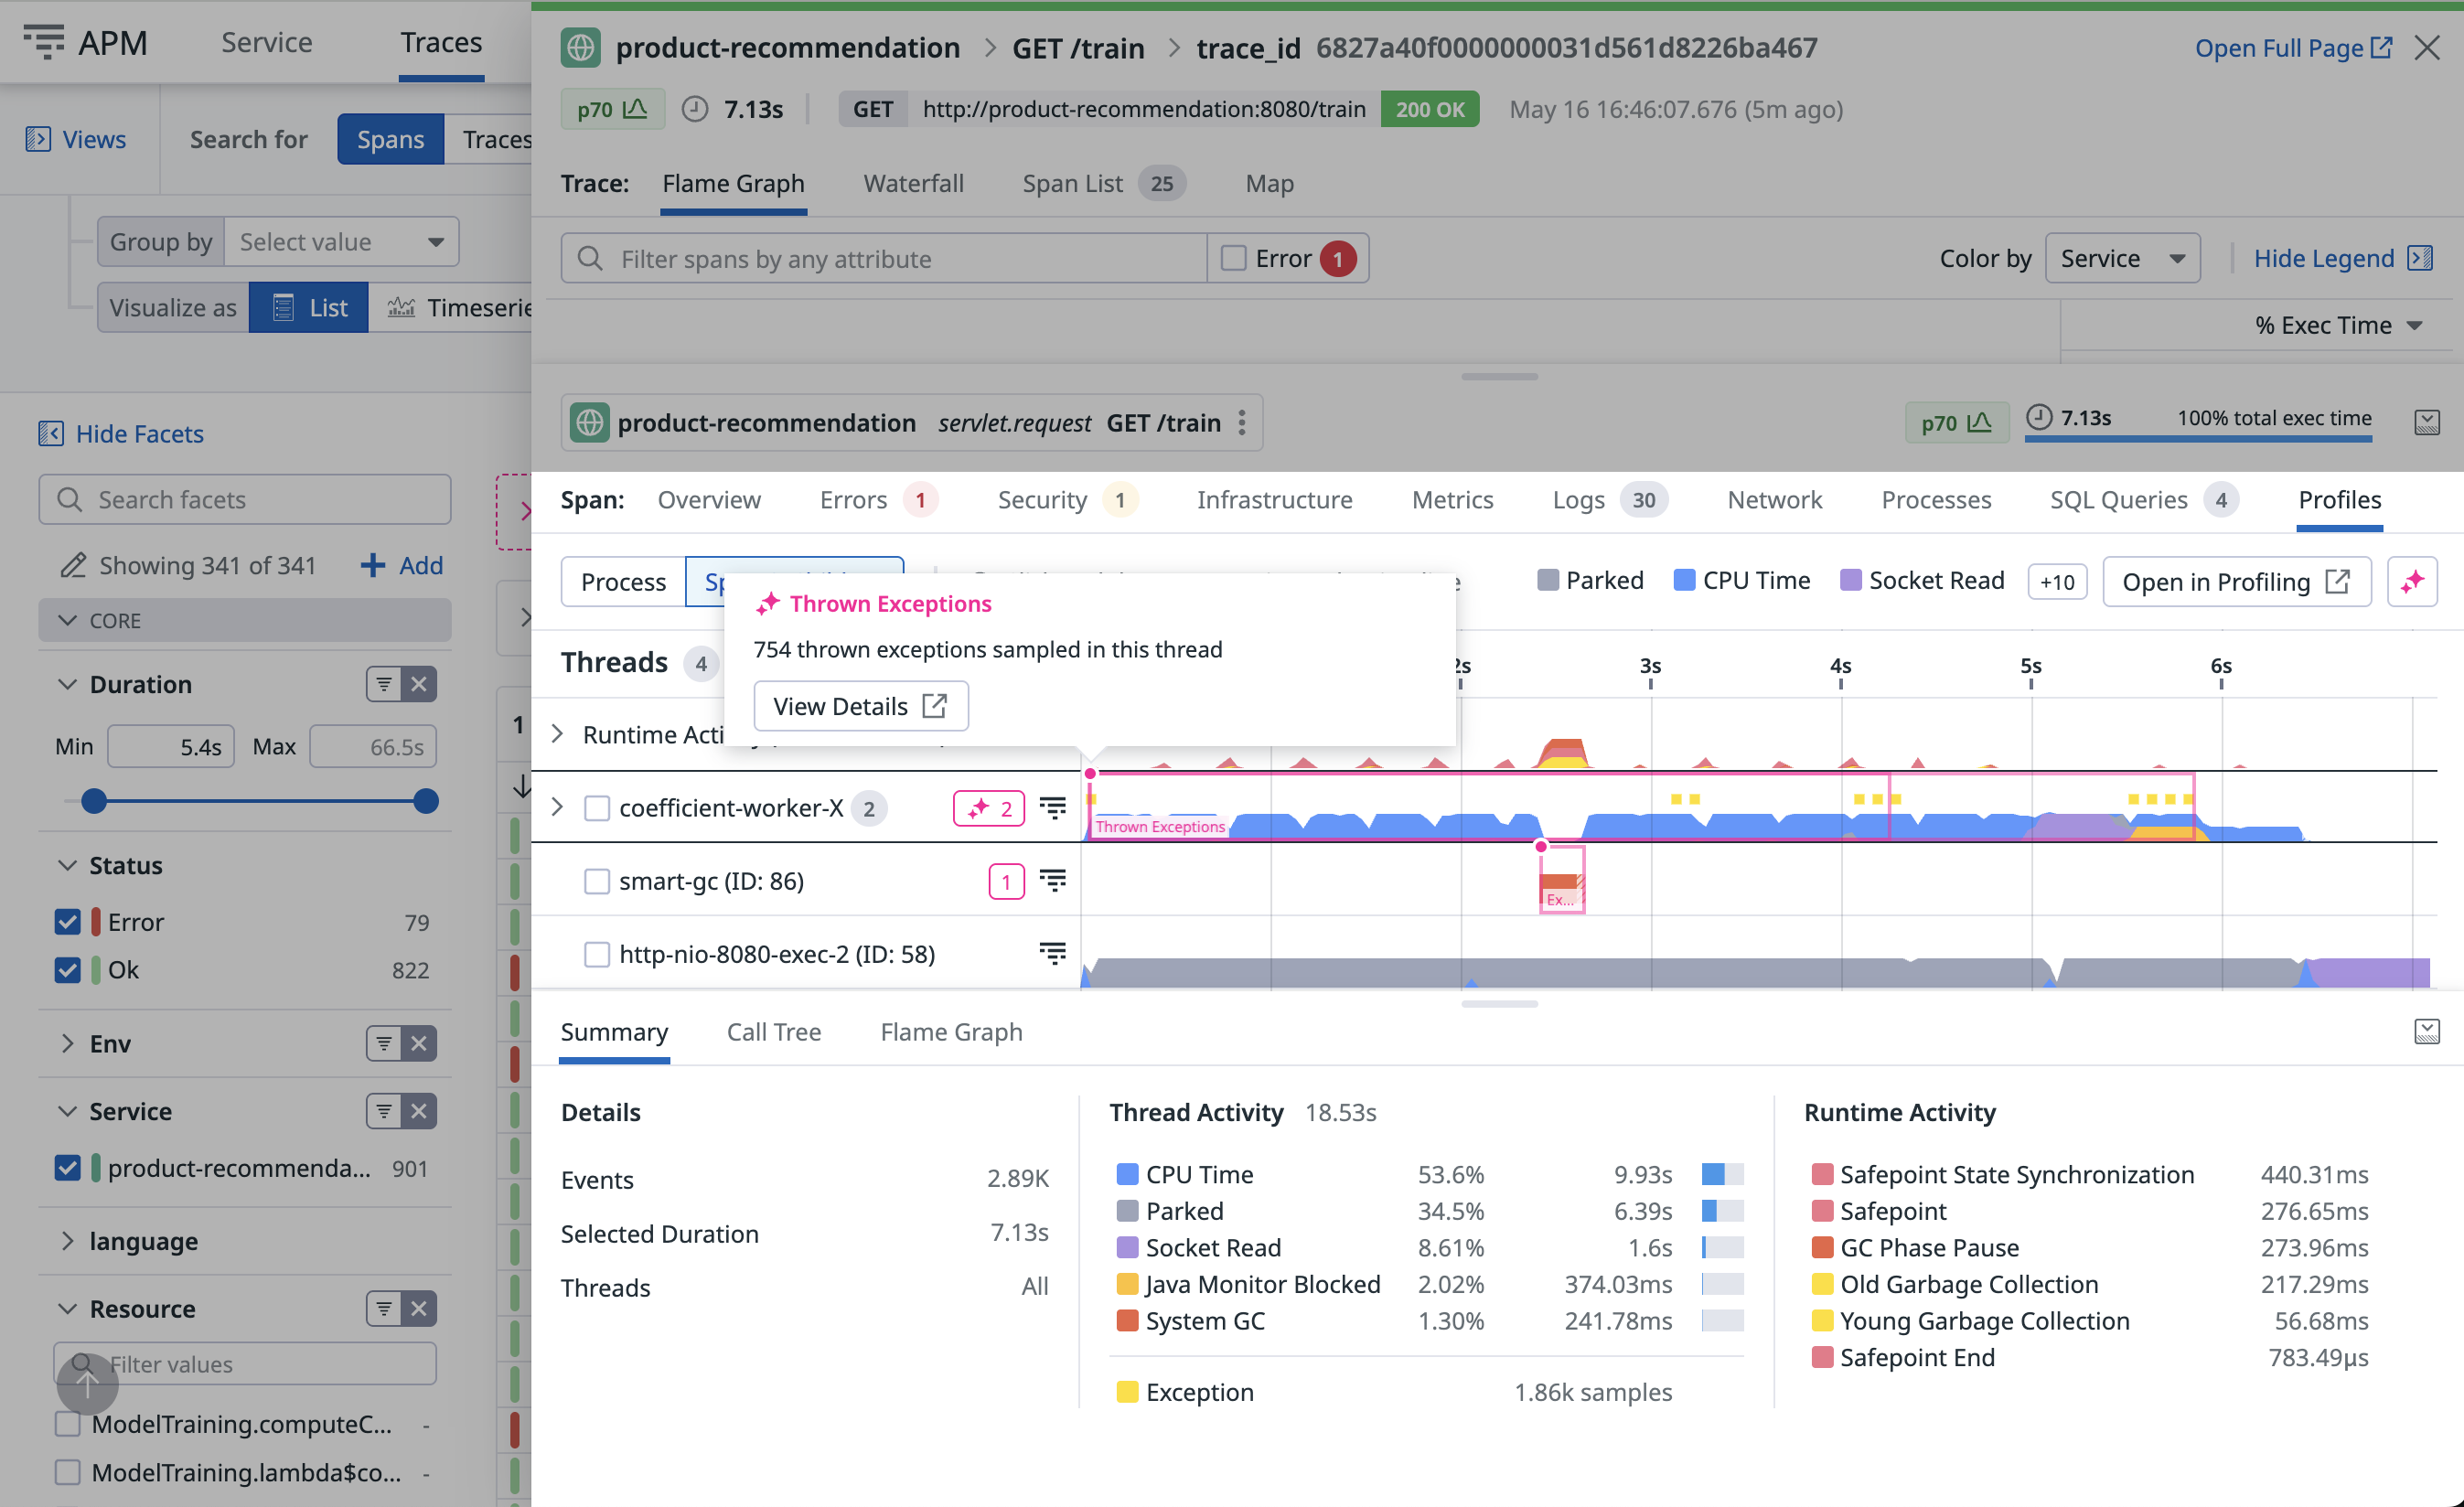
The timeline view surfaces time-based patterns and work distribution over the period of the span. It provides a visual breakdown of how threads contributed to the request over time.
With the span timeline view, you can:
- Isolate time-consuming methods
- Sort out complex interactions between threads
- Surface runtime activity that impacted the request
- Use Automated Analysis to highlight performance issues directly in the view, such as oversized thread pools or GC contention
Depending on the runtime and language, the lanes vary:
Each lane represents a thread. Threads from a common pool are grouped together. You can expand the pool to view details for each thread.
Lanes on top are runtime activities that may add extra latency. They can be unrelated to the request itself.
For additional information about debugging slow p95 requests or timeouts using the timeline, see the blog post Understanding Request Latency with Profiling.
See prerequisites to learn how to enable this feature for Python.
Each lane represents a thread. Threads from a common pool are grouped together. You can expand the pool to view details for each thread.
Each lane represents a goroutine. This includes the goroutine that started the selected span, as well as any goroutines it created and their descendants. Goroutines created by the same go statement are grouped together. You can expand the group to view details for each goroutine.
Lanes on top are runtime activities that may add extra latency. They can be unrelated to the request itself.
For additional information about debugging slow p95 requests or timeouts using the timeline, see the blog post Debug Go Request Latency with Datadog’s Profiling Timeline.
See prerequisites to learn how to enable this feature for Ruby.
Each lane represents a thread. Threads from a common pool are grouped together. You can expand the pool to view details for each thread.
Each lane represents a thread. Threads with the same name are grouped together. You can expand a group to view details for each thread. Note that threads that are explicitly created by code are grouped under Managed Threads.
Lanes on top are runtime activities that may add extra latency. They can be unrelated to the request itself.
See prerequisites to learn how to enable this feature for Node.js.
There is one lane for the JavaScript thread.
Lanes on the top are garbage collector runtime activities that may add extra latency to your request.
See prerequisites to learn how to enable this feature for PHP.
There is one lane for each PHP thread (in PHP NTS, this is only one lane). Fibers that run in this thread are represented in the same lane.
Lanes on the top are runtime activities that may add extra latency to your request, due to file compilation and garbage collection.
Viewing a profile from a trace
From the timeline, click Open in Profiling to see the same data on a new page. From there, you can change the visualization to a flame graph. Click the Focus On selector to define the scope of the data:
- Span & Children scopes the profiling data to the selected span and all descendant spans in the same service.
- Span only scopes the profiling data to the previously selected span.
- Span time period scopes the profiling data to all threads during the time period the span was active.
- Full profile scopes the data to 60 seconds of the whole service process that executed the previously selected span.
Break down code performance by API endpoints
Prerequisites
Endpoint profiling is enabled by default when you turn on profiling for your Java service.
Requires using the Datadog profiler. JFR is not supported.
Endpoint profiling is enabled by default when you turn on profiling for your Python service.
Requires dd-trace-py version 0.54.0+.
Endpoint profiling is enabled by default when you turn on profiling for your Go service.
Requires dd-trace-go version 1.37.0+ and works best with Go version 1.18 or newer.
Endpoint profiling is enabled by default when you turn on profiling for your Ruby service.
Endpoint profiling is enabled by default when you turn on profiling for your Node.js service on Linux and macOS. The feature is not available on Windows.
Requires dd-trace-js version 5.0.0+, 4.24.0+ or 3.45.0+.
Endpoint profiling is enabled by default when you turn on profiling for your .NET service.
Requires dd-trace-dotnet version 2.15.0+.
Endpoint profiling is enabled by default when you turn on profiling for your PHP service.
Requires dd-trace-php version 0.79.0+.
Endpoint profiling
Endpoint profiling allows you to scope your flame graphs by any endpoint of your web service to find endpoints that are slow, latency-heavy, and causing poor end-user experience. These endpoints can be tricky to debug and understand why they are slow. The slowness could be caused by an unintended large amount of resource consumption such as the endpoint consuming lots of CPU cycles.
With endpoint profiling you can:
- Identify the bottleneck methods that are slowing down your endpoint’s overall response time.
- Isolate the top endpoints responsible for the consumption of valuable resources such as CPU, memory, or exceptions. This is particularly helpful when you are generally trying to optimize your service for performance gains.
- Understand if third-party code or runtime libraries are the reason for your endpoints being slow or resource-consumption heavy.
Surface code that impacted your production latency
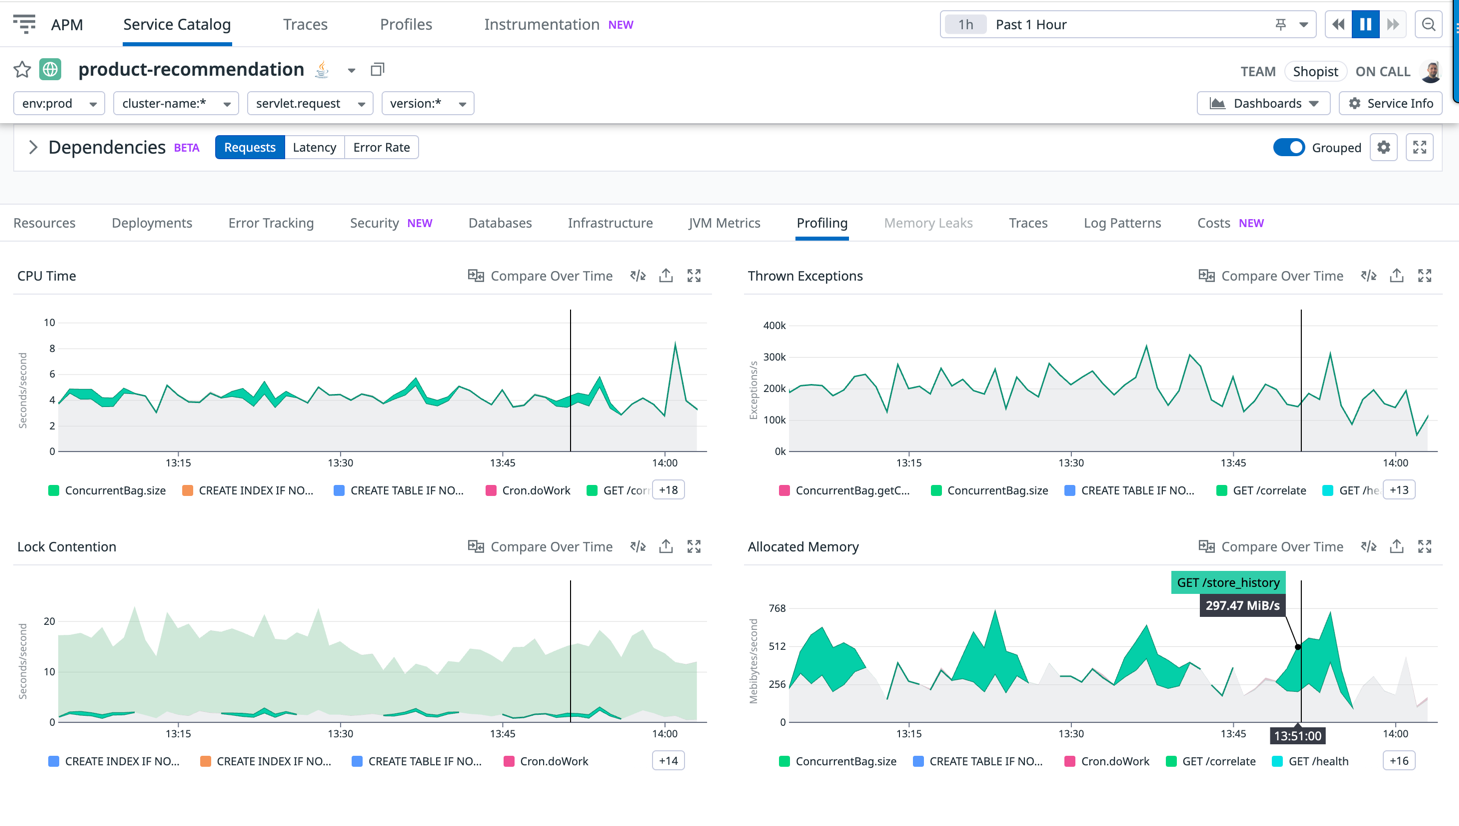
In the APM Service page, use the information in the Profiling tab to correlate a latency or throughput change to a code performance change.
In this example, you can see how latency is linked to a lock contention increase on /GET train that is caused by the following line of code:
Thread.sleep(DELAY_BY.minus(elapsed).toMillis());
Track endpoints that consume the most resources
It is valuable to track top endpoints that are consuming valuable resources such as CPU and wall time. The list can help you identify if your endpoints have regressed or if you have newly introduced endpoints that are consuming drastically more resources, slowing down your overall service.
The following image shows that GET /store_history is periodically impacting this service by consuming 20% of its CPU and 50% of its allocated memory:
Track average resource consumption per request
Select Per endpoint call to see behavior changes even as traffic shifts over time. This is useful for progressive rollout sanity checks or analyzing daily traffic patterns.
The following example shows that CPU per request increased for /GET train:
Further reading
Additional helpful documentation, links, and articles:


