- Essentials
- Getting Started
- Agent
- API
- APM Tracing
- Containers
- Dashboards
- Database Monitoring
- Datadog
- Datadog Site
- DevSecOps
- Incident Management
- Integrations
- Internal Developer Portal
- Logs
- Monitors
- Notebooks
- OpenTelemetry
- Profiler
- Search
- Session Replay
- Security
- Serverless for AWS Lambda
- Software Delivery
- Synthetic Monitoring and Testing
- Tags
- Workflow Automation
- Learning Center
- Support
- Glossary
- Standard Attributes
- Guides
- Agent
- Integrations
- Developers
- Authorization
- DogStatsD
- Custom Checks
- Integrations
- Build an Integration with Datadog
- Create an Agent-based Integration
- Create an API-based Integration
- Create a Log Pipeline
- Integration Assets Reference
- Build a Marketplace Offering
- Create an Integration Dashboard
- Create a Monitor Template
- Create a Cloud SIEM Detection Rule
- Install Agent Integration Developer Tool
- Service Checks
- IDE Plugins
- Community
- Guides
- OpenTelemetry
- Administrator's Guide
- API
- Partners
- Datadog Mobile App
- DDSQL Reference
- CoScreen
- CoTerm
- Remote Configuration
- Cloudcraft (Standalone)
- In The App
- Dashboards
- Notebooks
- DDSQL Editor
- Reference Tables
- Sheets
- Monitors and Alerting
- Service Level Objectives
- Metrics
- Watchdog
- Bits AI
- Internal Developer Portal
- Error Tracking
- Change Tracking
- Event Management
- Incident Response
- Actions & Remediations
- Infrastructure
- Cloudcraft
- Resource Catalog
- Universal Service Monitoring
- End User Device Monitoring
- Hosts
- Containers
- Processes
- Serverless
- Network Monitoring
- Storage Management
- Cloud Cost
- Application Performance
- APM
- Continuous Profiler
- Database Monitoring
- Agent Integration Overhead
- Setup Architectures
- Setting Up Postgres
- Setting Up MySQL
- Setting Up SQL Server
- Setting Up Oracle
- Setting Up Amazon DocumentDB
- Setting Up MongoDB
- Connecting DBM and Traces
- Data Collected
- Exploring Database Hosts
- Exploring Query Metrics
- Exploring Query Samples
- Exploring Database Schemas
- Exploring Recommendations
- Troubleshooting
- Guides
- Data Streams Monitoring
- Data Observability
- Digital Experience
- Real User Monitoring
- Synthetic Testing and Monitoring
- Continuous Testing
- Product Analytics
- Session Replay
- Software Delivery
- CI Visibility
- CD Visibility
- Deployment Gates
- Test Optimization
- Code Coverage
- PR Gates
- DORA Metrics
- Feature Flags
- Security
- Security Overview
- Cloud SIEM
- Code Security
- Cloud Security
- App and API Protection
- AI Guard
- Workload Protection
- Sensitive Data Scanner
- AI Observability
- Log Management
- Observability Pipelines
- Configuration
- Sources
- Processors
- Destinations
- Packs
- Akamai CDN
- Amazon CloudFront
- Amazon VPC Flow Logs
- AWS Application Load Balancer Logs
- AWS CloudTrail
- AWS Elastic Load Balancer Logs
- AWS Network Load Balancer Logs
- Cisco ASA
- Cloudflare
- F5
- Fastly
- Fortinet Firewall
- HAProxy Ingress
- Istio Proxy
- Juniper SRX Firewall Traffic Logs
- Netskope
- NGINX
- Okta
- Palo Alto Firewall
- Windows XML
- ZScaler ZIA DNS
- Zscaler ZIA Firewall
- Zscaler ZIA Tunnel
- Zscaler ZIA Web Logs
- Search Syntax
- Scaling and Performance
- Monitoring and Troubleshooting
- Guides and Resources
- Log Management
- CloudPrem
- Administration
Install the DDOT Collector on Linux
This product is not supported for your selected Datadog site. ().
Support for deploying the DDOT Collector on Linux-based bare-metal hosts and virtual machines is currently in Preview.
Overview
Follow this guide to install the Datadog Distribution of OpenTelemetry (DDOT) Collector on Linux-based bare-metal hosts and virtual machines.
Requirements
To complete this guide, you need the following:
Datadog account:
- Create a Datadog account if you don’t have one.
- Find or create your Datadog API key.
Software:
- A supported Linux distribution (for example, Debian, Ubuntu, CentOS, RHEL, Fedora, SUSE).
curlmust be installed to use the one-line installation script.
Network:
When using the Datadog SDK with OpenTelemetry API support, telemetry is routed to different components depending on the signal source. Ensure the following ports are accessible on your Datadog Agent or Collector:
| Signal Source | Protocol | Port | Destination Component |
|---|---|---|---|
| OTel Metrics and Logs API | OTLP (gRPC/HTTP) | 4317 / 4318 | Datadog Agent OTLP Receiver or DDOT Collector |
| Datadog Tracing | Datadog trace intake | 8126 (TCP) | Datadog Trace Agent |
| Runtime Metrics | DogStatsD | 8125 (UDP) | DogStatsD Server |
Install the Datadog Agent with OpenTelemetry Collector
This installation is required for both Datadog SDK + DDOT and OpenTelemetry SDK + DDOT configurations. While the Datadog SDK implements the OpenTelemetry API, it still requires the DDOT Collector to process and forward OTLP metrics and logs.
Installation
To install the DDOT Collector on a Linux host, use the following one-line installation command:
DD_API_KEY=<DATADOG_API_KEY> DD_SITE="" DD_OTELCOLLECTOR_ENABLED=true DD_AGENT_MAJOR_VERSION=7 DD_AGENT_MINOR_VERSION=75.0-1 bash -c "$(curl -L https://install.datadoghq.com/scripts/install_script_agent7.sh)"
This command installs both the core Datadog Agent package and the DDOT Collector that runs alongside it.
Validation
Run the Agent’s status command to verify installation.
sudo datadog-agent status
A successful installation returns an Agent Status report that begins with Agent information like this:
====================
Agent (v7.x.x)
====================
  Status date: 2025-08-22 18:35:17.449 UTC (1755887717449)
  Agent start: 2025-08-22 18:16:27.004 UTC (1755886587004)
  Pid: 2828211
  Go Version: go1.24.6
  Python Version: 3.12.11
  Build arch: amd64
  Agent flavor: agent
  FIPS Mode: not available
  Log Level: info
There will also be an OTel Agent status section that includes OpenTelemetry information:
==========
OTel Agent
==========

  Status: Running
  Agent Version: 7.x.x
  Collector Version: v0.129.0

  Receiver
  ==========================
    Spans Accepted: 0
    Metric Points Accepted: 1055
    Log Records Accepted: 0

  Exporter
  ==========================
    Spans Sent: 0
    Metric Points Sent: 1055
    Log Records Sent: 0
Configure the Datadog Agent
Enable the DDOT Collector
The configuration file for the Datadog Agent is automatically installed at /etc/datadog-agent/datadog.yaml. The installation script adds the following configuration settings to /etc/datadog-agent/datadog.yaml to enable the DDOT Collector:
datadog-agent.yaml
otelcollector:
  enabled: true
agent_ipc:
  port: 5009
  config_refresh_interval: 60
DDOT automatically binds the OpenTelemetry Collector to ports 4317 (grpc) and 4318 (http) by default.
(Optional) Enable additional Datadog features
Enabling these features may incur additional charges. Review the pricing page and talk to your Customer Success Manager before proceeding.
For a complete list of available options, refer to the fully commented reference file at /etc/datadog-agent/datadog.yaml.example or the sample config_template.yaml file.
When enabling additional Datadog features, always use the Datadog or OpenTelemetry Collector configuration files instead of relying on Datadog environment variables.
Configure the OpenTelemetry Collector
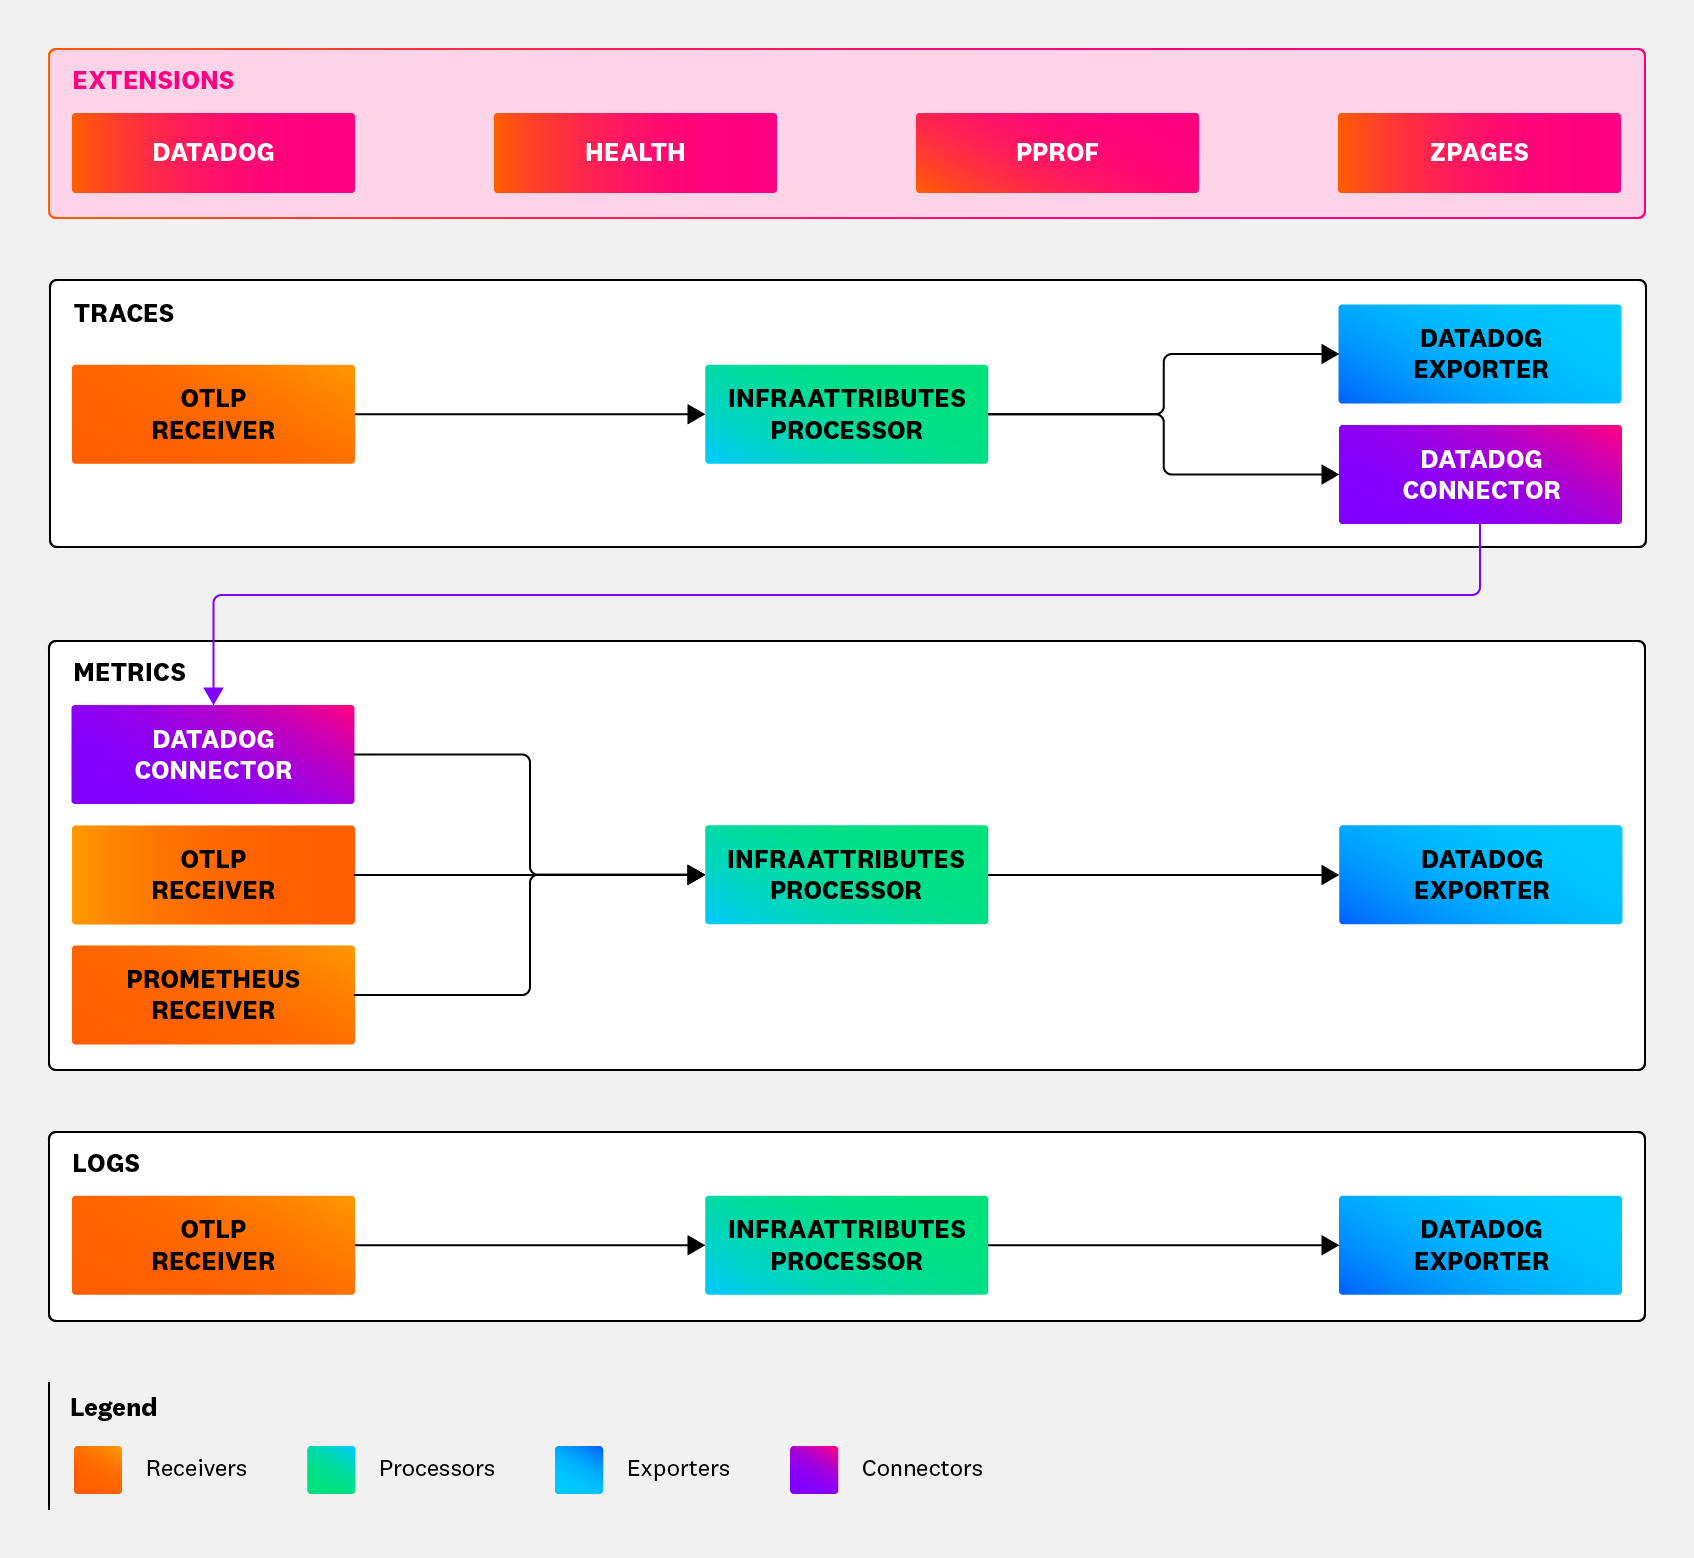
The installation script provides a sample OpenTelemetry Collector configuration at /etc/datadog-agent/otel-config.yaml that you can use as a starting point.
Sample otel-config.yaml file from installation
Sample otel-config.yaml file from installation
Sample otel-config.yaml from installation will look something like this:
otel-config.yaml
receivers:
  prometheus:
    config:
      scrape_configs:
        - job_name: "otelcol"
          scrape_interval: 60s
          static_configs:
            - targets: ["0.0.0.0:8888"]
  otlp:
    protocols:
      grpc:
        endpoint: 0.0.0.0:4317
      http:
        endpoint: 0.0.0.0:4318
exporters:
  debug:
    verbosity: detailed
  datadog:
    api:
      key: <DATADOG_API_KEY>
      site: <DATADOG_SITE>
    sending_queue:
      batch:
        flush_timeout: 10s
processors:
  infraattributes:
    cardinality: 2
connectors:
  datadog/connector:
    traces:
      compute_top_level_by_span_kind: true
      peer_tags_aggregation: true
      compute_stats_by_span_kind: true
service:
  pipelines:
    traces:
      receivers: [otlp]
      processors: [infraattributes]
      exporters: [datadog, datadog/connector]
    metrics:
      receivers: [otlp, datadog/connector, prometheus]
      processors: [infraattributes]
      exporters: [datadog]
    logs:
      receivers: [otlp]
      processors: [infraattributes]
      exporters: [datadog]
Key components
To send telemetry data to Datadog, the following components are defined in the configuration:
Datadog connector
The Datadog connector computes Datadog APM trace metrics.
otel-config.yaml
connectors:
  datadog/connector:
    traces:
Datadog exporter
The Datadog exporter exports traces, metrics, and logs to Datadog.
otel-config.yaml
exporters:
  datadog:
    api:
      key: <DATADOG_API_KEY>
      site: <DATADOG_SITE>
    sending_queue:
      batch:
flush_timeout: 10sNote: If key is not specified or set to a secret, or if site is not specified, the system uses values from the core Agent configuration. By default, the core Agent sets site to datadoghq.com (US1).
Prometheus receiver
The Prometheus receiver collects health metrics from the OpenTelemetry Collector for the metrics pipeline.
otel-config.yaml
receivers:
  prometheus:
    config:
      scrape_configs:
        - job_name: "otelcol"
          scrape_interval: 60s
          static_configs:
            - targets: ["0.0.0.0:8888"]
For more information, see the Collector Health Metrics documentation.
Send your telemetry to Datadog
To send your telemetry data to Datadog:
- Instrument your application
- Configure the application
- Correlate observability data
- Run your application
Instrument the application
Instrument your application using the OpenTelemetry API.
Example application instrumented with the OpenTelemetry API
Example application instrumented with the OpenTelemetry API
As an example, you can use the Calendar sample application that’s already instrumented for you. The following code instruments the CalendarService.getDate() method using the OpenTelemetry annotations and API:
CalendarService.java
@WithSpan(kind = SpanKind.CLIENT)
public String getDate() {
    Span span = Span.current();
    span.setAttribute("peer.service", "random-date-service");
    ...
}
Configure the application
Your application must send data to the DDOT Collector on the same host. Ensure that the OTEL_EXPORTER_OTLP_ENDPOINT environment variable is set on your application.
If using the example application, run-otel-local.sh sets up the required environment variables and runs the application:
run-otel-local.sh
export OTEL_METRICS_EXPORTER="otlp"
export OTEL_LOGS_EXPORTER="otlp"
export OTEL_EXPORTER_OTLP_ENDPOINT="http://localhost:4317"
export OTEL_EXPORTER_OTLP_PROTOCOL="grpc"
Correlate observability data
Unified service tagging ties observability data together in Datadog so you can navigate across metrics, traces, and logs with consistent tags.
In bare-metal environments, env, service, and version are set through the OpenTelemetry Resource Attributes environment variables. The DDOT Collector detects this tagging configuration and applies it to the data it collects from applications.
In the example application, this is done in run-otel-local.sh:
run-otel-local.sh
export OTEL_RESOURCE_ATTRIBUTES="service.name=my-calendar-service,service.version=1.0,deployment.environment.name=otel-test,host.name=calendar-host"Run the application
Redeploy your application to apply the changes made in your environment variables. After the updated configuration is active, unified service tagging is fully enabled for your metrics, traces, and logs.
Explore observability data in Datadog
Use Datadog to explore the observability data for your application.
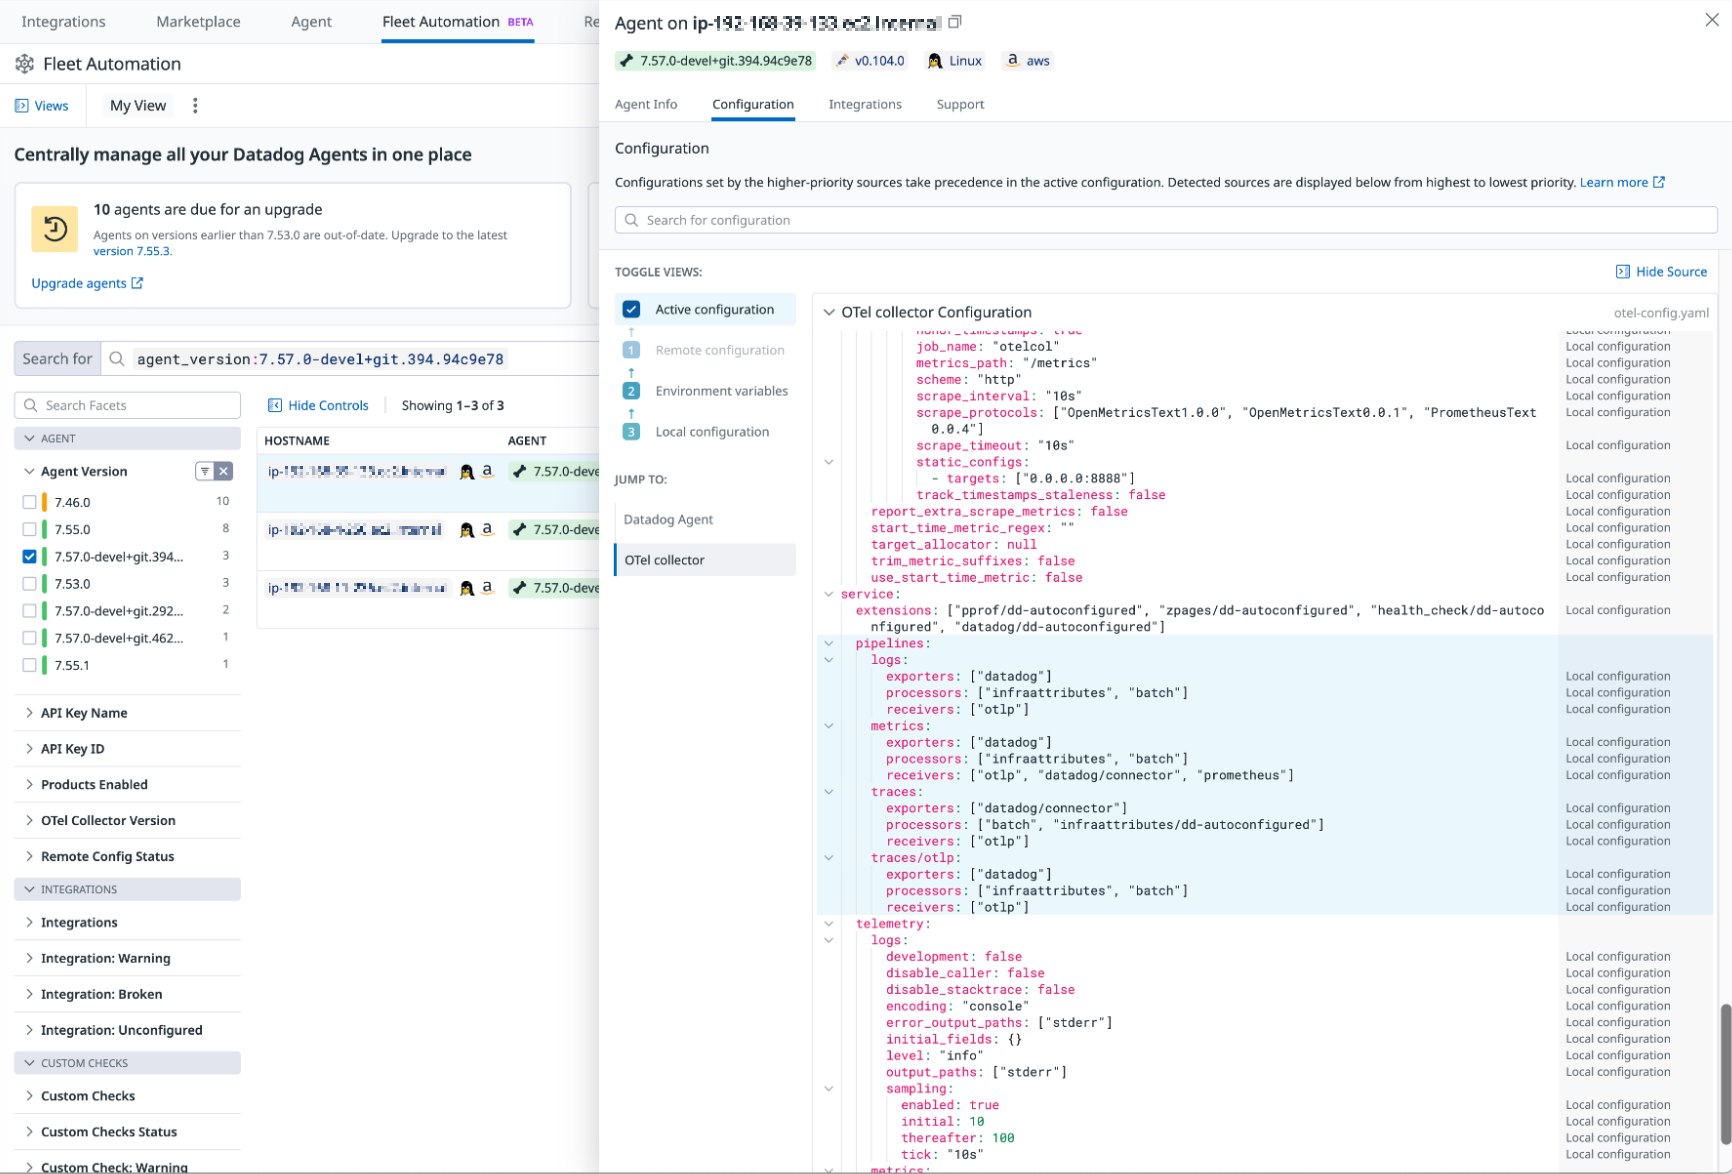
Fleet automation
Explore your Datadog Agent, DDOT, and upstream OpenTelemetry Collector configurations.
Infrastructure monitoring
View runtime and infrastructure metrics to visualize, monitor, and measure the performance of your hosts.
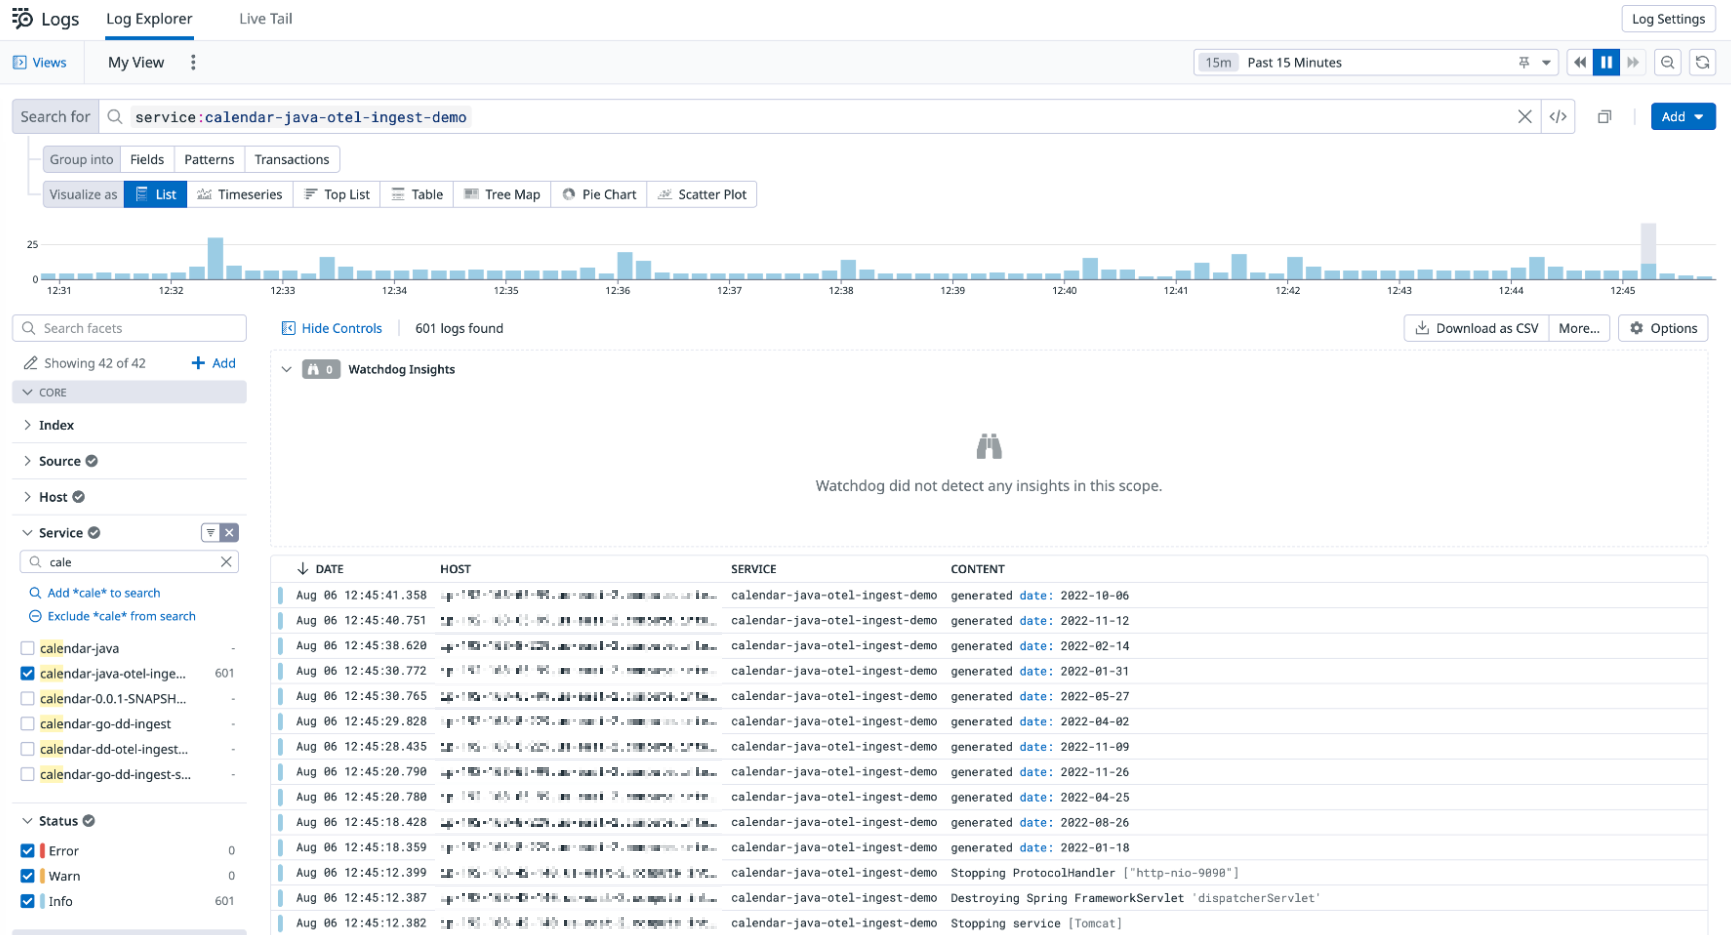
Logs
View logs to monitor and troubleshoot application and system operations.
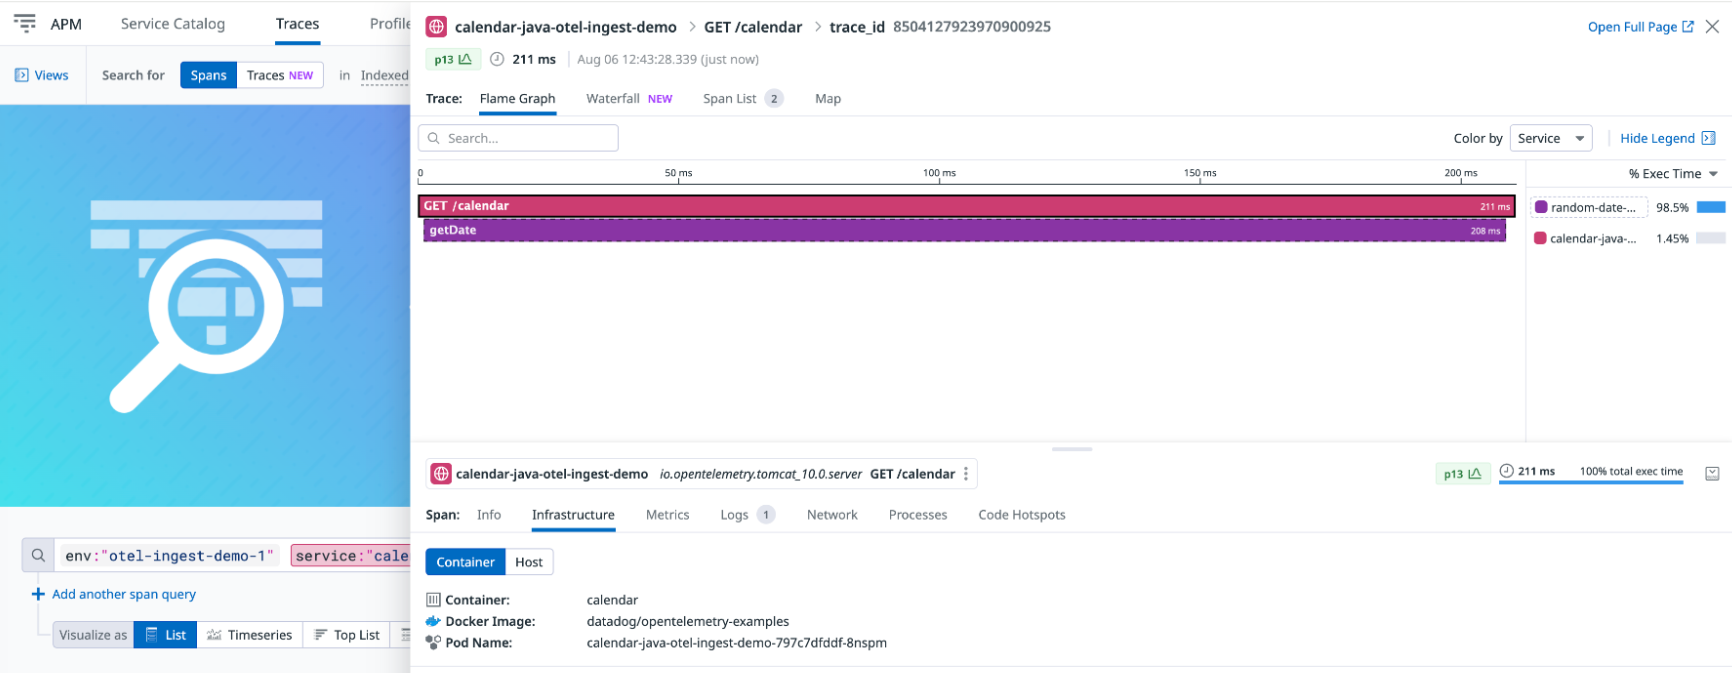
Traces
View traces and spans to observe the status and performance of requests processed by your application, with infrastructure metrics correlated in the same trace.
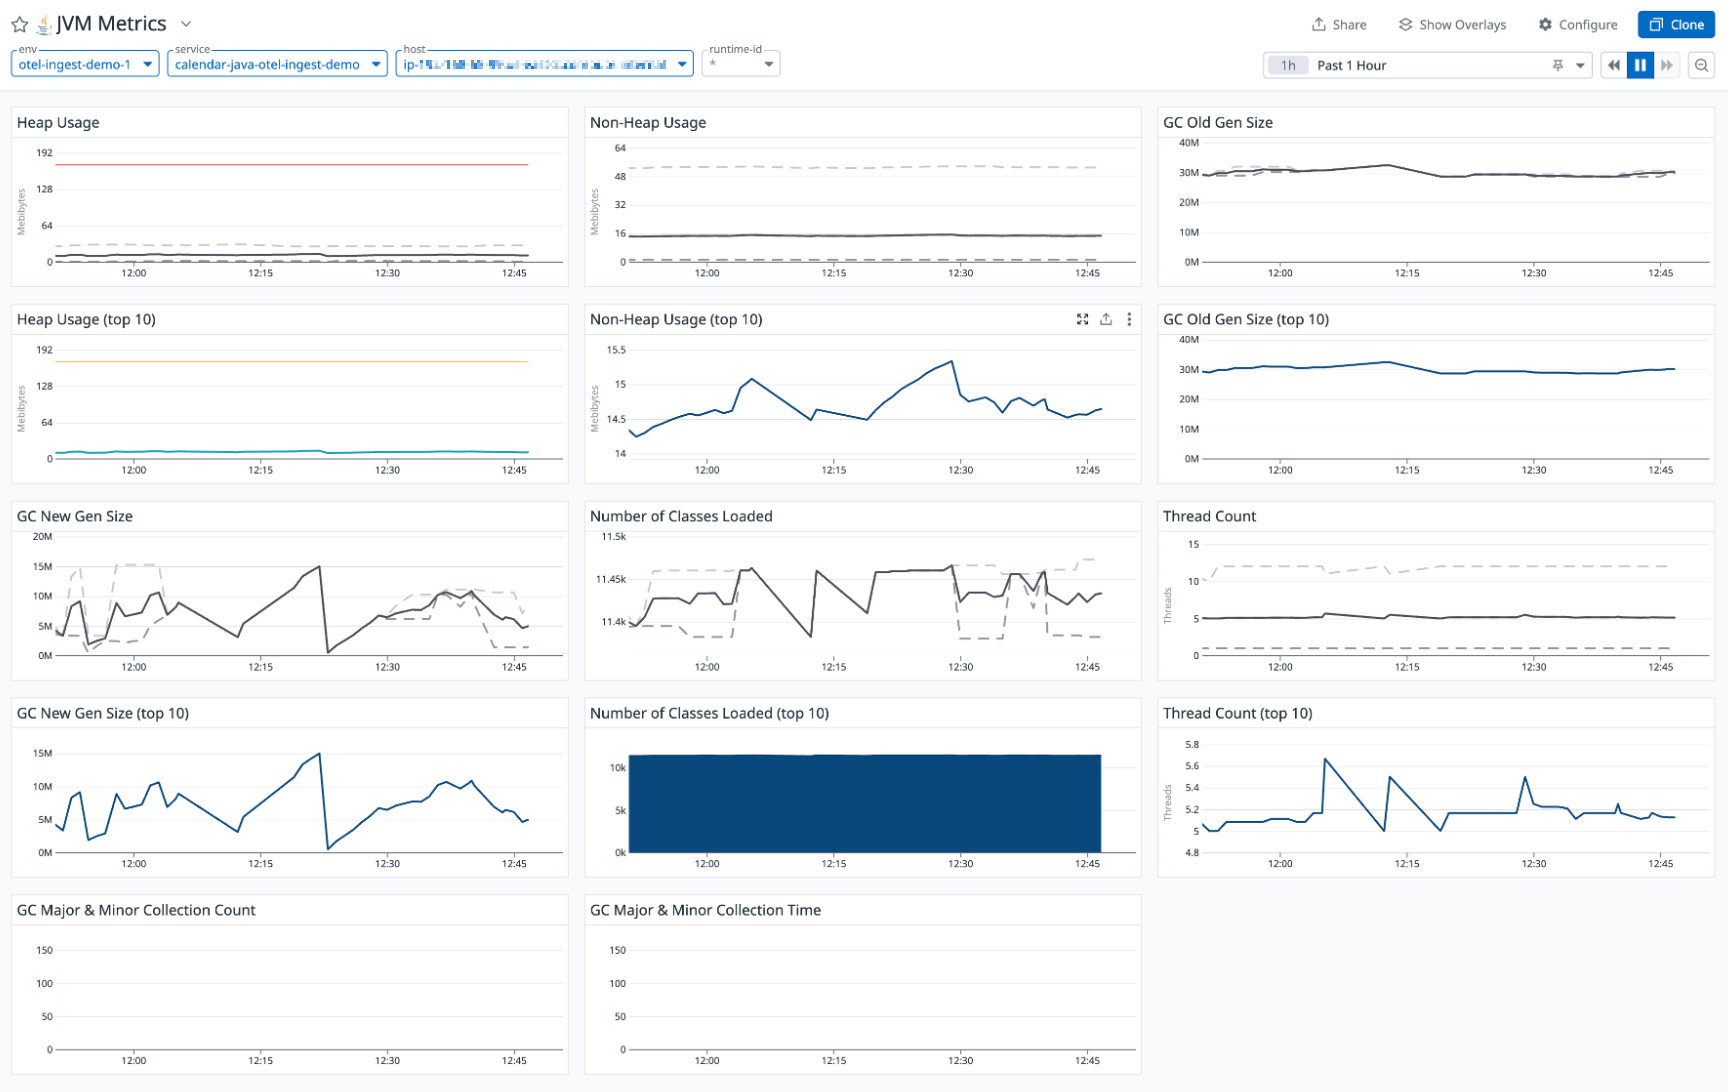
Runtime metrics
Monitor your runtime (JVM) metrics for your applications.
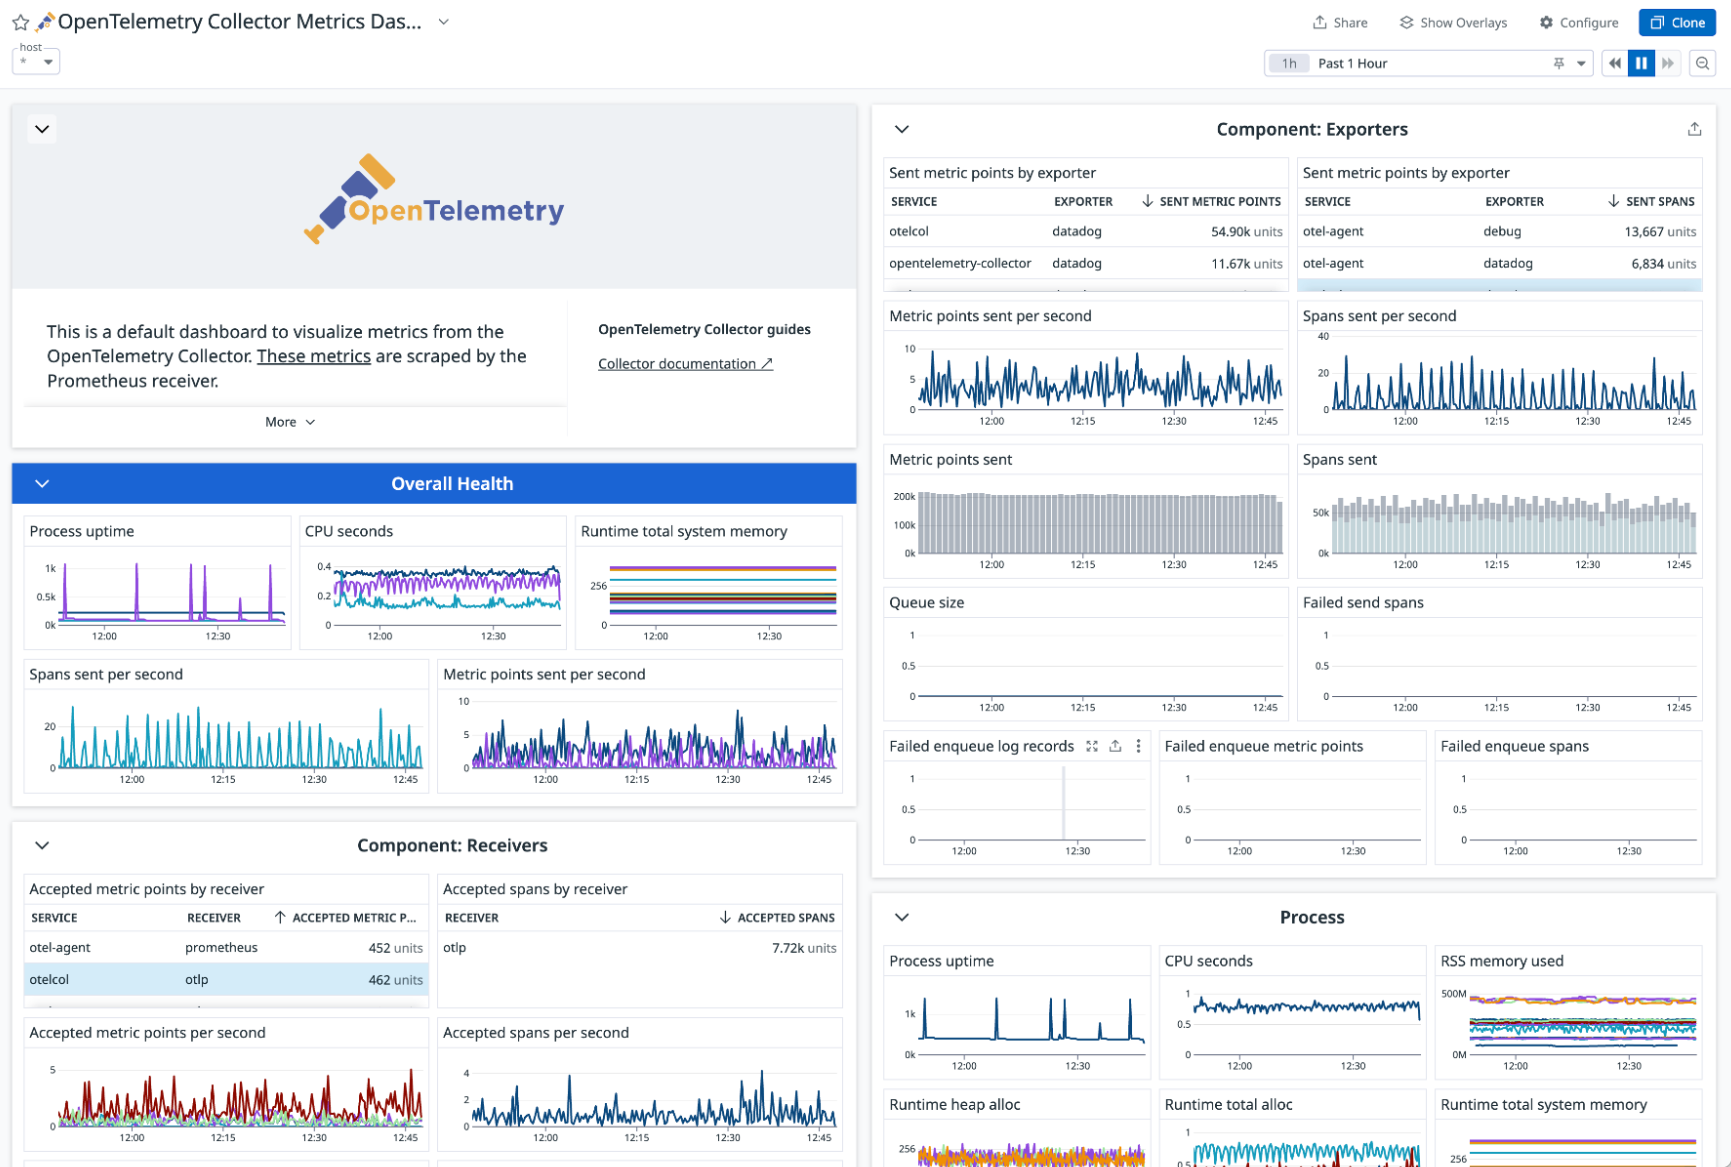
Collector health metrics
View metrics from the DDOT Collector to monitor the Collector health.
Further reading
Additional helpful documentation, links, and articles:
