- Essentials
- Getting Started
- Agent
- API
- APM Tracing
- Containers
- Dashboards
- Database Monitoring
- Datadog
- Datadog Site
- DevSecOps
- Incident Management
- Integrations
- Internal Developer Portal
- Logs
- Monitors
- OpenTelemetry
- Profiler
- Session Replay
- Security
- Serverless for AWS Lambda
- Software Delivery
- Synthetic Monitoring and Testing
- Tags
- Workflow Automation
- Learning Center
- Support
- Glossary
- Standard Attributes
- Guides
- Agent
- Integrations
- Developers
- Authorization
- DogStatsD
- Custom Checks
- Integrations
- Create an Agent-based Integration
- Create an API Integration
- Create a Log Pipeline
- Integration Assets Reference
- Build a Marketplace Offering
- Create a Tile
- Create an Integration Dashboard
- Create a Monitor Template
- Create a Cloud SIEM Detection Rule
- OAuth for Integrations
- Install Agent Integration Developer Tool
- Service Checks
- IDE Plugins
- Community
- Guides
- OpenTelemetry
- Administrator's Guide
- API
- Partners
- Datadog Mobile App
- DDSQL Reference
- CoScreen
- CoTerm
- Cloudcraft (Standalone)
- In The App
- Dashboards
- Notebooks
- DDSQL Editor
- Reference Tables
- Sheets
- Monitors and Alerting
- Metrics
- Watchdog
- Bits AI
- Internal Developer Portal
- Error Tracking
- Change Tracking
- Service Management
- Actions & Remediations
- Infrastructure
- Cloudcraft
- Resource Catalog
- Universal Service Monitoring
- Hosts
- Containers
- Processes
- Serverless
- Network Monitoring
- Cloud Cost
- Application Performance
- APM
- APM Terms and Concepts
- Application Instrumentation
- APM Metrics Collection
- Trace Pipeline Configuration
- Correlate Traces with Other Telemetry
- Trace Explorer
- Recommendations
- Code Origins for Spans
- Service Observability
- Endpoint Observability
- Dynamic Instrumentation
- Live Debugger
- Error Tracking
- Data Security
- Guides
- Troubleshooting
- Continuous Profiler
- Database Monitoring
- Agent Integration Overhead
- Setup Architectures
- Setting Up Postgres
- Setting Up MySQL
- Setting Up SQL Server
- Setting Up Oracle
- Setting Up Amazon DocumentDB
- Setting Up MongoDB
- Connecting DBM and Traces
- Data Collected
- Exploring Database Hosts
- Exploring Query Metrics
- Exploring Query Samples
- Exploring Database Schemas
- Exploring Recommendations
- Troubleshooting
- Guides
- Data Streams Monitoring
- Data Jobs Monitoring
- Data Observability
- Digital Experience
- Real User Monitoring
- Synthetic Testing and Monitoring
- Continuous Testing
- Product Analytics
- Software Delivery
- CI Visibility
- CD Visibility
- Deployment Gates
- Test Optimization
- Quality Gates
- DORA Metrics
- Security
- Security Overview
- Cloud SIEM
- Code Security
- Cloud Security
- App and API Protection
- Workload Protection
- Sensitive Data Scanner
- AI Observability
- Log Management
- Observability Pipelines
- Log Management
- Administration
Monitor Status Page
The provisional status page has limited support for monitors and their features. For more details, see Restrictions of provisional status page.
If you are using the legacy status page, see the Status Page (Legacy) documentation
If you are using the legacy status page, see the Status Page (Legacy) documentation
Overview
When a monitor alerts, the first place to start your investigation is the monitor status page. This page displays graphs and events to show you why your monitor is in an alert status, so you can understand what is happening around a monitor alert. Further, you can access quick actions to help you move the investigation towards resolution. Use the monitor status page to:
- Review all the context you need to start an investigation
- Investigate the possible cause of an alert
- Take action to escalate, maintain, or resolve your investigation
Header
The header contains the monitor’s metadata, including:
- Monitor status
- Monitor type
- Creation date
- Author
- Associated teams (if available)
- Associated services (if available)
- Tags
On the right, you’ll find the Edit, Clone, Export, Permissions and Delete buttons.
From the header, you can resolve the monitor. Resolving from the header resolves all groups in the alert and sets the monitor status to OK (all groups). The resolve function temporarily changes the monitor status to OK until its next evaluation, but the next evaluation proceeds as normal based on current data. To resolve from the Event details, see Status Events.
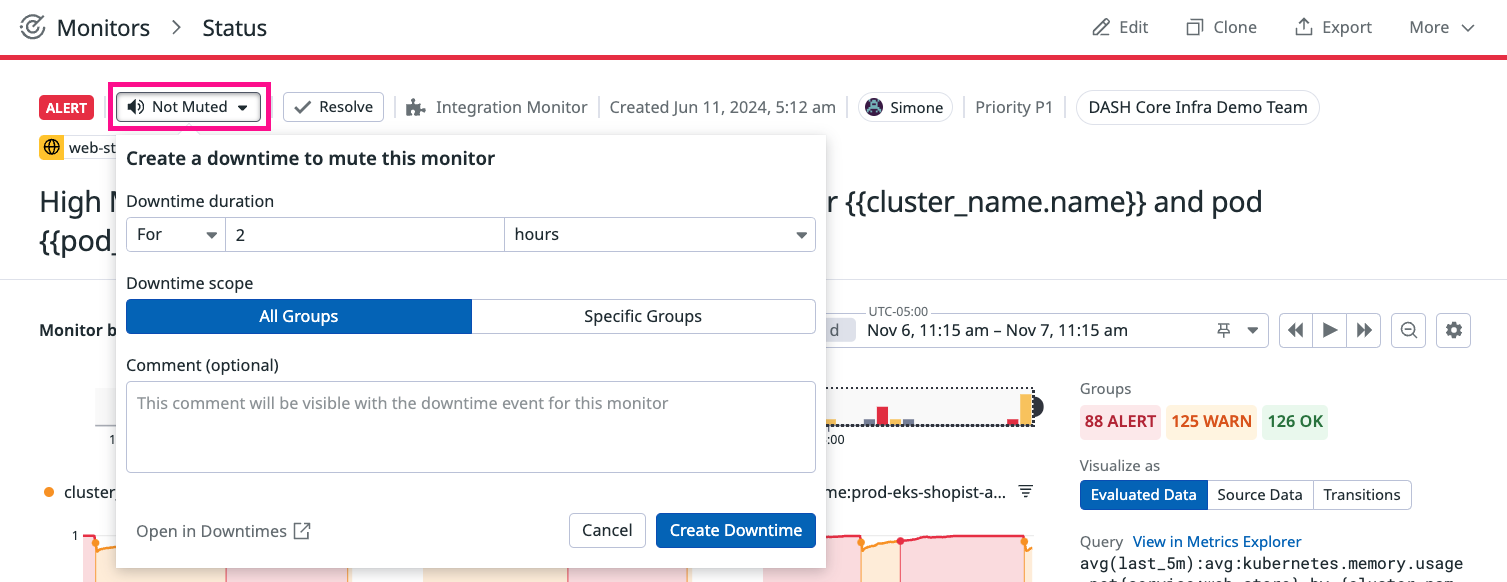
Additionally, view and manage downtimes impacting this monitor and create new ones to mute notifications.
View monitor evaluations through graphs
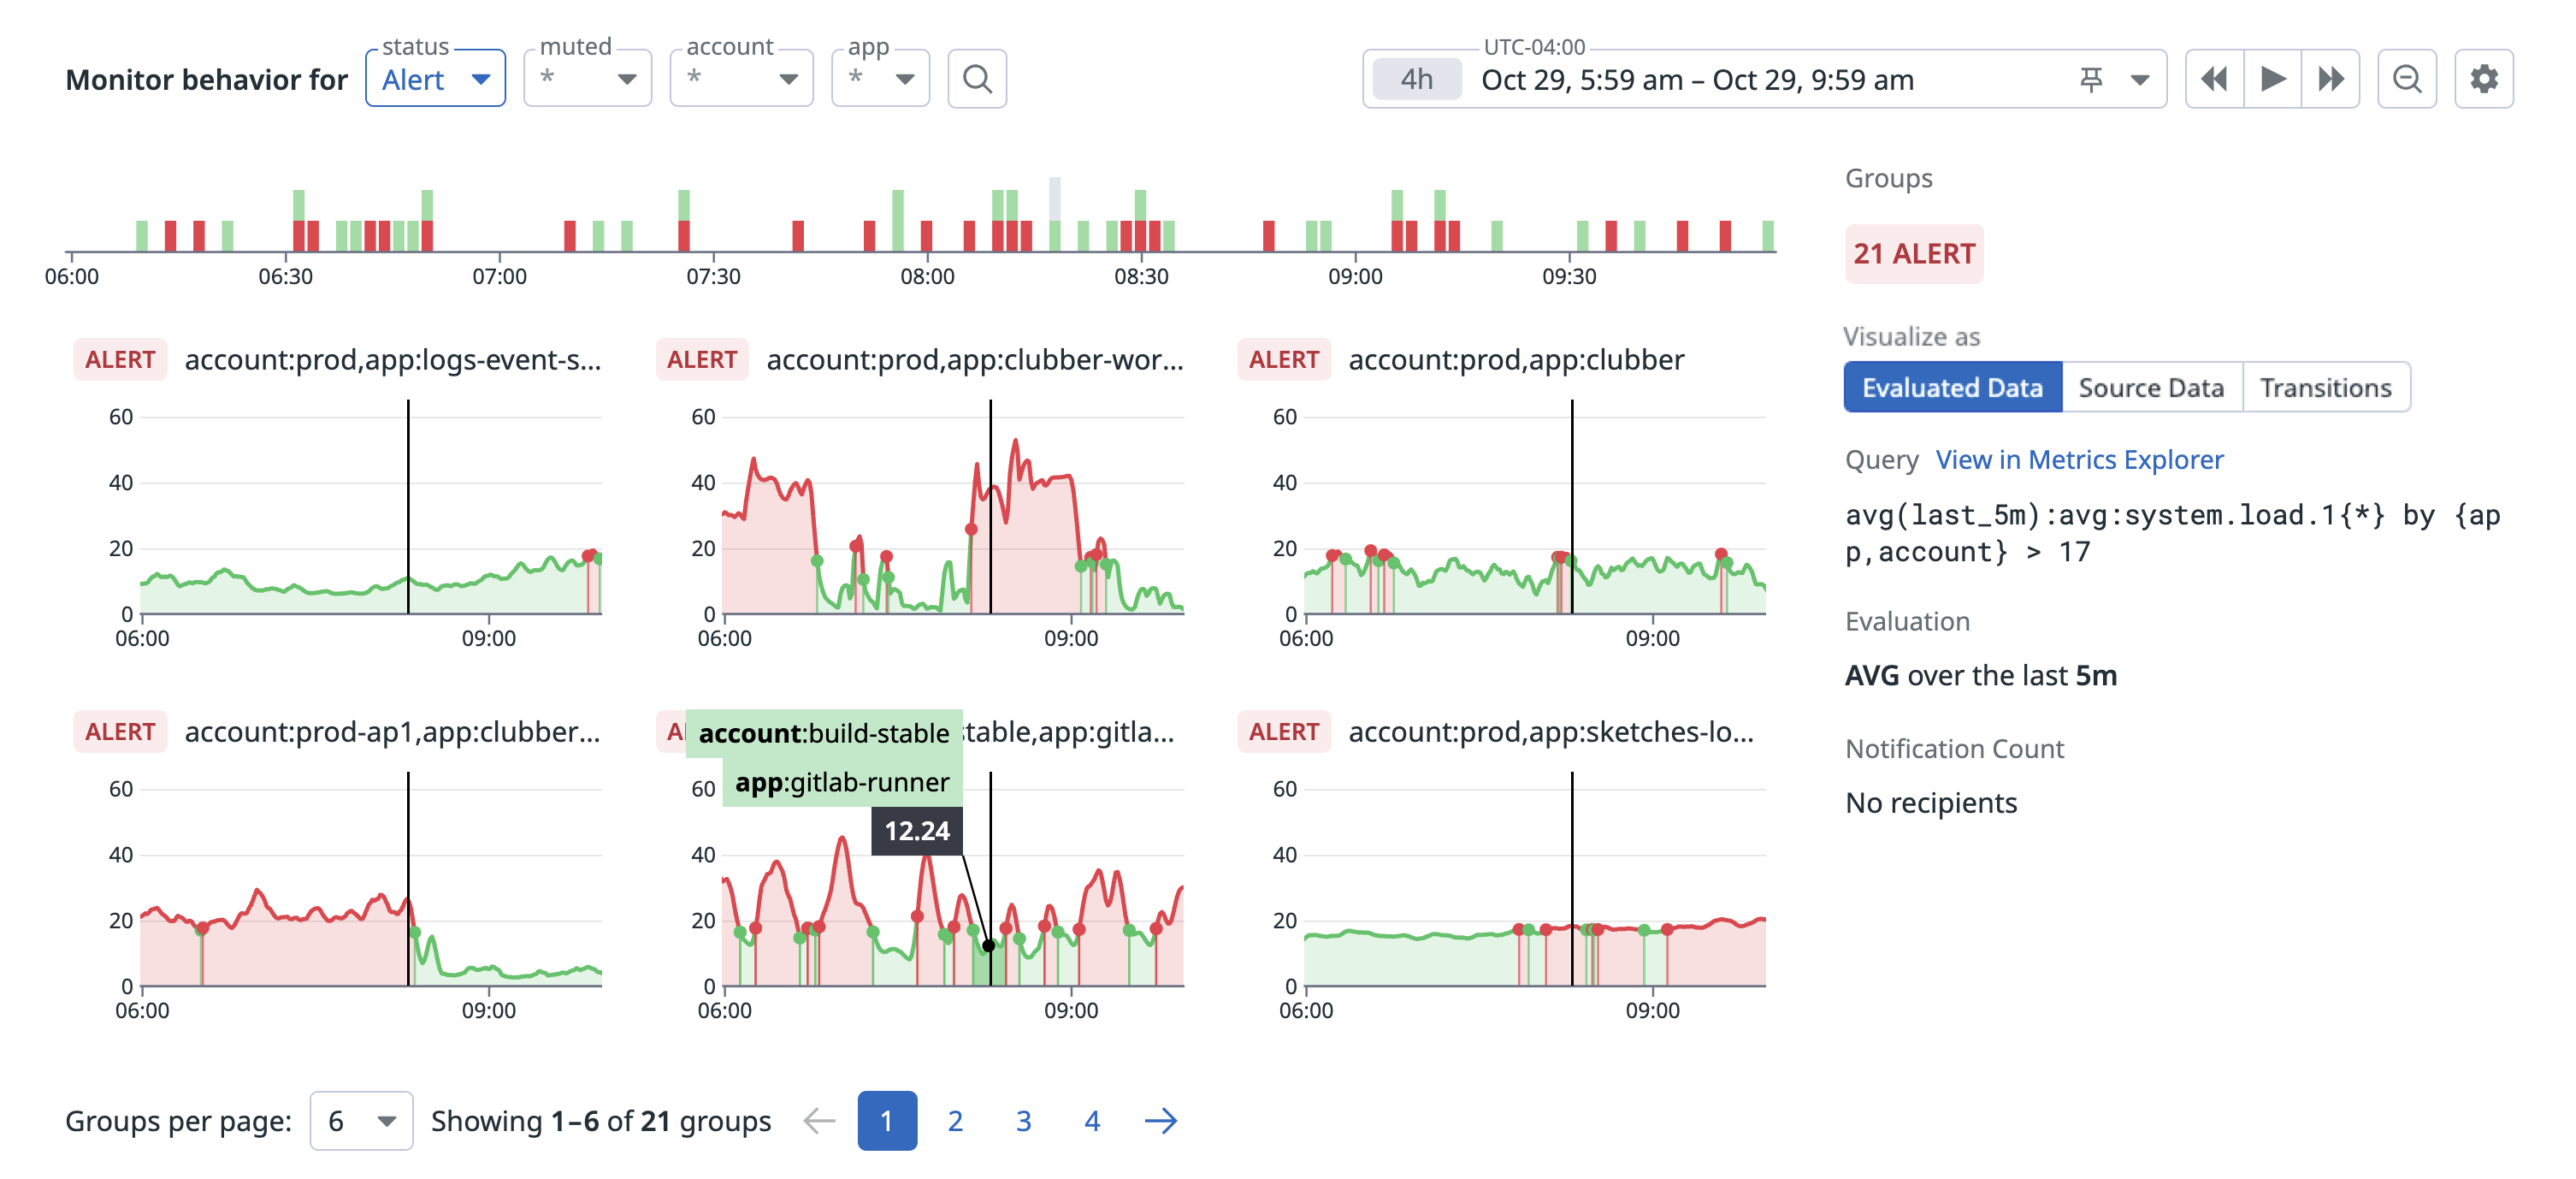
You can troubleshoot monitor alerts by viewing your data through graphs. Toggle between the Evaluated Data, Source Data, and Transitions graphs to investigate which groups are causing the alert. The graphing component also contains details on the monitor query, configured monitor evaluation, and notification information. To learn more about each graph, see the Monitor status graphs documentation.
Use the template variables to scope down the monitor page to specific groups, select the attributes you want to filter by.
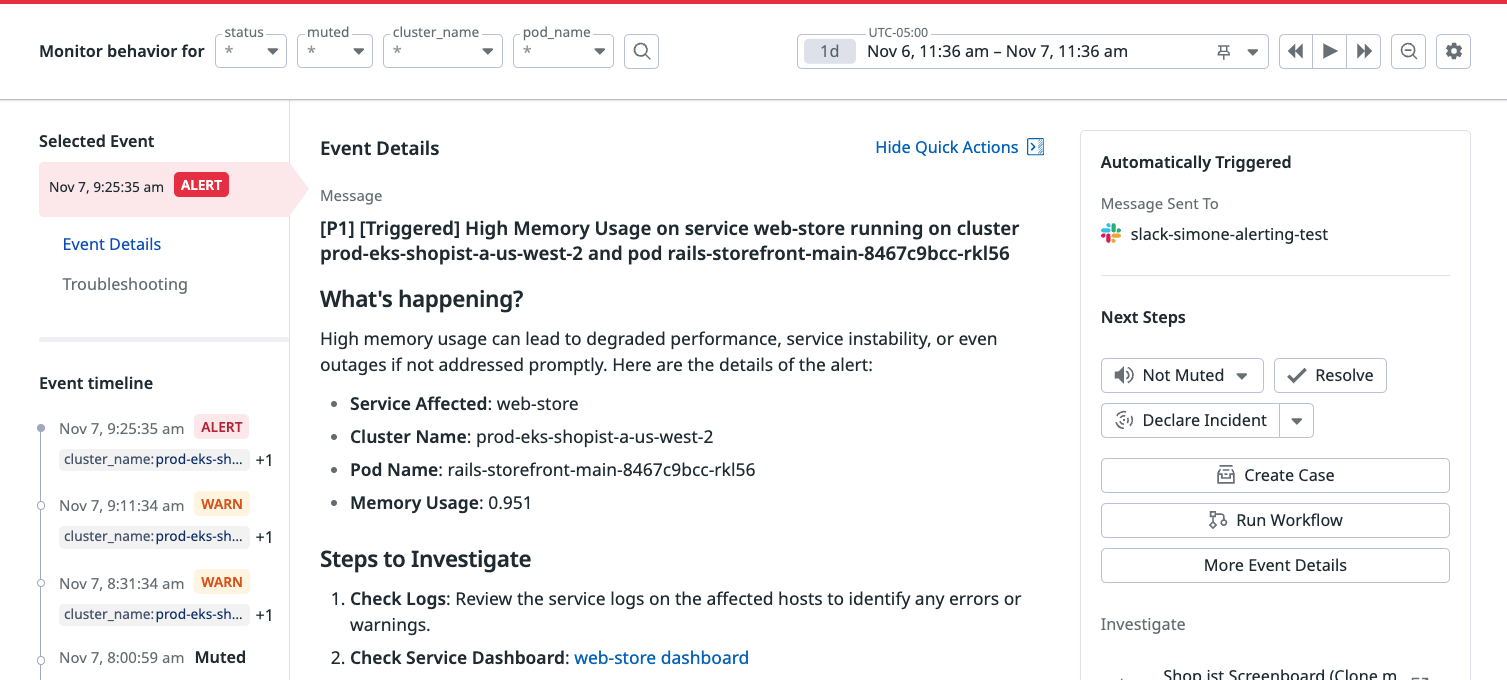
View monitor events details
You can explore different product areas while maintaining the same alerting context, ensuring you view the same timeframe and service parameters as on your monitor’s status page. Use Event details to troubleshoot if the monitor is alerting due to recent configuration changes. You can take the query to other product areas to troubleshoot and cross reference without losing context.
For more information, see the Monitor status events documentation.
Restrictions of provisional status page
Limited support for monitor types
The following monitor types are not supported by the provisional status page:
- Anomaly
- Database Monitoring
- Forecast
- Outlier
Further reading
Additional helpful documentation, links, and articles:


