How to monitor non-static thresholds
Overview
A typical metric monitor triggers an alert if a single metric goes above a specific threshold number. For example, you could set an alert to trigger if your disk usage goes above 80%. This approach is efficient for many use cases, but what happens when the threshold is a variable rather than an absolute number?
Watchdog powered monitors (namely anomaly and outlier) are particularly useful when there isn’t an explicit definition of your metric being off-track. However, when possible, you should use regular monitors with tailored alert conditions to maximize precision and minimize time-to-alert for your specific use case.
This guide covers common use cases for alerting on non-static thresholds:
Seasonal threshold
Context
You are the team lead in charge of an e-commerce website. You want to:
- receive alerts on unexpectedly low traffic on your home page
- capture more localized incidents like the ones affecting public internet providers
- cover for unknown failure scenarios
Your website’s traffic varies from night to day, and from weekday to weekend. There is no absolute number to quantify what “unexpectedly low” means. However, the traffic follows a predictable pattern where you can consider a 10% difference as a reliable indicator of an issue, such as a localized incident affecting public internet providers.
Monitor
Your team measures the number of connections on your NGINX web server using the nginx.requests.total_count metric.
The request consists of 3 parts:
- A query to get the current number of requests.
- A query to get the number of requests at the same time a week before.
- “Formula” queries that calculate the ratio between the first two queries.
Then, decide on the time aggregation:
- You choose the timeframe. The bigger the timeframe, the more data it evaluates to detect an anomaly. Larger timeframes can also result in more monitor alerts, so start with 1 hour, then adjust to your needs.
- You choose the aggregation. Since it’s a count metric performing a ratio,
average (or sum) is a natural choice.
The threshold displayed in the screenshot below has been configured to 0.9 to allow for a 10% difference between the value of the first query (current) and the second query (week before).
{
	"name": "[Seasonal threshold] Amount of connection",
	"type": "query alert",
	"query": "sum(last_10m):sum:nginx.requests.total_count{env:prod} by {datacenter} / week_before(sum:nginx.requests.total_count{env:prod} by {datacenter}) <= 0.9",
	"message": "The amount of connection is lower than yesterday by {{value}} !",
	"tags": [],
	"options": {
		"thresholds": {
			"critical": 0.9
		},
		"notify_audit": false,
		"require_full_window": false,
		"notify_no_data": false,
		"renotify_interval": 0,
		"include_tags": true,
		"new_group_delay": 60,
		"silenced": {}
	},
	"priority": null,
	"restricted_roles": null
}
Reference threshold
Context
You are the QA team lead, in charge of the checkout process of your e-commerce website. You want to ensure that your customers have a good experience and can purchase your products without any issues. One indicator of that is the error rate.
The traffic is not the same throughout the day, so 50 errors/minute on a Friday evening is less worrying than 50 errors/minute on a Sunday morning. Monitoring an error rate rather than the errors themselves gives you a reliable view of what healthy and unhealthy metrics look like.
Get alerted when the error rate is high, but also when the volume of hits is significant enough.
Monitor
Create 3 monitors in total:
- Metric monitor to alert on total number of hits.
- Metric monitor to calculate the error rate.
- Composite monitor that triggers an alert if the first two monitors are in an ALERT state.
Metric monitor to alert on the total number of hits
The first monitor tracks the total number of hits, both successes and failures. This monitor determines whether the error rate should trigger an alert.
{
	"name": "Number of hits",
	"type": "query alert",
	"query": "sum(last_5m):sum:shopist.checkouts.failed{env:prod} by {region}.as_count() + sum:shopist.checkouts.success{env:prod} by {region}.as_count() > 4000",
	"message": "There has been more than 4000 hits for this region !",
	"tags": [],
	"options": {
		"thresholds": {
			"critical": 1000
		},
		"notify_audit": false,
		"require_full_window": false,
		"notify_no_data": false,
		"renotify_interval": 0,
		"include_tags": true,
		"new_group_delay": 60
	}
}
Metric monitor to calculate the error rate
The second monitor calculates the error rate. Create a query on the number of errors divided by the total number of hits to get the error rate a / a+b:
{
	"name": "Error Rate",
	"type": "query alert",
	"query": "sum(last_5m):sum:shopist.checkouts.failed{env:prod} by {region}.as_count() / (sum:shopist.checkouts.failed{env:prod} by {region}.as_count() + sum:shopist.checkouts.success{env:prod} by {region}.as_count()) > 0.5",
	"message": "The error rate is currently {{value}} ! Be careful !",
	"tags": [],
	"options": {
		"thresholds": {
			"critical": 0.5
		},
		"notify_audit": false,
		"require_full_window": false,
		"notify_no_data": false,
		"renotify_interval": 0,
		"include_tags": true,
		"new_group_delay": 60
	}
}
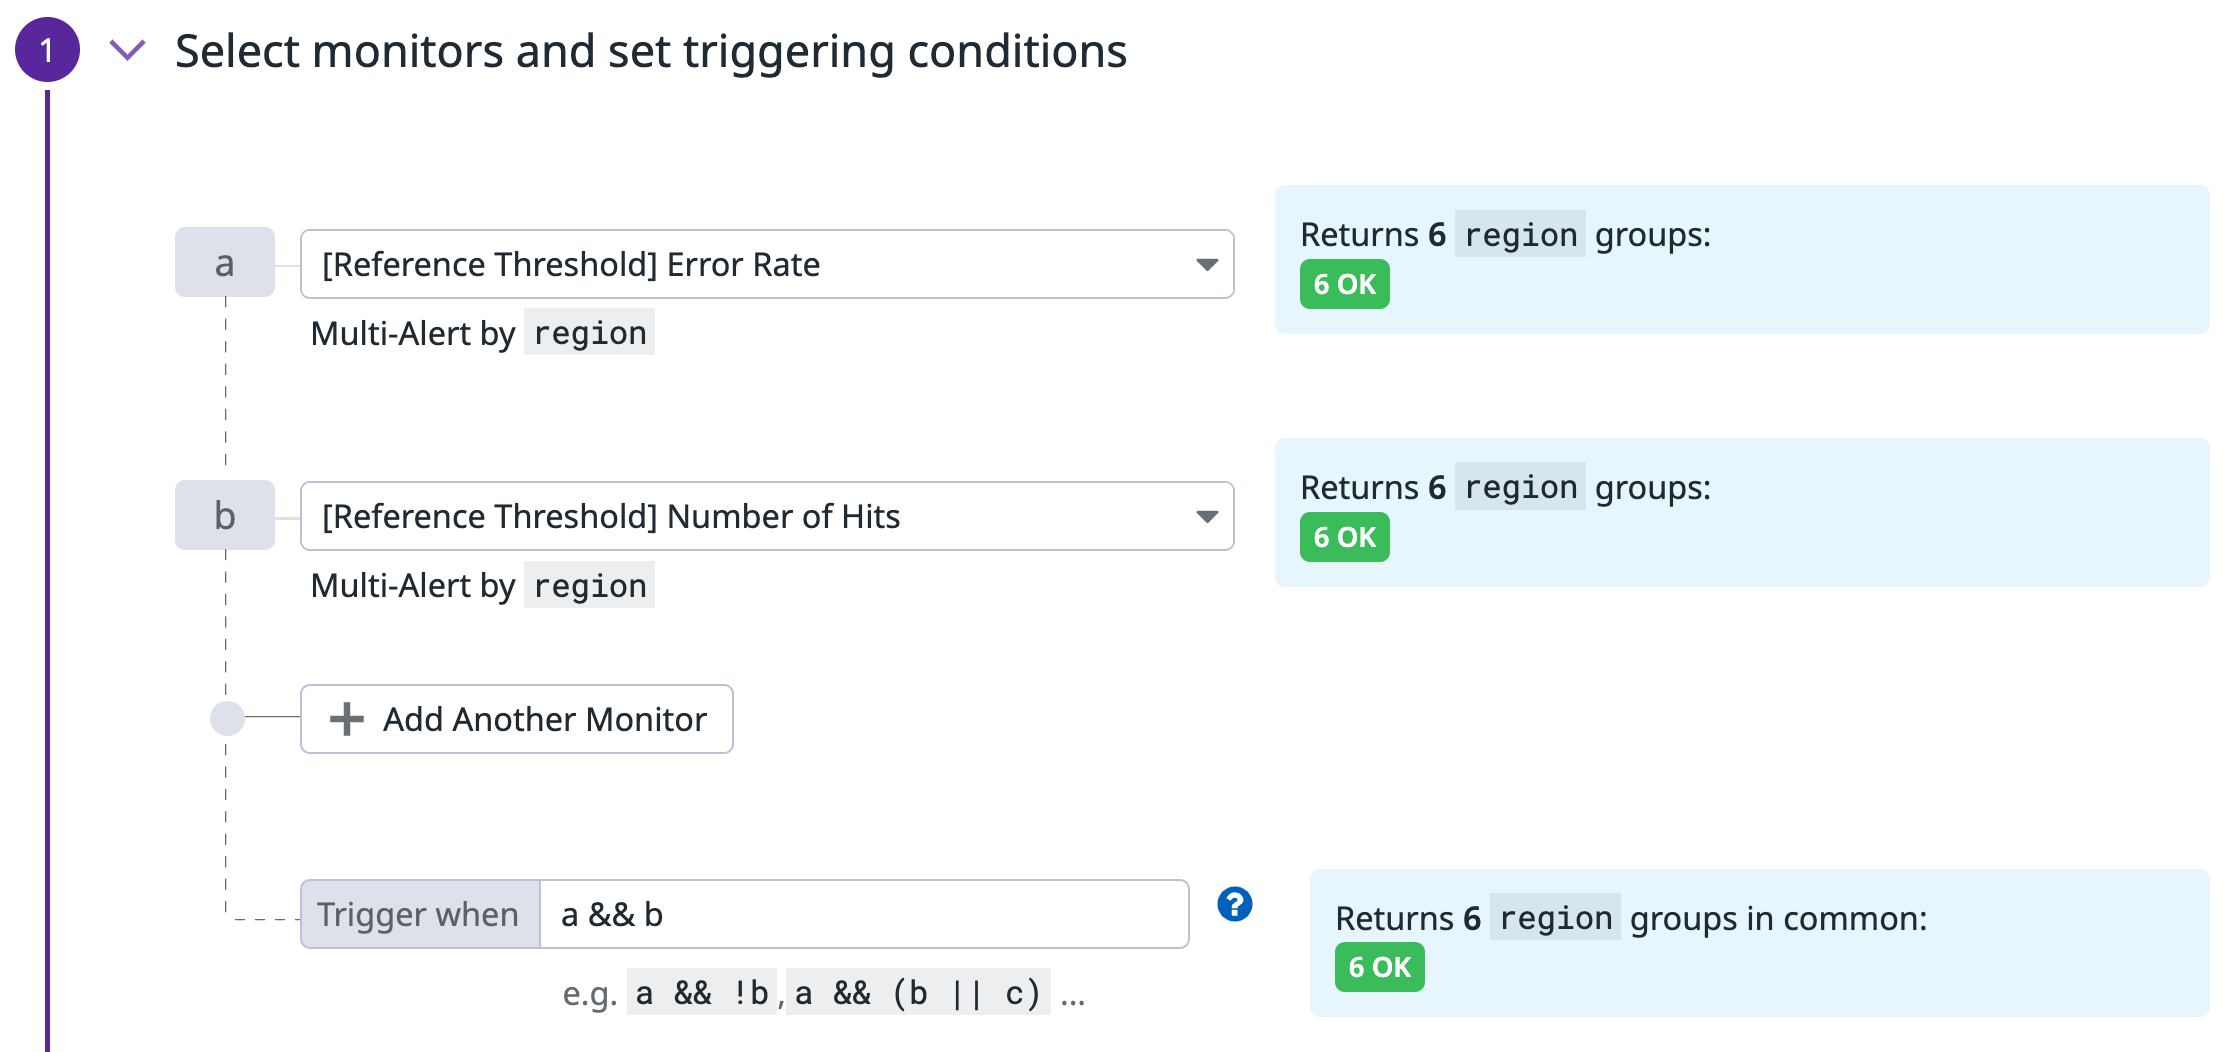
Composite monitor
The last monitor is a Composite monitor, which sends an alert only if the two preceding monitors are also both in an ALERT state.
Further reading
Additional helpful documentation, links, and articles: