概要
一般的なメトリクスモニターは、単一のメトリクスが特定のしきい値を超えた場合にアラートをトリガーします。例えば、ディスク使用率が 80% を超えた場合にトリガーするアラートを設定できます。この方法は多くのユースケースで効果的ですが、しきい値が絶対的な数値ではなく変数である場合はどうなるでしょうか?
Watchdog 対応のモニター (特に異常検知と外れ値検知) は、メトリクスが軌道を外れている明確な定義がない場合に特に有用です。しかし、可能であれば、特定のユースケースに合わせたアラート条件を持つ通常のモニターを使用して、精度を最大化し、アラートまでの時間を最小化するべきです。
このガイドでは、非静的なしきい値でのアラートに関する一般的なユースケースを取り上げます。
季節的なしきい値
コンテキスト
あなたは e コマース Web サイトを担当するチームリーダーです。あなたが望むことは、
- ホームページの予期せぬ低トラフィックについてアラートを受け取る
- 公共のインターネットプロバイダーに影響を与えるような、より局所的なインシデントを捉える
- 未知の障害シナリオをカバーする
あなたの Web サイトのトラフィックは、夜から昼、平日から週末へと変動します。「予期せぬ低さ」を定量化する絶対的な数値はありません。しかし、トラフィックは予測可能なパターンに従い、10% の差異は問題の信頼できる指標と見なすことができます。例えば、公共のインターネットプロバイダーに影響を与える局所的なインシデントなどです。
モニター
あなたのチームは、nginx.requests.total_count メトリクスを使用して、NGINX Web サーバー上の接続数を測定しています。
リクエストは 3 つの部分から成ります。
- 現在のリクエスト数を取得するクエリ。
- 1 週間前の同じ時間のリクエスト数を取得するクエリ。
- 最初の 2 つのクエリ間の比率を計算する「数式」クエリ。
次に、時間の集計を決定します。
- 時間枠を選択します。時間枠が大きいほど、異常を検出するために評価するデータが増えます。時間枠が大きいとモニターアラートが増える可能性もあるため、最初は 1 時間から始めてニーズに合わせて調整します。
- 集計方法を選択します。これはカウントメトリクスで比率を計算しているため、
average (または sum) が自然な選択です。
以下のスクリーンショットに表示されているしきい値は 0.9 に構成されており、最初のクエリ (現在) と 2 番目のクエリ (1 週間前) の値の 10% の差異を許容します。
{
"name": "[季節的なしきい値] 接続数",
"type": "query alert",
"query": "sum(last_10m):sum:nginx.requests.total_count{env:prod} by {datacenter} / week_before(sum:nginx.requests.total_count{env:prod} by {datacenter}) <= 0.9",
"message": "接続数が昨日より {{value}} 低下しています!",
"tags": [],
"options": {
"thresholds": {
"critical": 0.9
},
"notify_audit": false,
"require_full_window": false,
"notify_no_data": false,
"renotify_interval": 0,
"include_tags": true,
"new_group_delay": 60,
"silenced": {}
},
"priority": null,
"restricted_roles": null
}
参照しきい値
コンテキスト
あなたは QA チームのリーダーであり、e コマース Web サイトのチェックアウトプロセスを担当しています。顧客が製品を問題なく購入できるように、良い体験を提供したいと考えています。その指標の 1 つがエラーレートです。
トラフィックは一日を通して変動するため、金曜日の夜に 50 エラー/分が発生しても、日曜日の朝に同じ 50 エラー/分が発生する場合ほどは心配ではありません。エラーそのものではなくエラーレートを監視することで、正常なメトリクスと異常なメトリクスの信頼できる視点を得ることができます。
エラーレートが高い場合だけでなく、ヒット数が十分に大きい場合にもアラートを受け取ります。
モニター
合計で 3 つのモニターを作成します。
- ヒット総数に対してアラートを出すメトリクスモニター
- エラーレートを計算するメトリクスモニター
- 最初の 2 つのモニターが ALERT 状態の場合にアラートをトリガーする複合条件モニター
ヒット総数に対してアラートを出すメトリクスモニター
最初のモニターは、成功と失敗の両方のヒット総数を追跡します。このモニターは、エラーレートがアラートをトリガーすべきかどうかを決定します。
{
"name": "ヒット数",
"type": "query alert",
"query": "sum(last_5m):sum:shopist.checkouts.failed{env:prod} by {region}.as_count() + sum:shopist.checkouts.success{env:prod} by {region}.as_count() > 4000",
"message": "この地域で 4000 以上のヒットがありました!",
"tags": [],
"options": {
"thresholds": {
"critical": 4000
},
"notify_audit": false,
"require_full_window": false,
"notify_no_data": false,
"renotify_interval": 0,
"include_tags": true,
"new_group_delay": 60
}
}
エラーレートを計算するメトリクスモニター
2 番目のモニターはエラーレートを計算します。エラー数をヒット総数で割ってエラーレートを得るクエリを作成します: a / (a + b):
{
"name": "エラーレート",
"type": "query alert",
"query": "sum(last_5m):sum:shopist.checkouts.failed{env:prod} by {region}.as_count() / (sum:shopist.checkouts.failed{env:prod} by {region}.as_count() + sum:shopist.checkouts.success{env:prod} by {region}.as_count()) > 0.5",
"message": "現在のエラーレートは {{value}} です!注意してください!",
"tags": [],
"options": {
"thresholds": {
"critical": 0.5
},
"notify_audit": false,
"require_full_window": false,
"notify_no_data": false,
"renotify_interval": 0,
"include_tags": true,
"new_group_delay": 60
}
}
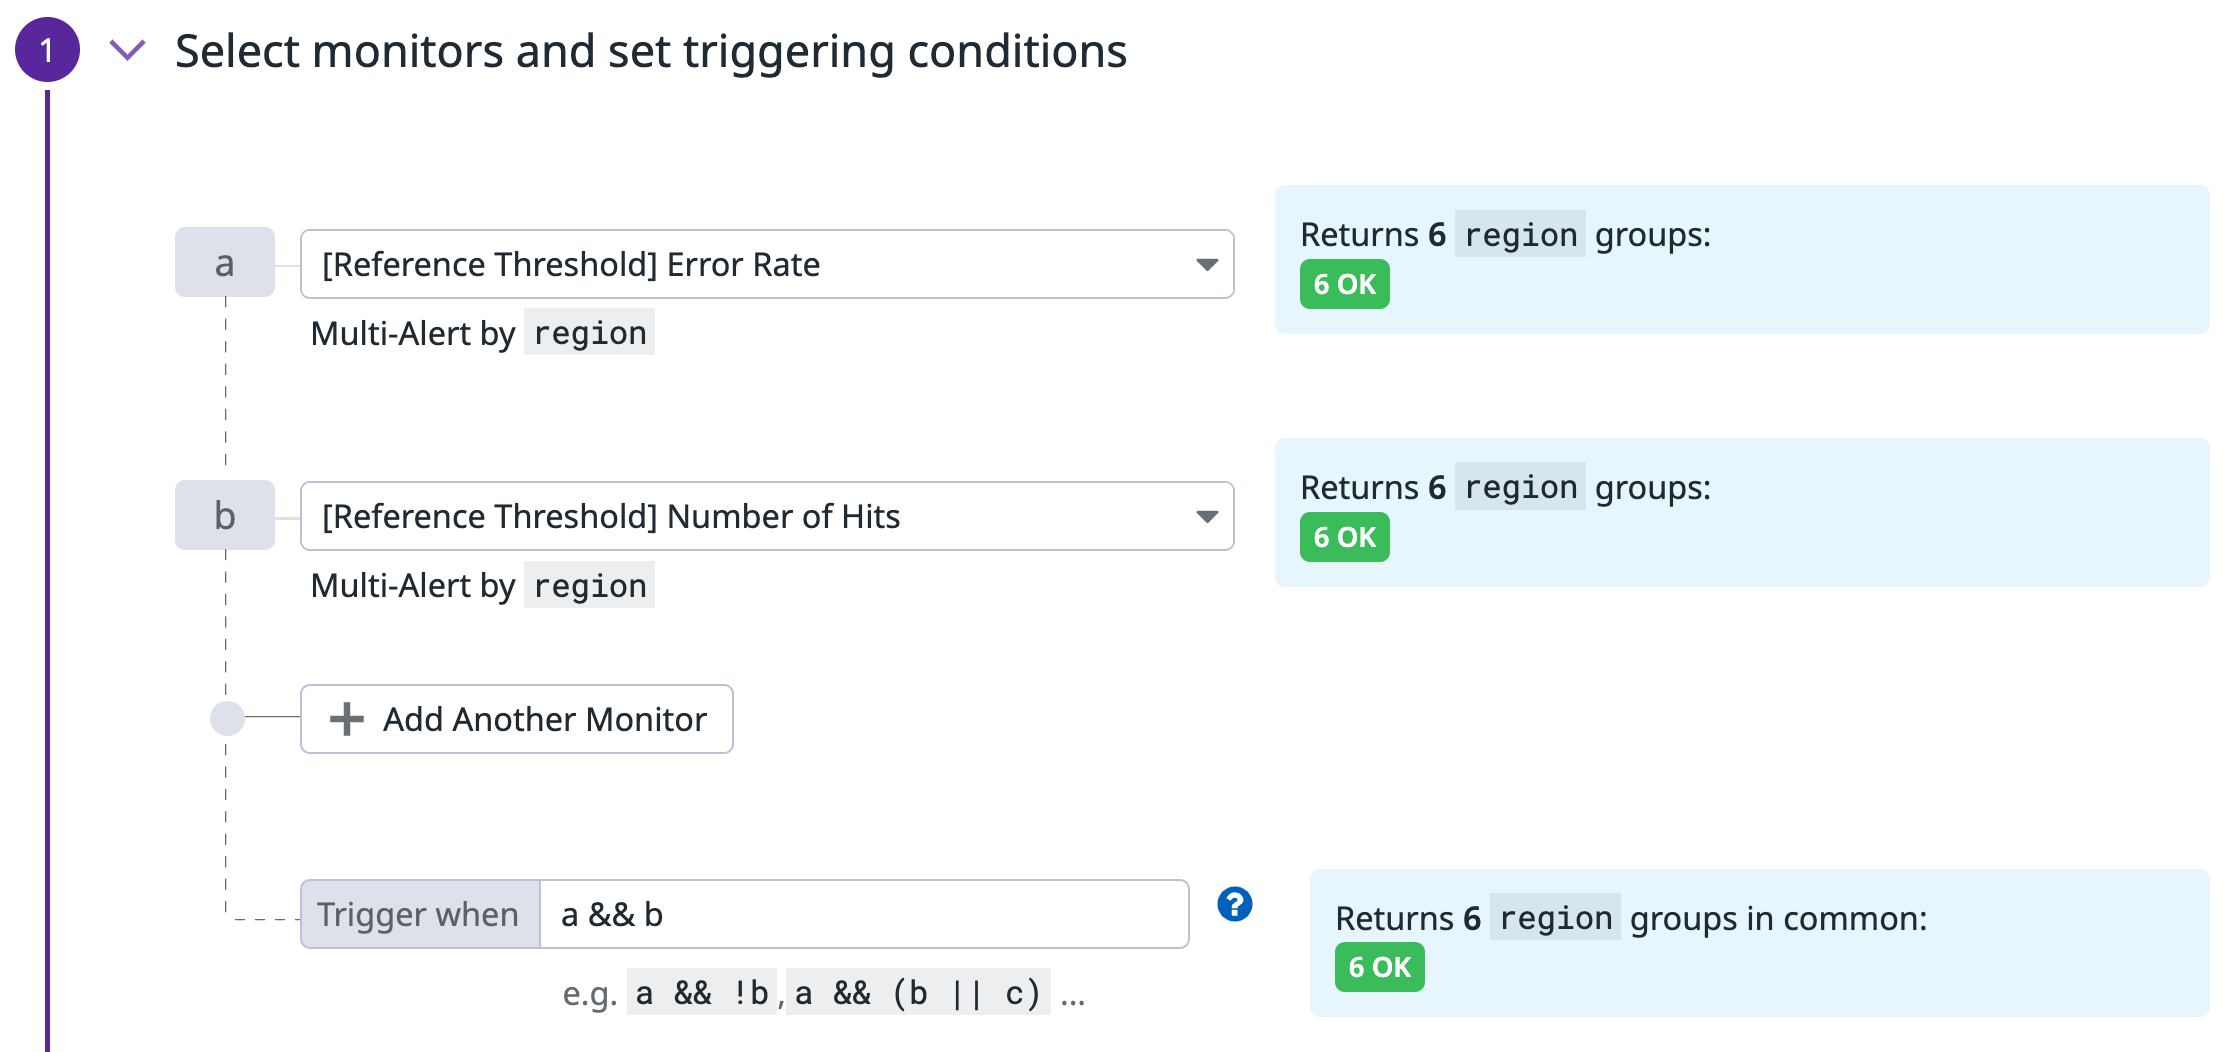
複合条件モニター
最後のモニターは複合条件モニターで、前の 2 つのモニターが両方とも ALERT 状態の場合にのみアラートを送信します。
参考資料