- Agents
- Essentials
- Getting Started
- Agent
- API
- APM Tracing
- Containers
- Dashboards
- Database Monitoring
- Datadog
- Datadog Site
- DevSecOps
- Incident Management
- Integrations
- Internal Developer Portal
- Logs
- Monitors
- Notebooks
- OpenTelemetry
- Profiler
- Search
- Session Replay
- Security
- Serverless for AWS Lambda
- Software Delivery
- Synthetic Monitoring and Testing
- Tags
- Workflow Automation
- Learning Center
- Support
- Glossary
- Standard Attributes
- Guides
- Agent
- Integrations
- Extend Datadog
- Authorization
- DogStatsD
- Custom Checks
- Integrations
- Build an Integration with Datadog
- Create an Agent-based Integration
- Create an API-based Integration
- Create a Log Pipeline
- Integration Assets Reference
- Build a Marketplace Offering
- Create an Integration Dashboard
- Create a Monitor Template
- Create a Cloud SIEM Detection Rule
- Install Agent Integration Developer Tool
- Service Checks
- Community
- Guides
- OpenTelemetry
- Administrator's Guide
- API
- Partners
- Datadog Mobile App
- DDSQL Reference
- CoScreen
- CoTerm
- Remote Configuration
- Cloudcraft (Standalone)
- In The App
- Dashboards
- Notebooks
- DDSQL Editor
- Reference Tables
- Sheets
- Monitors and Alerting
- Service Level Objectives
- Metrics
- Watchdog
- Bits AI
- Internal Developer Portal
- Error Tracking
- Change Tracking
- Event Management
- Incident Response
- Actions & Remediations
- Infrastructure
- Cloudcraft
- Resource Catalog
- Universal Service Monitoring
- End User Device Monitoring
- Hosts
- Containers
- Processes
- Serverless
- Network Monitoring
- Storage Management
- Cloud Cost
- Application Performance
- APM
- Continuous Profiler
- Database Monitoring
- Agent Integration Overhead
- Setup Architectures
- Setting Up Postgres
- Setting Up MySQL
- Setting Up SQL Server
- Setting Up Oracle
- Setting Up Amazon DocumentDB
- Setting Up MongoDB
- Setting Up ClickHouse
- Connecting DBM and Traces
- Data Collected
- Exploring Database Hosts
- Exploring Query Metrics
- Exploring Query Samples
- Exploring Database Schemas
- Exploring Recommendations
- Troubleshooting
- Guides
- Data Streams Monitoring
- Data Observability
- Digital Experience
- Real User Monitoring
- Synthetic Testing and Monitoring
- Continuous Testing
- Experiments
- Product Analytics
- Session Replay
- Software Delivery
- CI Visibility
- CD Visibility
- Deployment Gates
- Test Optimization
- Code Coverage
- PR Gates
- DORA Metrics
- Feature Flags
- Developer Integrations
- Security
- Security Overview
- Cloud SIEM
- Code Security
- Cloud Security
- App and API Protection
- AI Guard
- Workload Protection
- Sensitive Data Scanner
- AI Observability
- Log Management
- Observability Pipelines
- Configuration
- Sources
- Processors
- Destinations
- Packs
- Akamai CDN
- Amazon CloudFront
- Amazon VPC Flow Logs
- AWS Application Load Balancer Logs
- AWS CloudTrail
- AWS Elastic Load Balancer Logs
- AWS Network Load Balancer Logs
- Cisco ASA
- Cloudflare
- F5
- Fastly
- Fortinet Firewall
- HAProxy Ingress
- Istio Proxy
- Juniper SRX Firewall Traffic Logs
- Netskope
- NGINX
- Okta
- Palo Alto Firewall
- Windows XML
- ZScaler ZIA DNS
- Zscaler ZIA Firewall
- Zscaler ZIA Tunnel
- Zscaler ZIA Web Logs
- Search Syntax
- Scaling and Performance
- Monitoring and Troubleshooting
- Guides and Resources
- Log Management
- CloudPrem
- Administration
Nested Queries
Overview
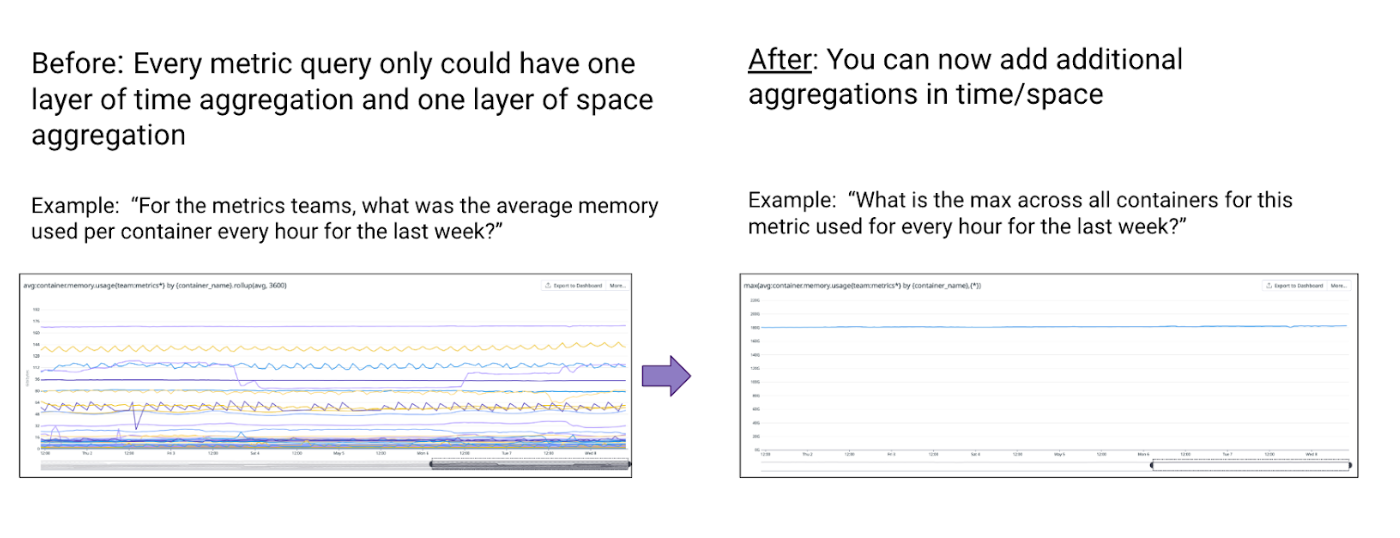
By default, every metric query in Datadog consists of two layers of aggregation. Nested queries allows you to reuse the results of a previous query in a subsequent one.
Nested queries unlocks several powerful capabilities:
- Multilayer aggregation
- Percentiles and standard deviation on count/rate/gauge type metrics
- Higher resolution queries over historical timeframes
Multilayer aggregation
In Datadog, each metric query in Datadog is evaluated with two layers of aggregation: first by time, then by space. Multilayer aggregation allows you to apply additional layers of time or space aggregation. For more information on aggregation, see the anatomy of a metric’s query.
Multilayer time aggregation
Access multilayer time aggregation with the rollup function. Every metric query already contains an initial rollup (time aggregation) that controls the granularity of the data points displayed on the graph. For more information, see the Rollup documentation.
You can apply additional layers of time aggregation with subsequent rollups.
The first rollup supports the following aggregators:
avgsumminmaxcount
Additional layers provided by multilayer time aggregation supports the following time aggregators:
avgsumminmaxcountarbitrary percentile pxx(p78, p99, p99.99, etc.)stddev
Multilayer time aggregation can be used with the following functions:
| Supported Functions | Description |
|---|---|
| Arithmetic operators | +, -, *, / |
| Timeshift functions | <METRIC_NAME>{*}, -<TIME_IN_SECOND>hour_before(<METRIC_NAME>{*})day_before(<METRIC_NAME>{*})week_before(<METRIC_NAME>{*})month_before(<METRIC_NAME>{*}) |
| Top-k selection | top(<METRIC_NAME>{*}, <LIMIT_TO>, '<BY>', '<DIR>') |
Any functions not listed above cannot be combined with multilayer time aggregation.
Time aggregation example query
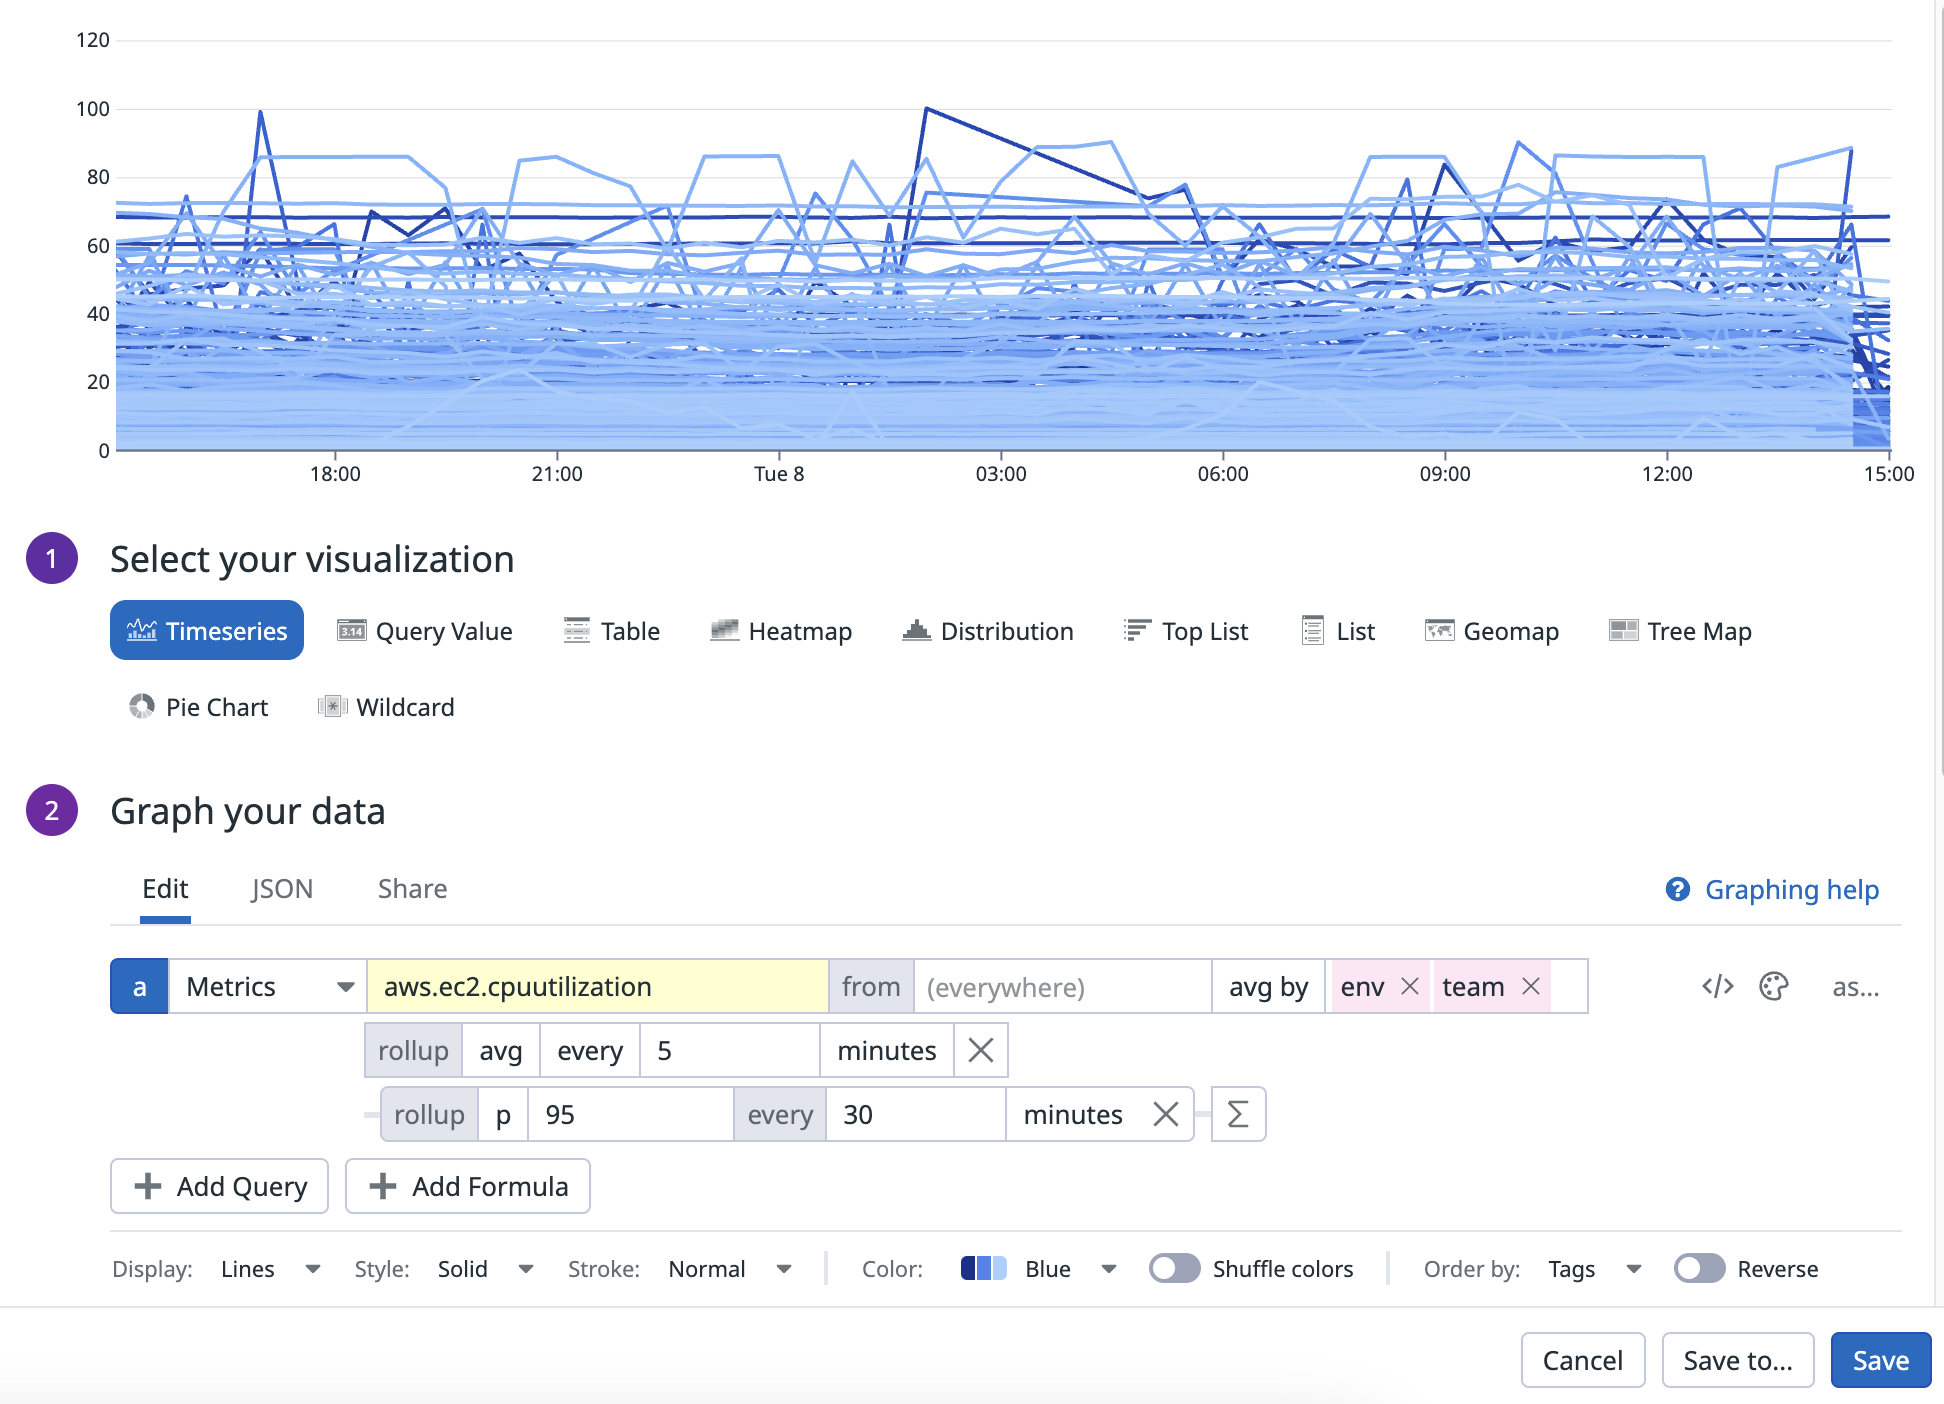
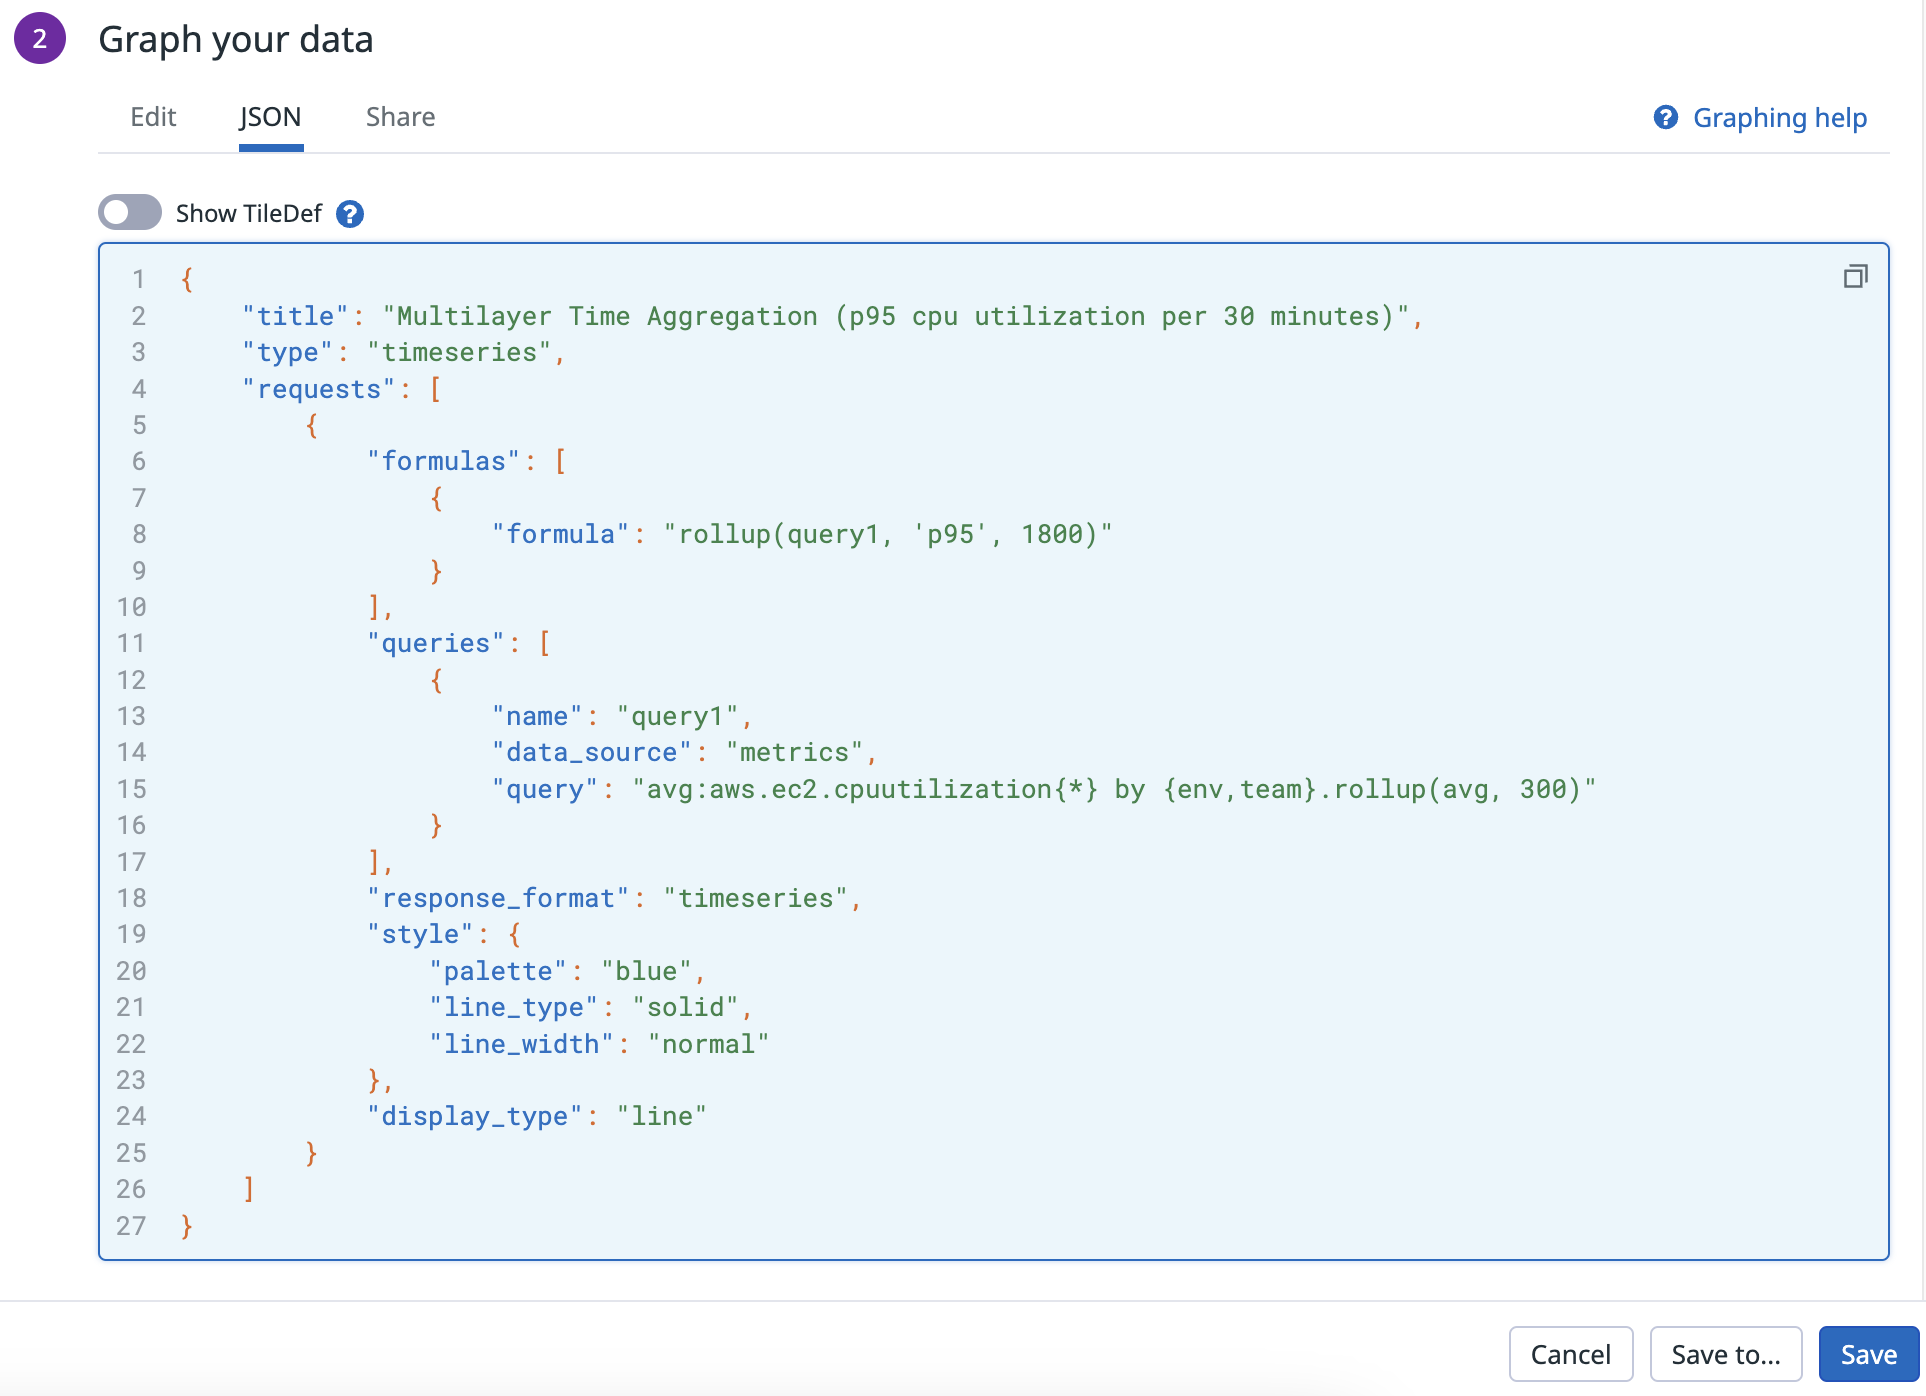
Time aggregation example query
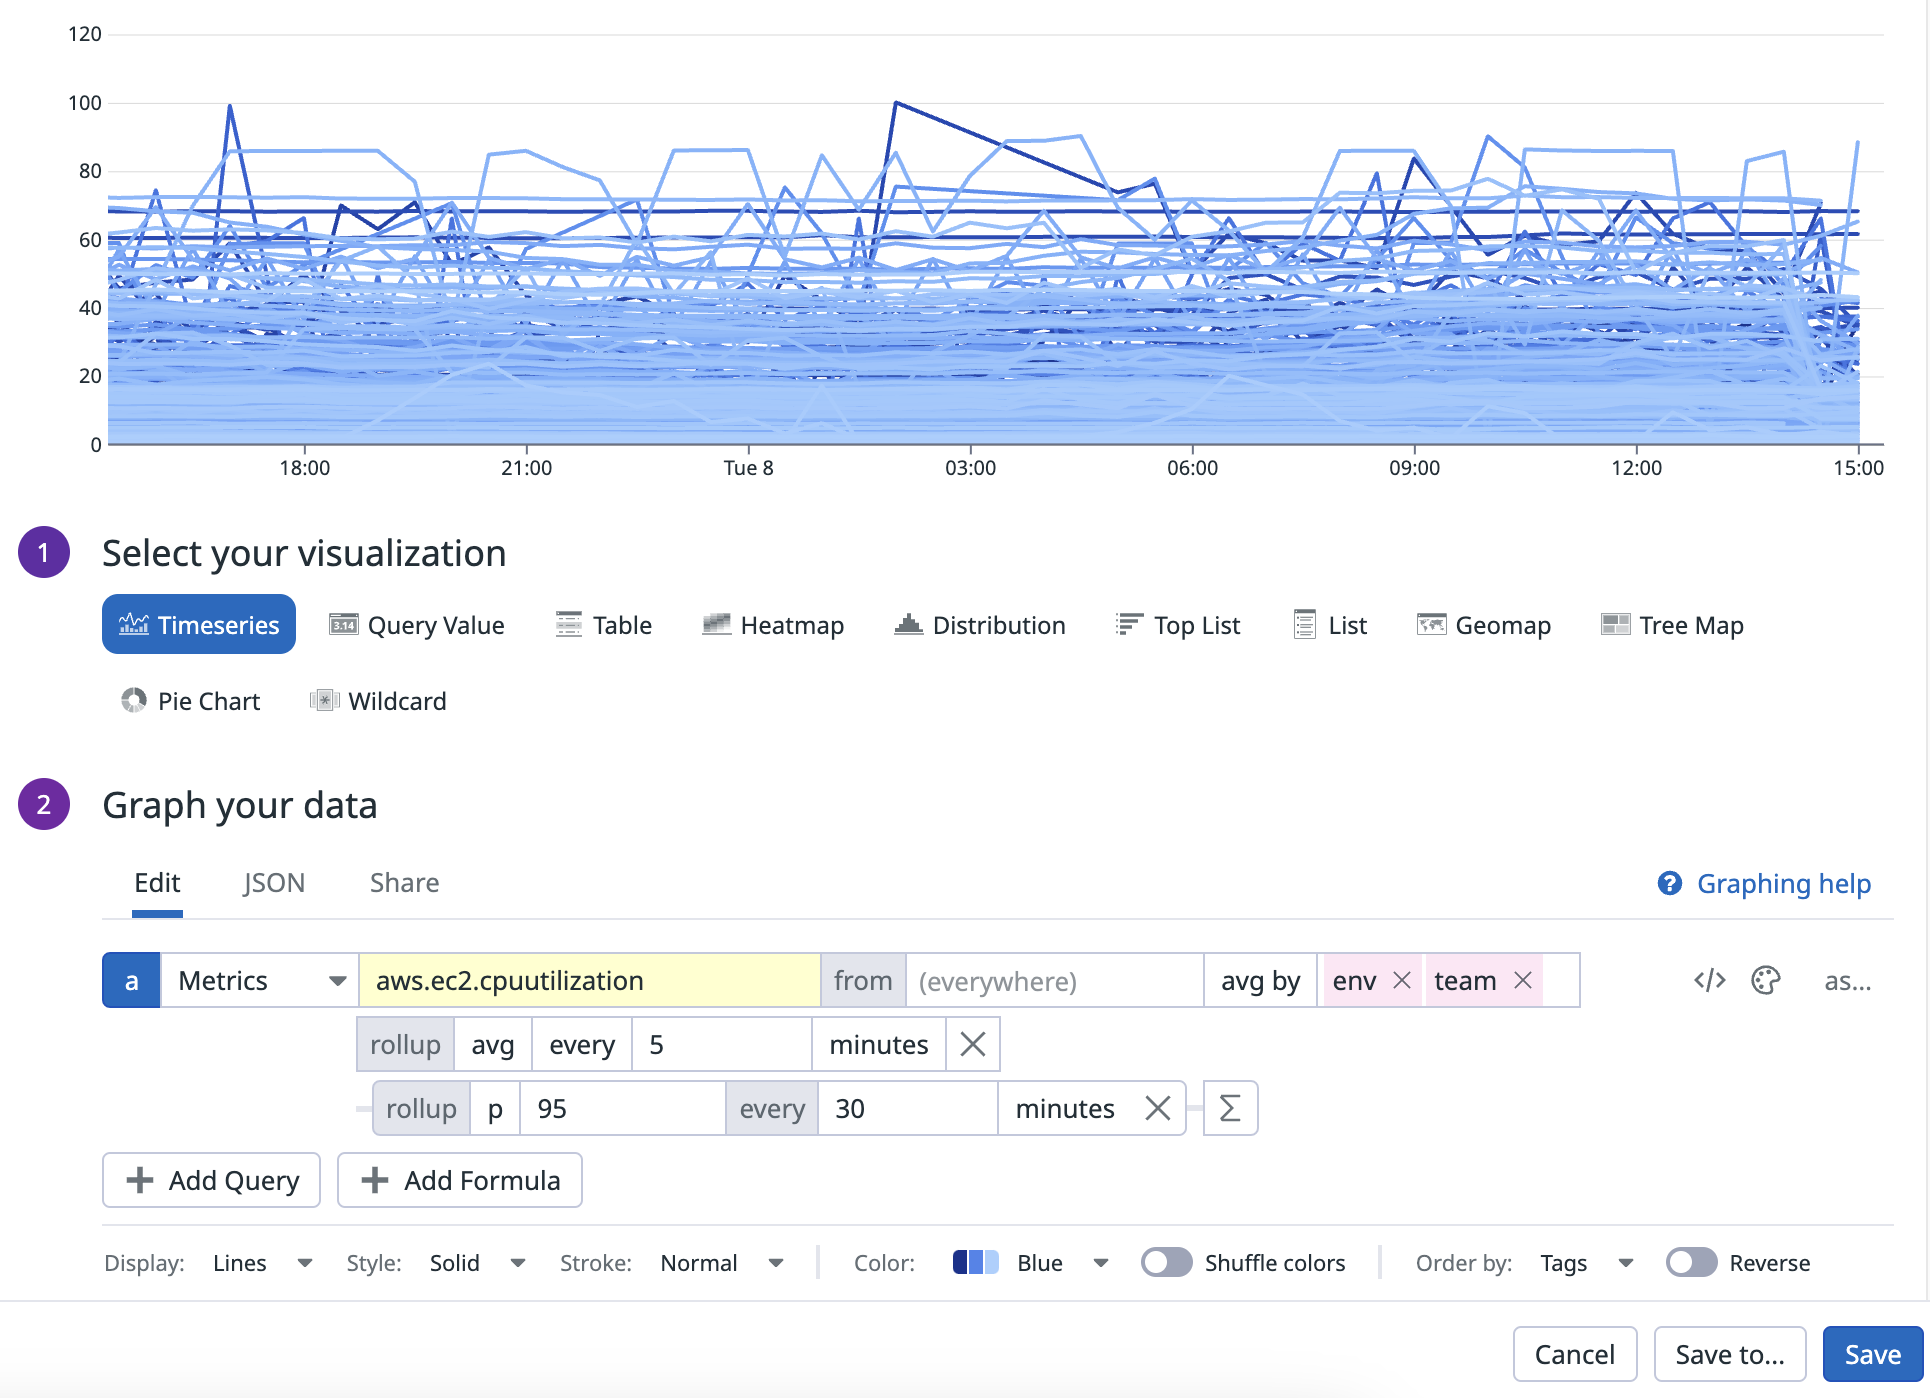
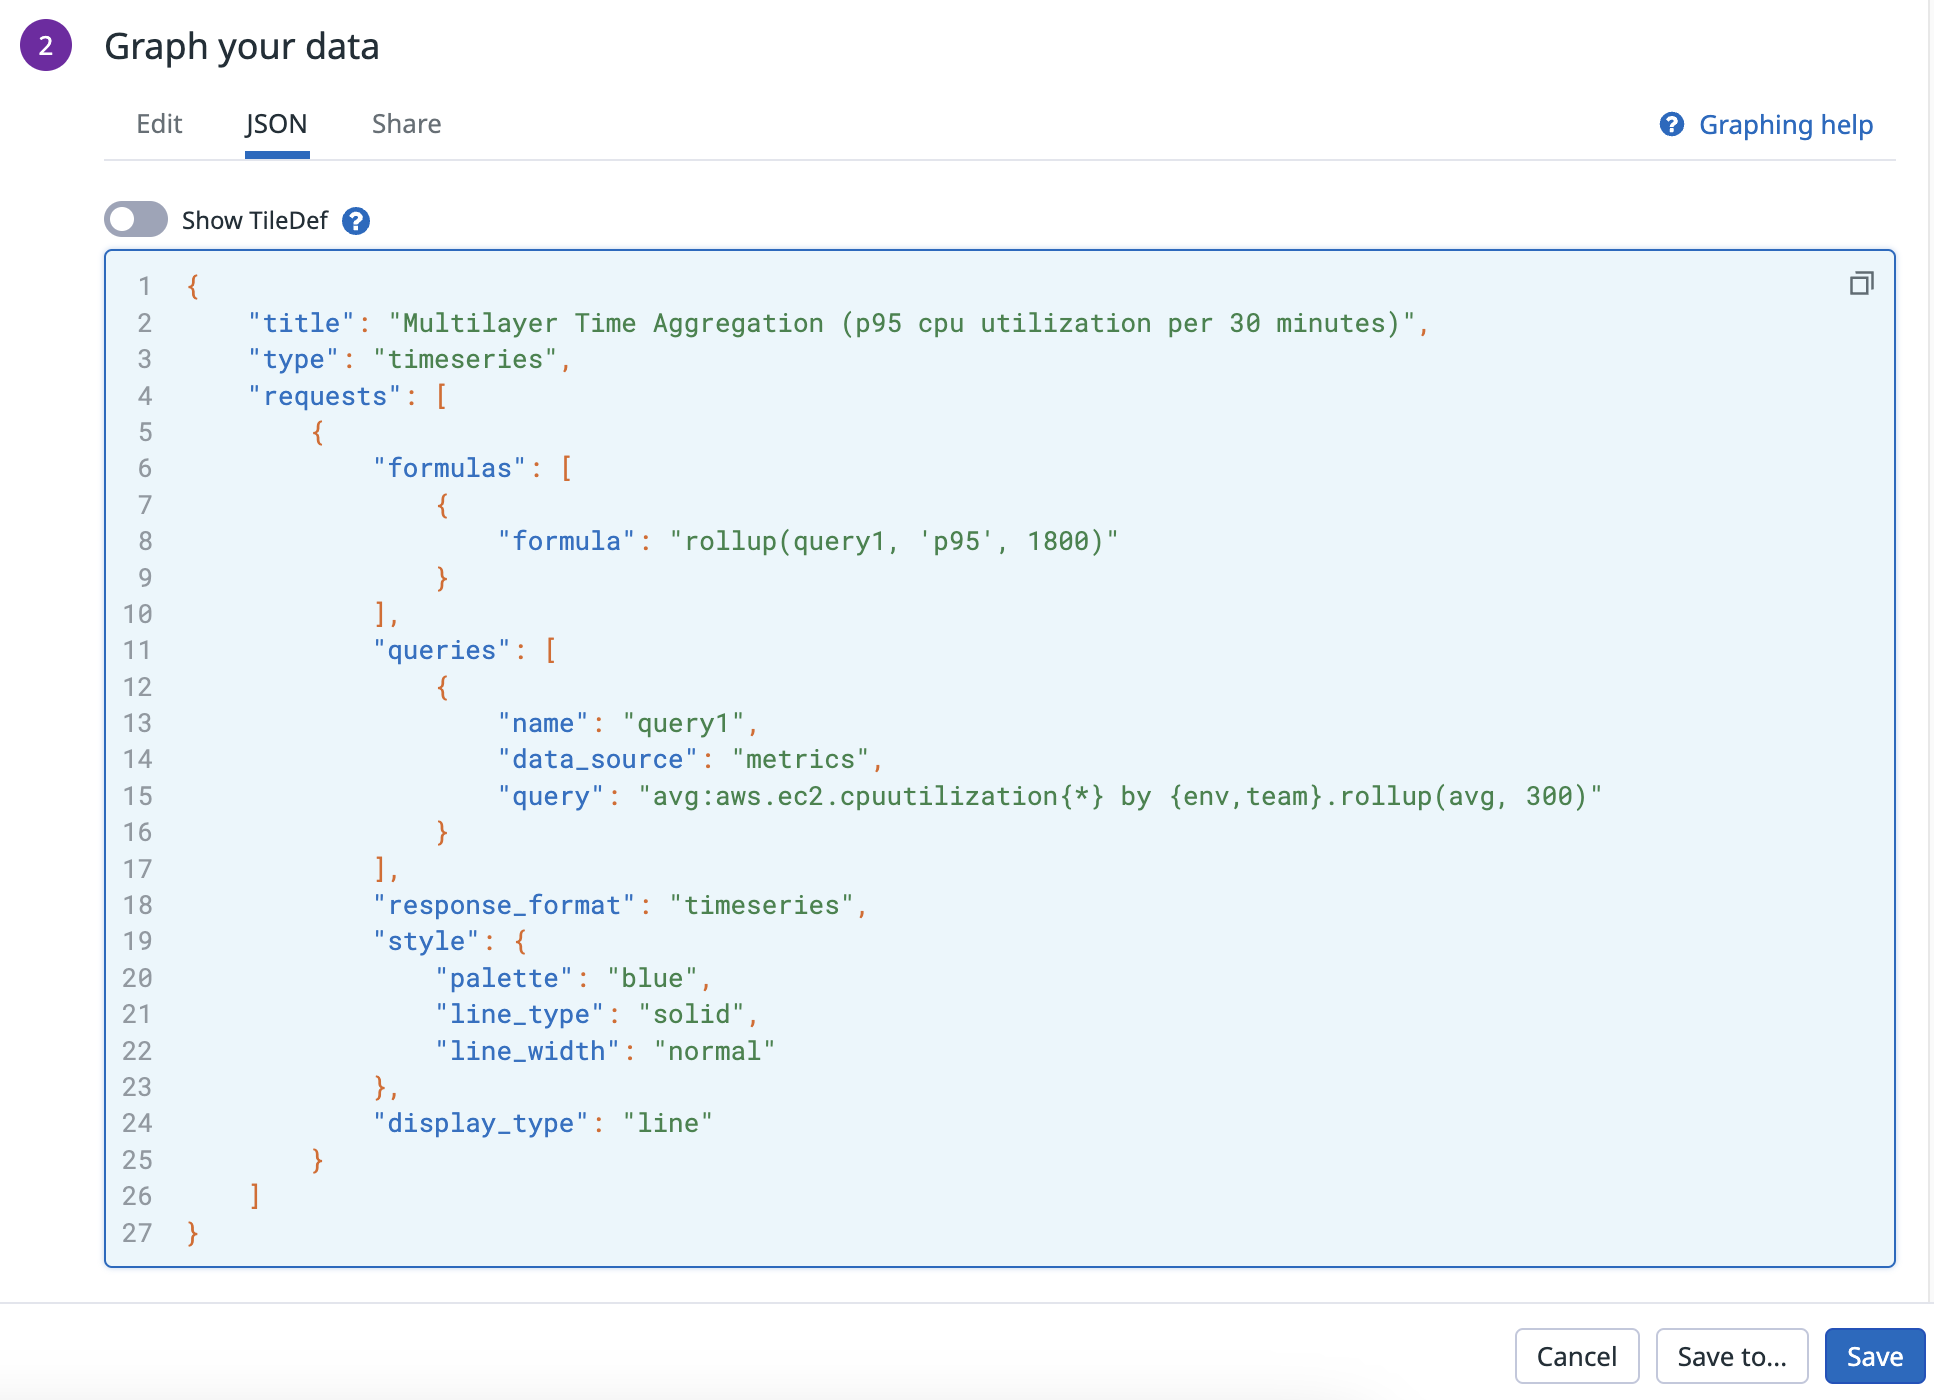
This query first calculates the average CPU utilization for each EC2 instance grouped by env and team, rolled up into 5-minute intervals. Then multilayer time aggregation is applied to calculate the 95th percentile in time of this nested query over 30m intervals.
Multilayer space aggregation
After you specify tag(s) in your first layer of space aggregation to group by, access multilayer space aggregation with the Group By function.
You can apply additional layers of space aggregation with subsequent Group Bys.
Note: if you do not specify tag(s) to group by in your initial space aggregation layer, multilayer space aggregation will not be available.
The first layer of space aggregation supports the following aggregators:
avg bysum bymin bymax by
Additional layers of space aggregation support:
avg bysum bymin bymax byarbitrary percentile pXX(p75, p99, p99.99, etc.)stddev by
Multilayer space aggregation can be used with the following functions:
| Supported Functions | Description |
|---|---|
| Arithmetic operators | +, -, *, / |
| Timeshift functions | <METRIC_NAME>{*}, -<TIME_IN_SECOND>hour_before(<METRIC_NAME>{*})day_before(<METRIC_NAME>{*})week_before(<METRIC_NAME>{*})month_before(<METRIC_NAME>{*}) |
| Top-k selection | top(<METRIC_NAME>{*}, <LIMIT_TO>, '<BY>', '<DIR>') |
Any other functions not listed above cannot be combined with multilayer space aggregation.
All space aggregators with the exception of percentile space aggregators have one argument, which is the tag key(s) you want to group by. Percentile space aggregators require two arguments:
- The arbitrary percentile pXX
- The tag(s) to group by
Space aggregation example queries
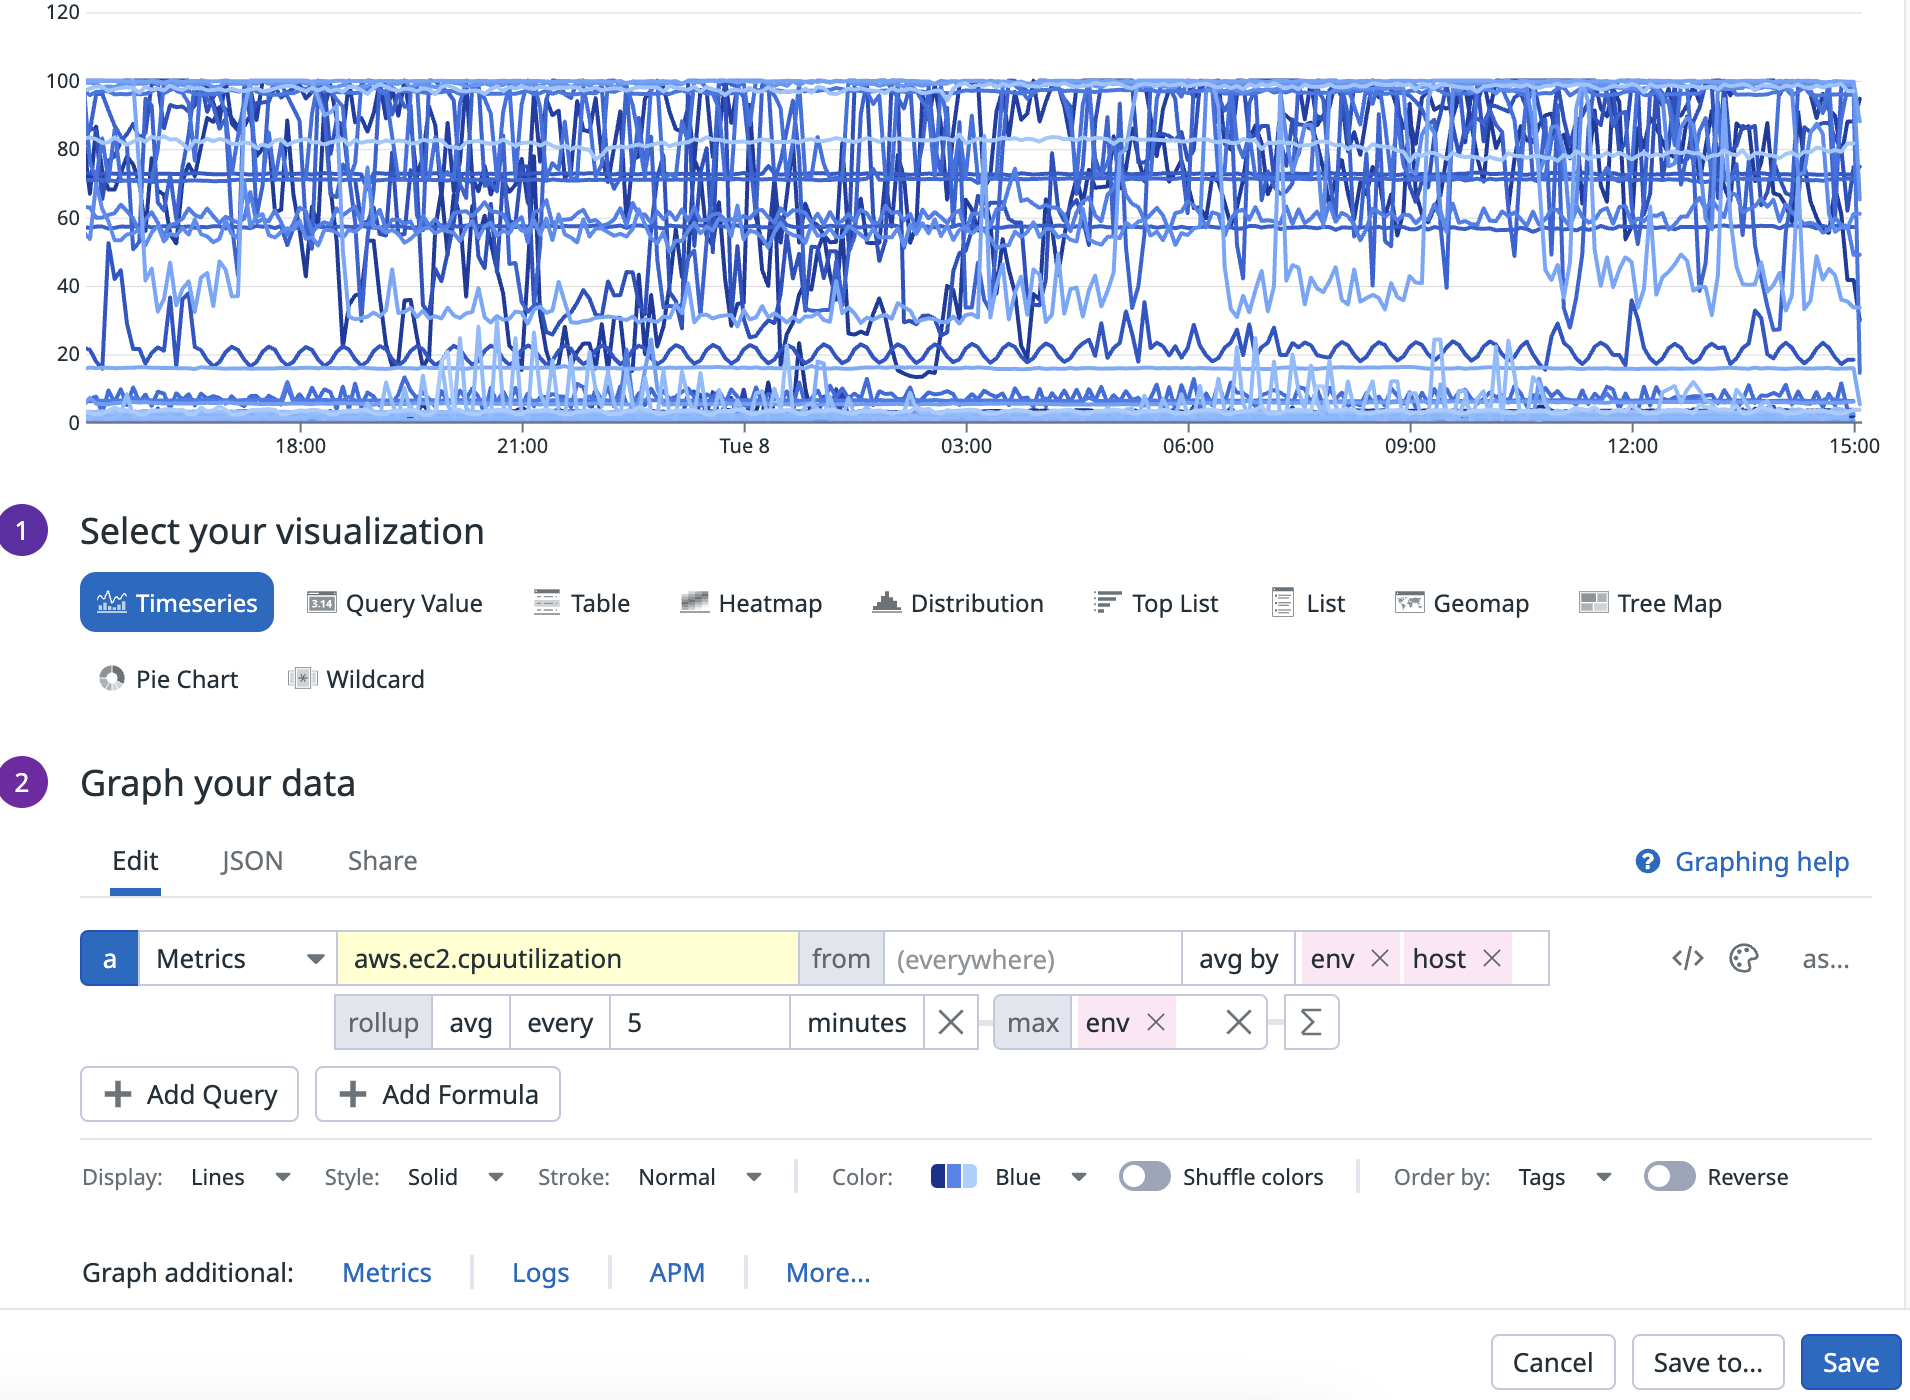
Space aggregation example queries
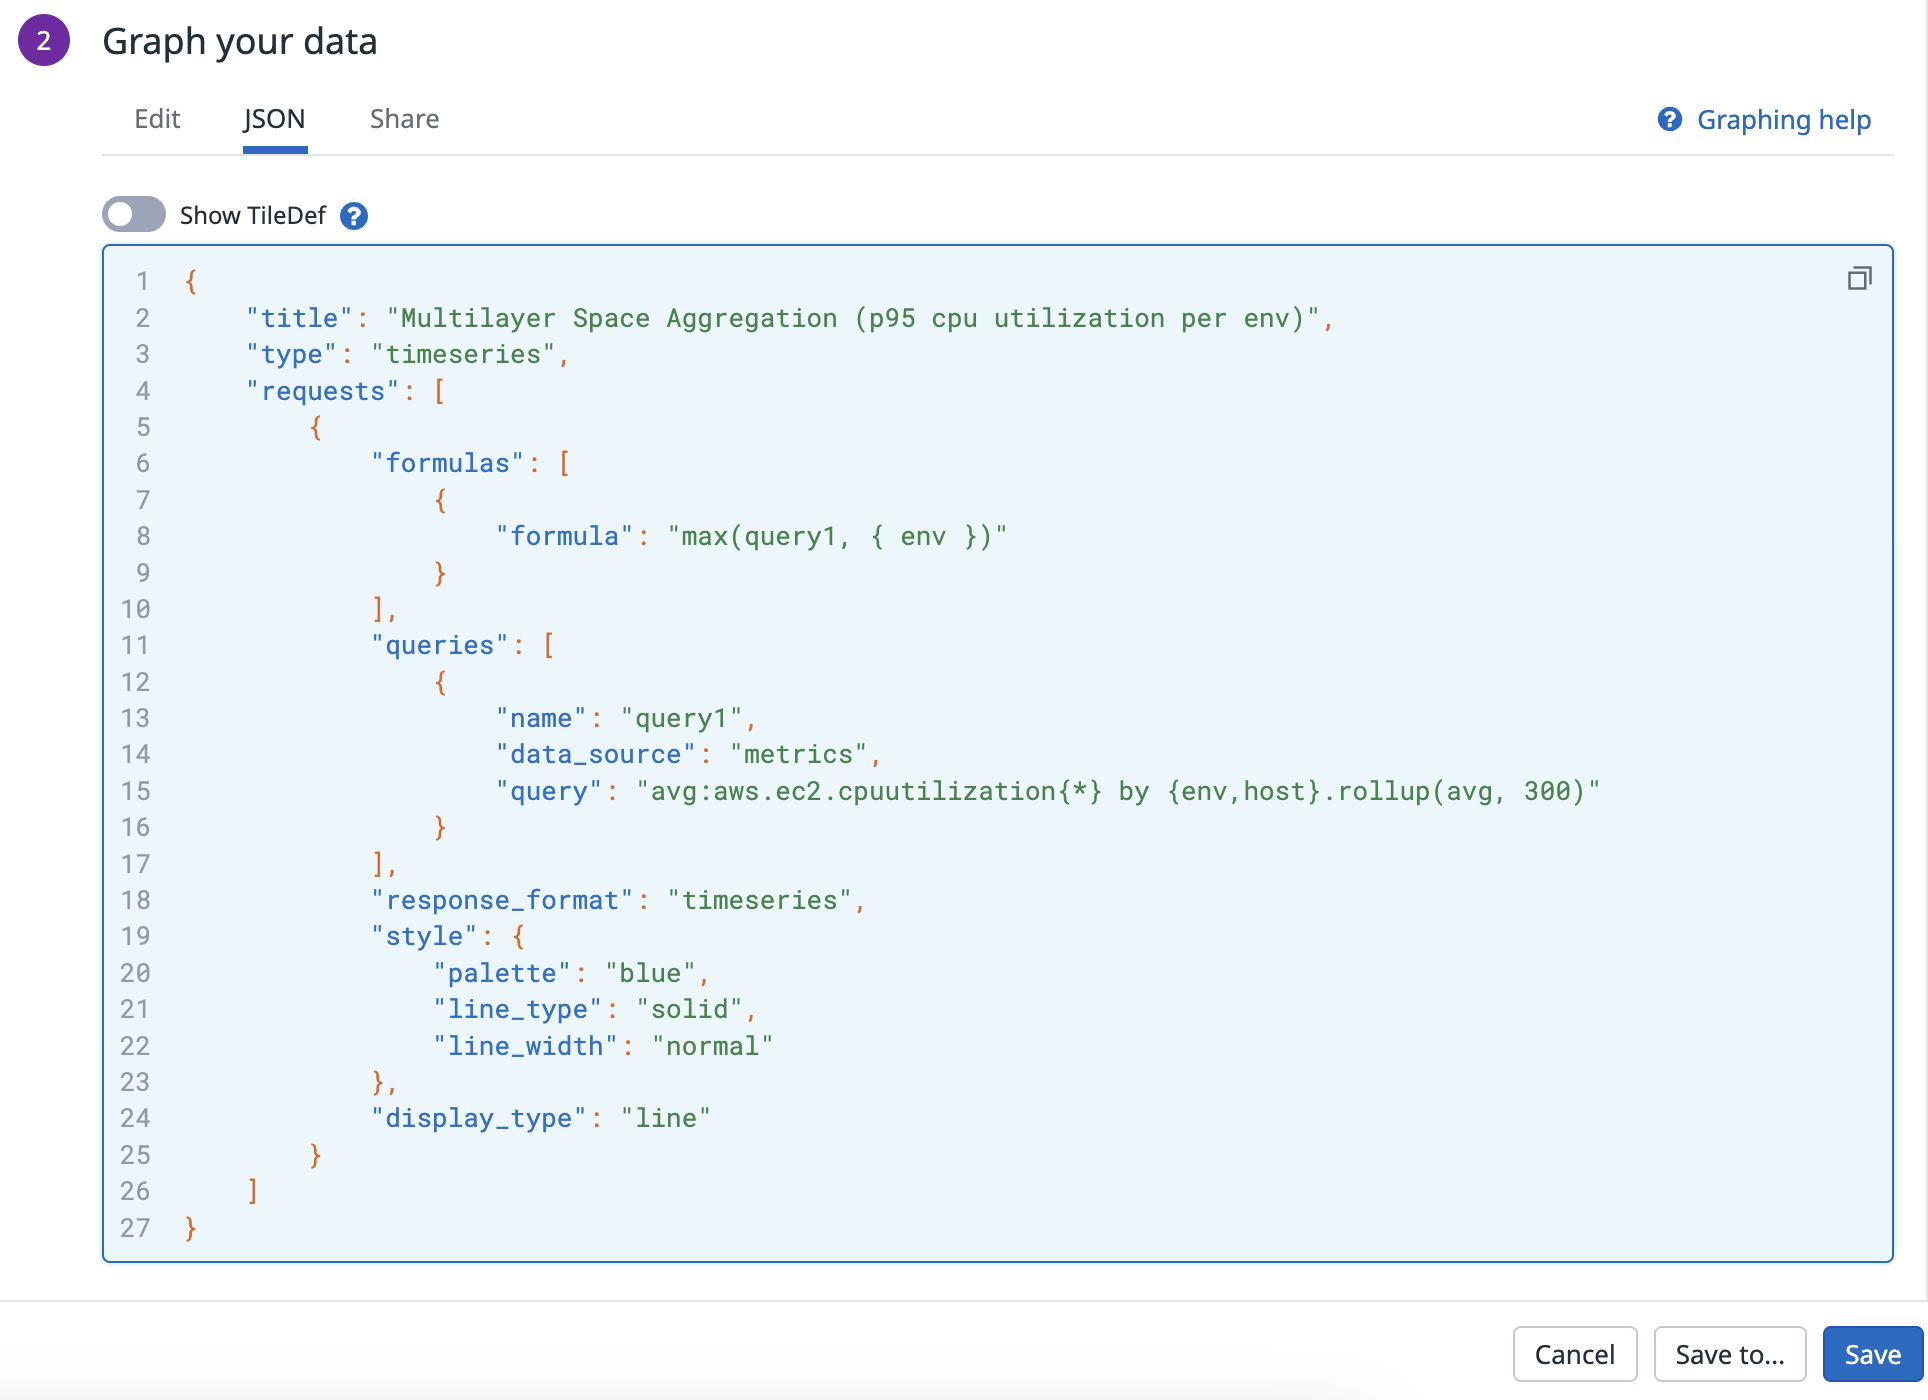
This initial query, avg:aws.ec2.cpuutilization{*} by {env,host}.rollup(avg, 300) calculates the sum of average CPU utilization, grouped by env and host every 5 minutes. Then multilayer space aggregation is applied to calculate maximum value of the average CPU utilization by env.
In the UI or JSON tab, it would look as follows:
Percentiles and Standard Deviation for aggregated counts, rates, and gauges
You can use multilayer aggregation (time and space) to query percentiles and standard deviation from queries on counts, rates, and gauges. They allow you to better understand the variability and spread of your large datasets and allow you to better identify outliers.
Note: The percentile or standard deviation aggregators in Nested queries are calculated using the results of an existing, aggregated count, rate, or gauge metrics. For globally accurate percentiles that are computed on unaggregated, raw values of a metric, use distribution metrics instead.
Percentiles in Multilayer Time Aggregation example query
Percentiles in Multilayer Time Aggregation example query
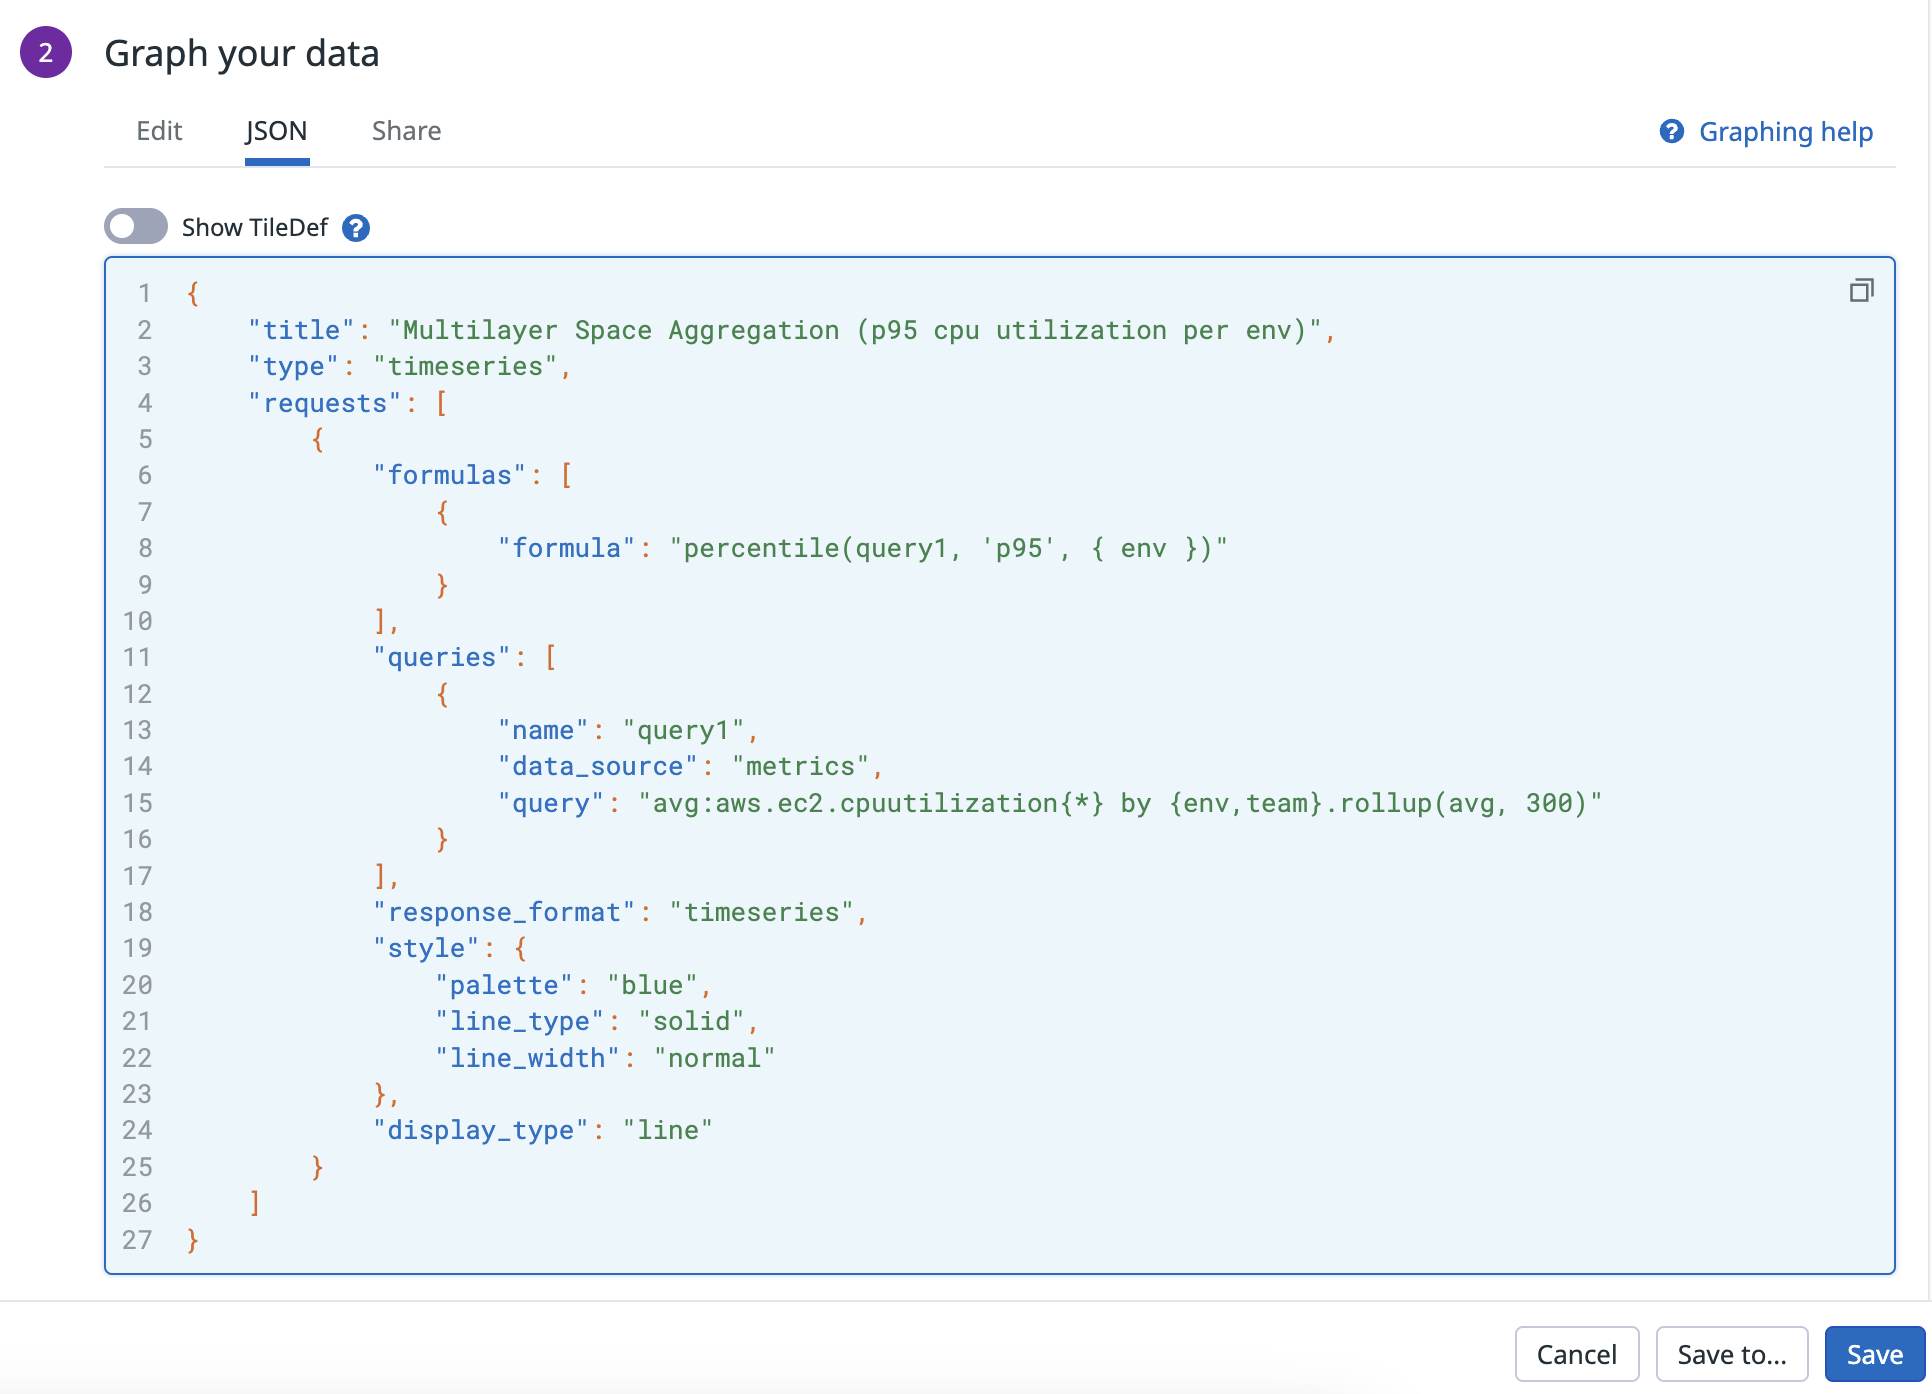
We can use percentiles in multilayer time aggregation to summarize the results of our nested query (avg CPU utilization by env and team every 5 minutes) by calculating the p95th value of this nested query every 30 minutes.
Percentiles in Multilayer Space Aggregation example query
Percentiles in Multilayer Space Aggregation example query
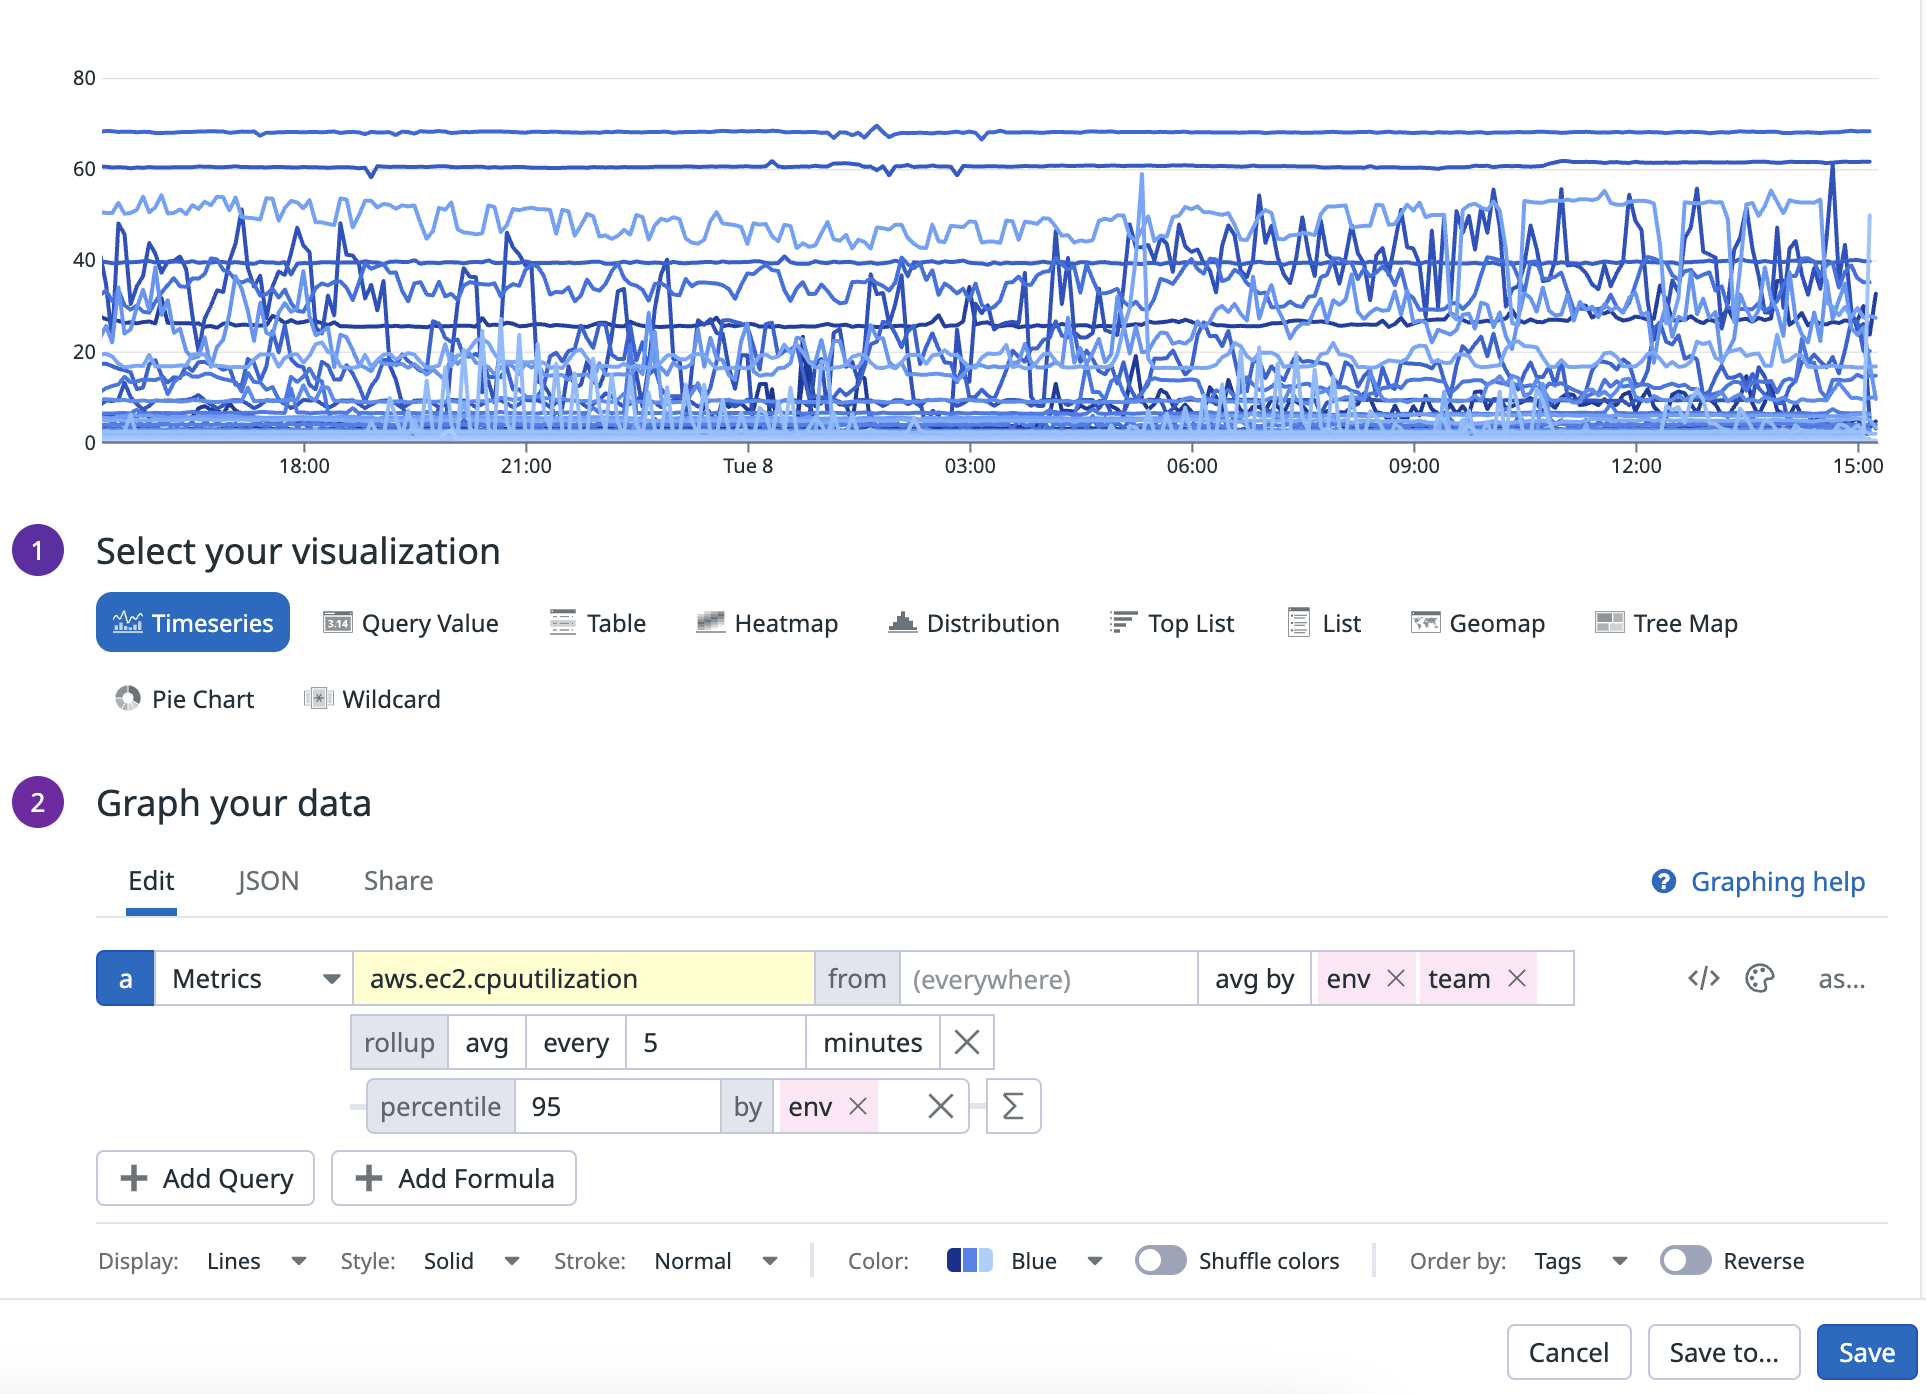
We can use percentiles in multilayer space aggregation to summarize the results of our nested query (avg CPU utilization by env and team every 5 minutes) by calculating the p95th value of this nested query for every unique env value.
In the UI or JSON tab, it would look as follows:
Standard deviation example query
Standard deviation example query
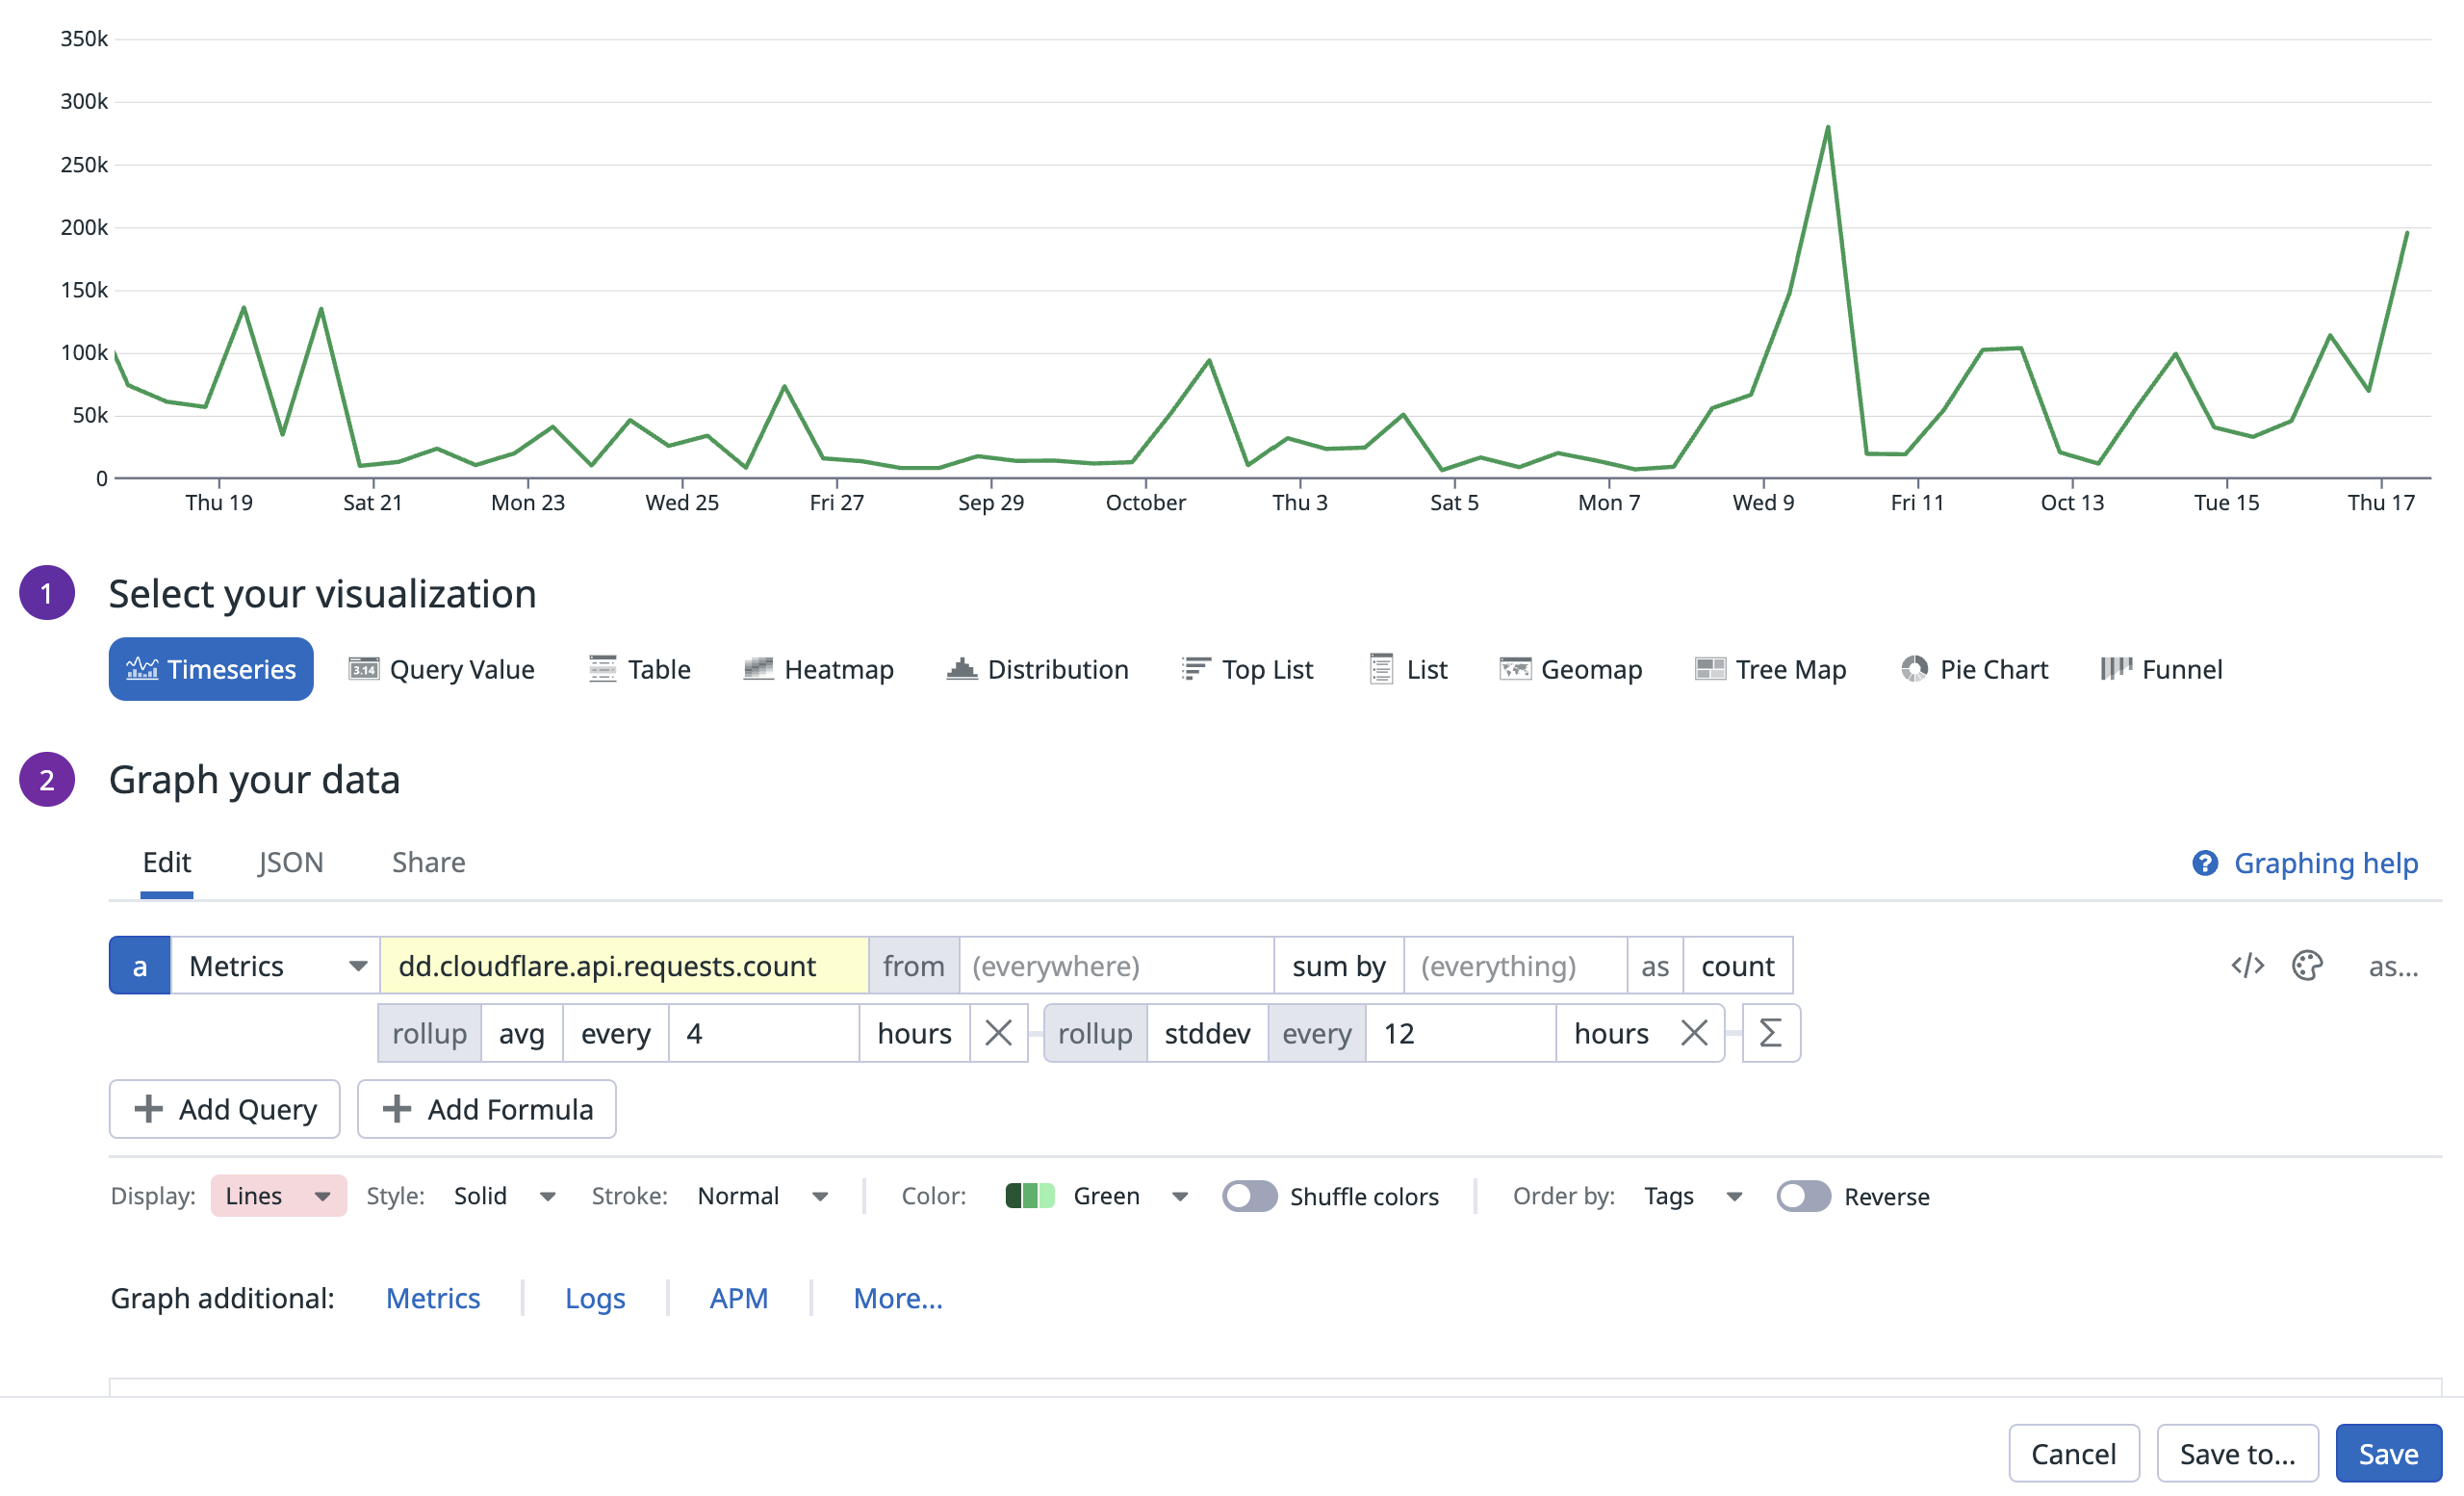
Standard deviation helps measure the variability or dispersion of a dataset. The following query uses standard deviation with multilayer time aggregation to calculate the standard deviation of our nested query (sum of API request counts, averaged over 4 hour) over longer twelve-hour periods:
In the UI or JSON tab, it would look as follows:
Higher resolution queries over historical time frames
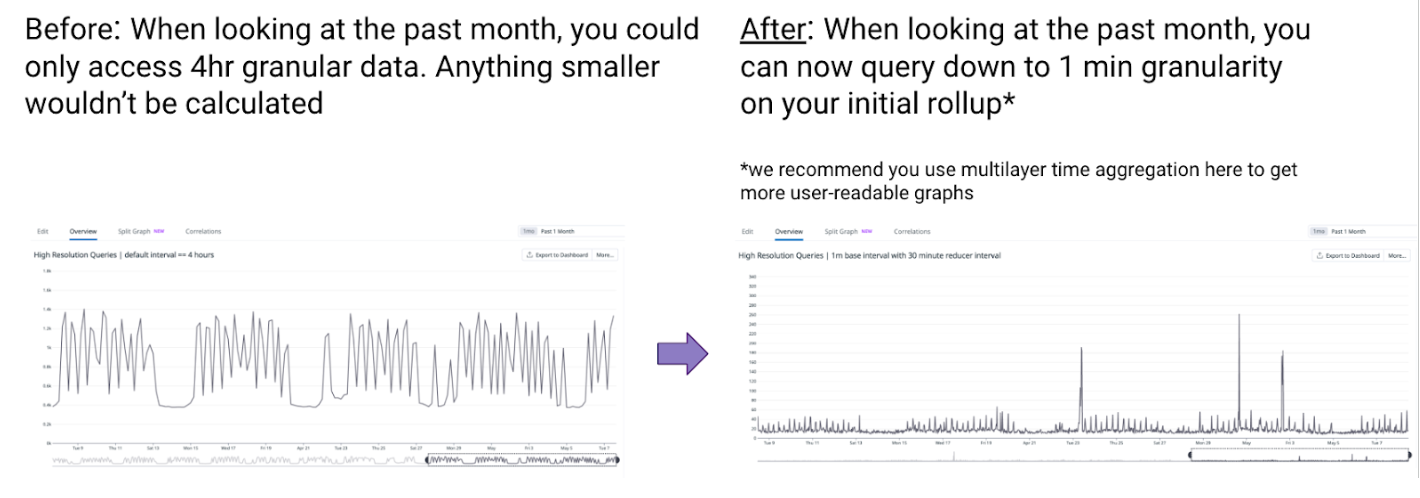
Every metric query contains an initial layer of time aggregation (rollup) which controls the granularity of datapoints shown. Datadog provides default rollup time intervals that increase as your overall query timeframe grows. With nested queries, you can access more granular, high-resolution data over longer, historical timeframes.
Higher resolution example query
Higher resolution example query
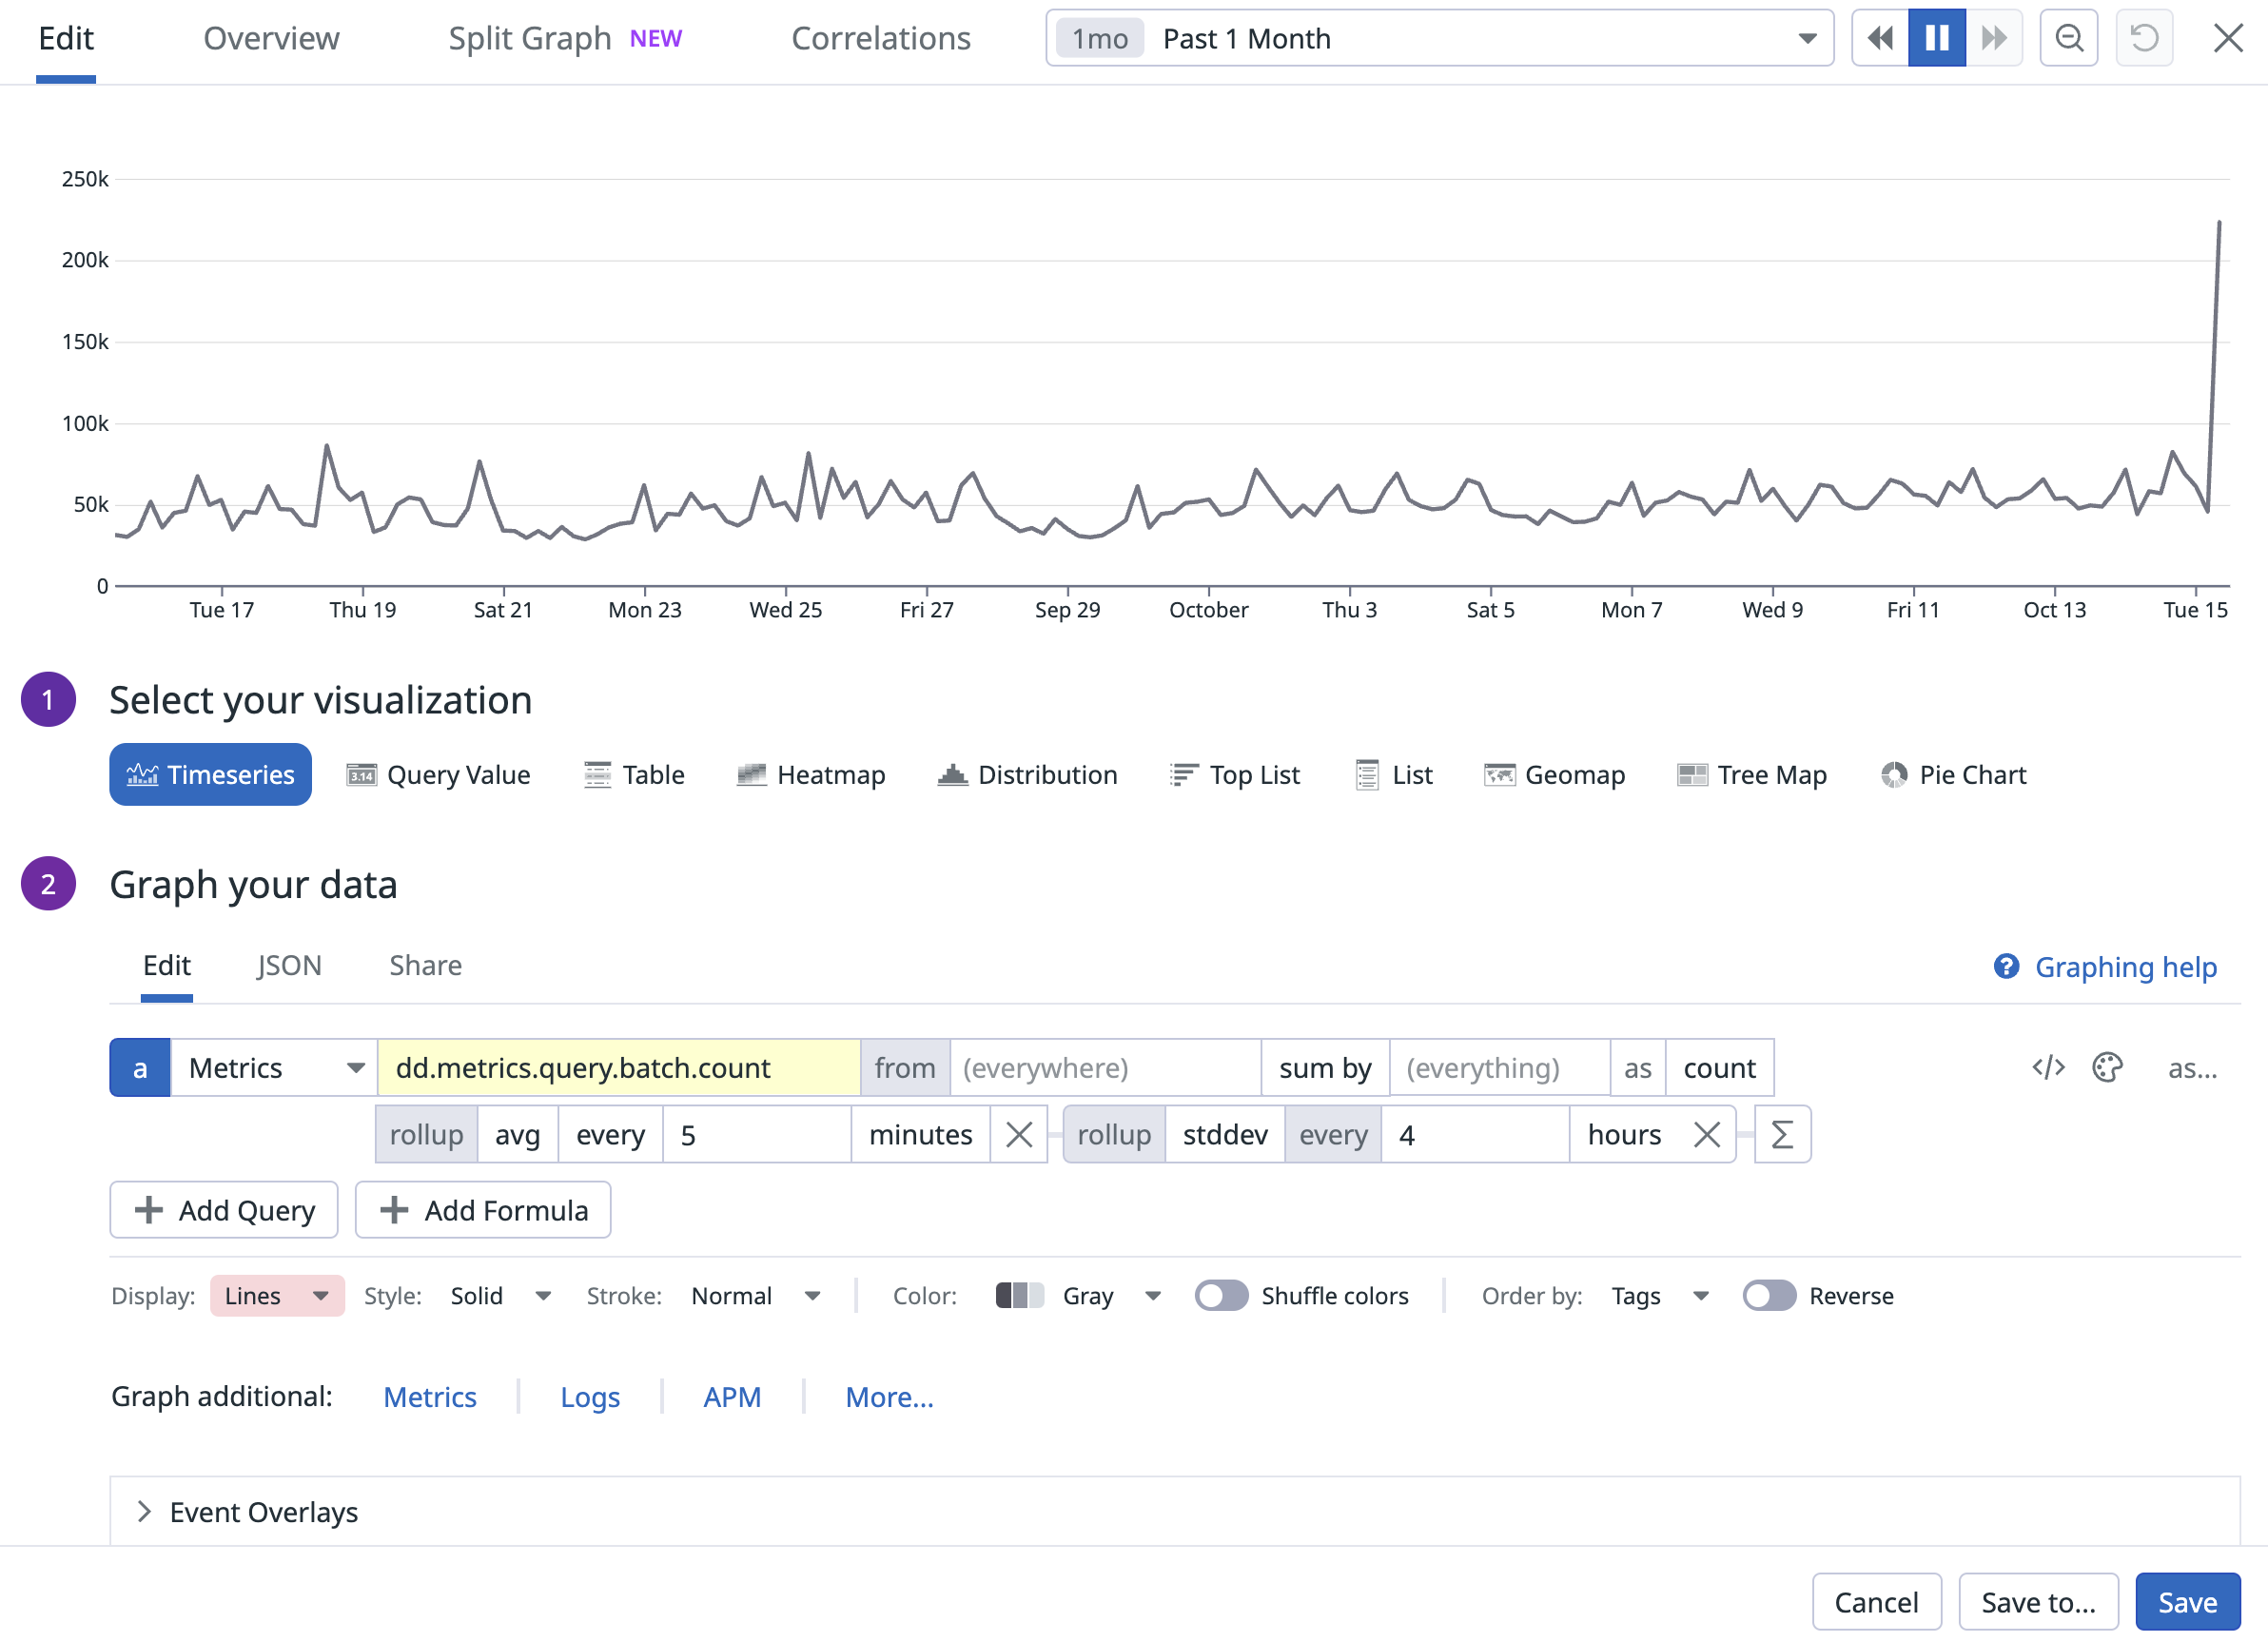
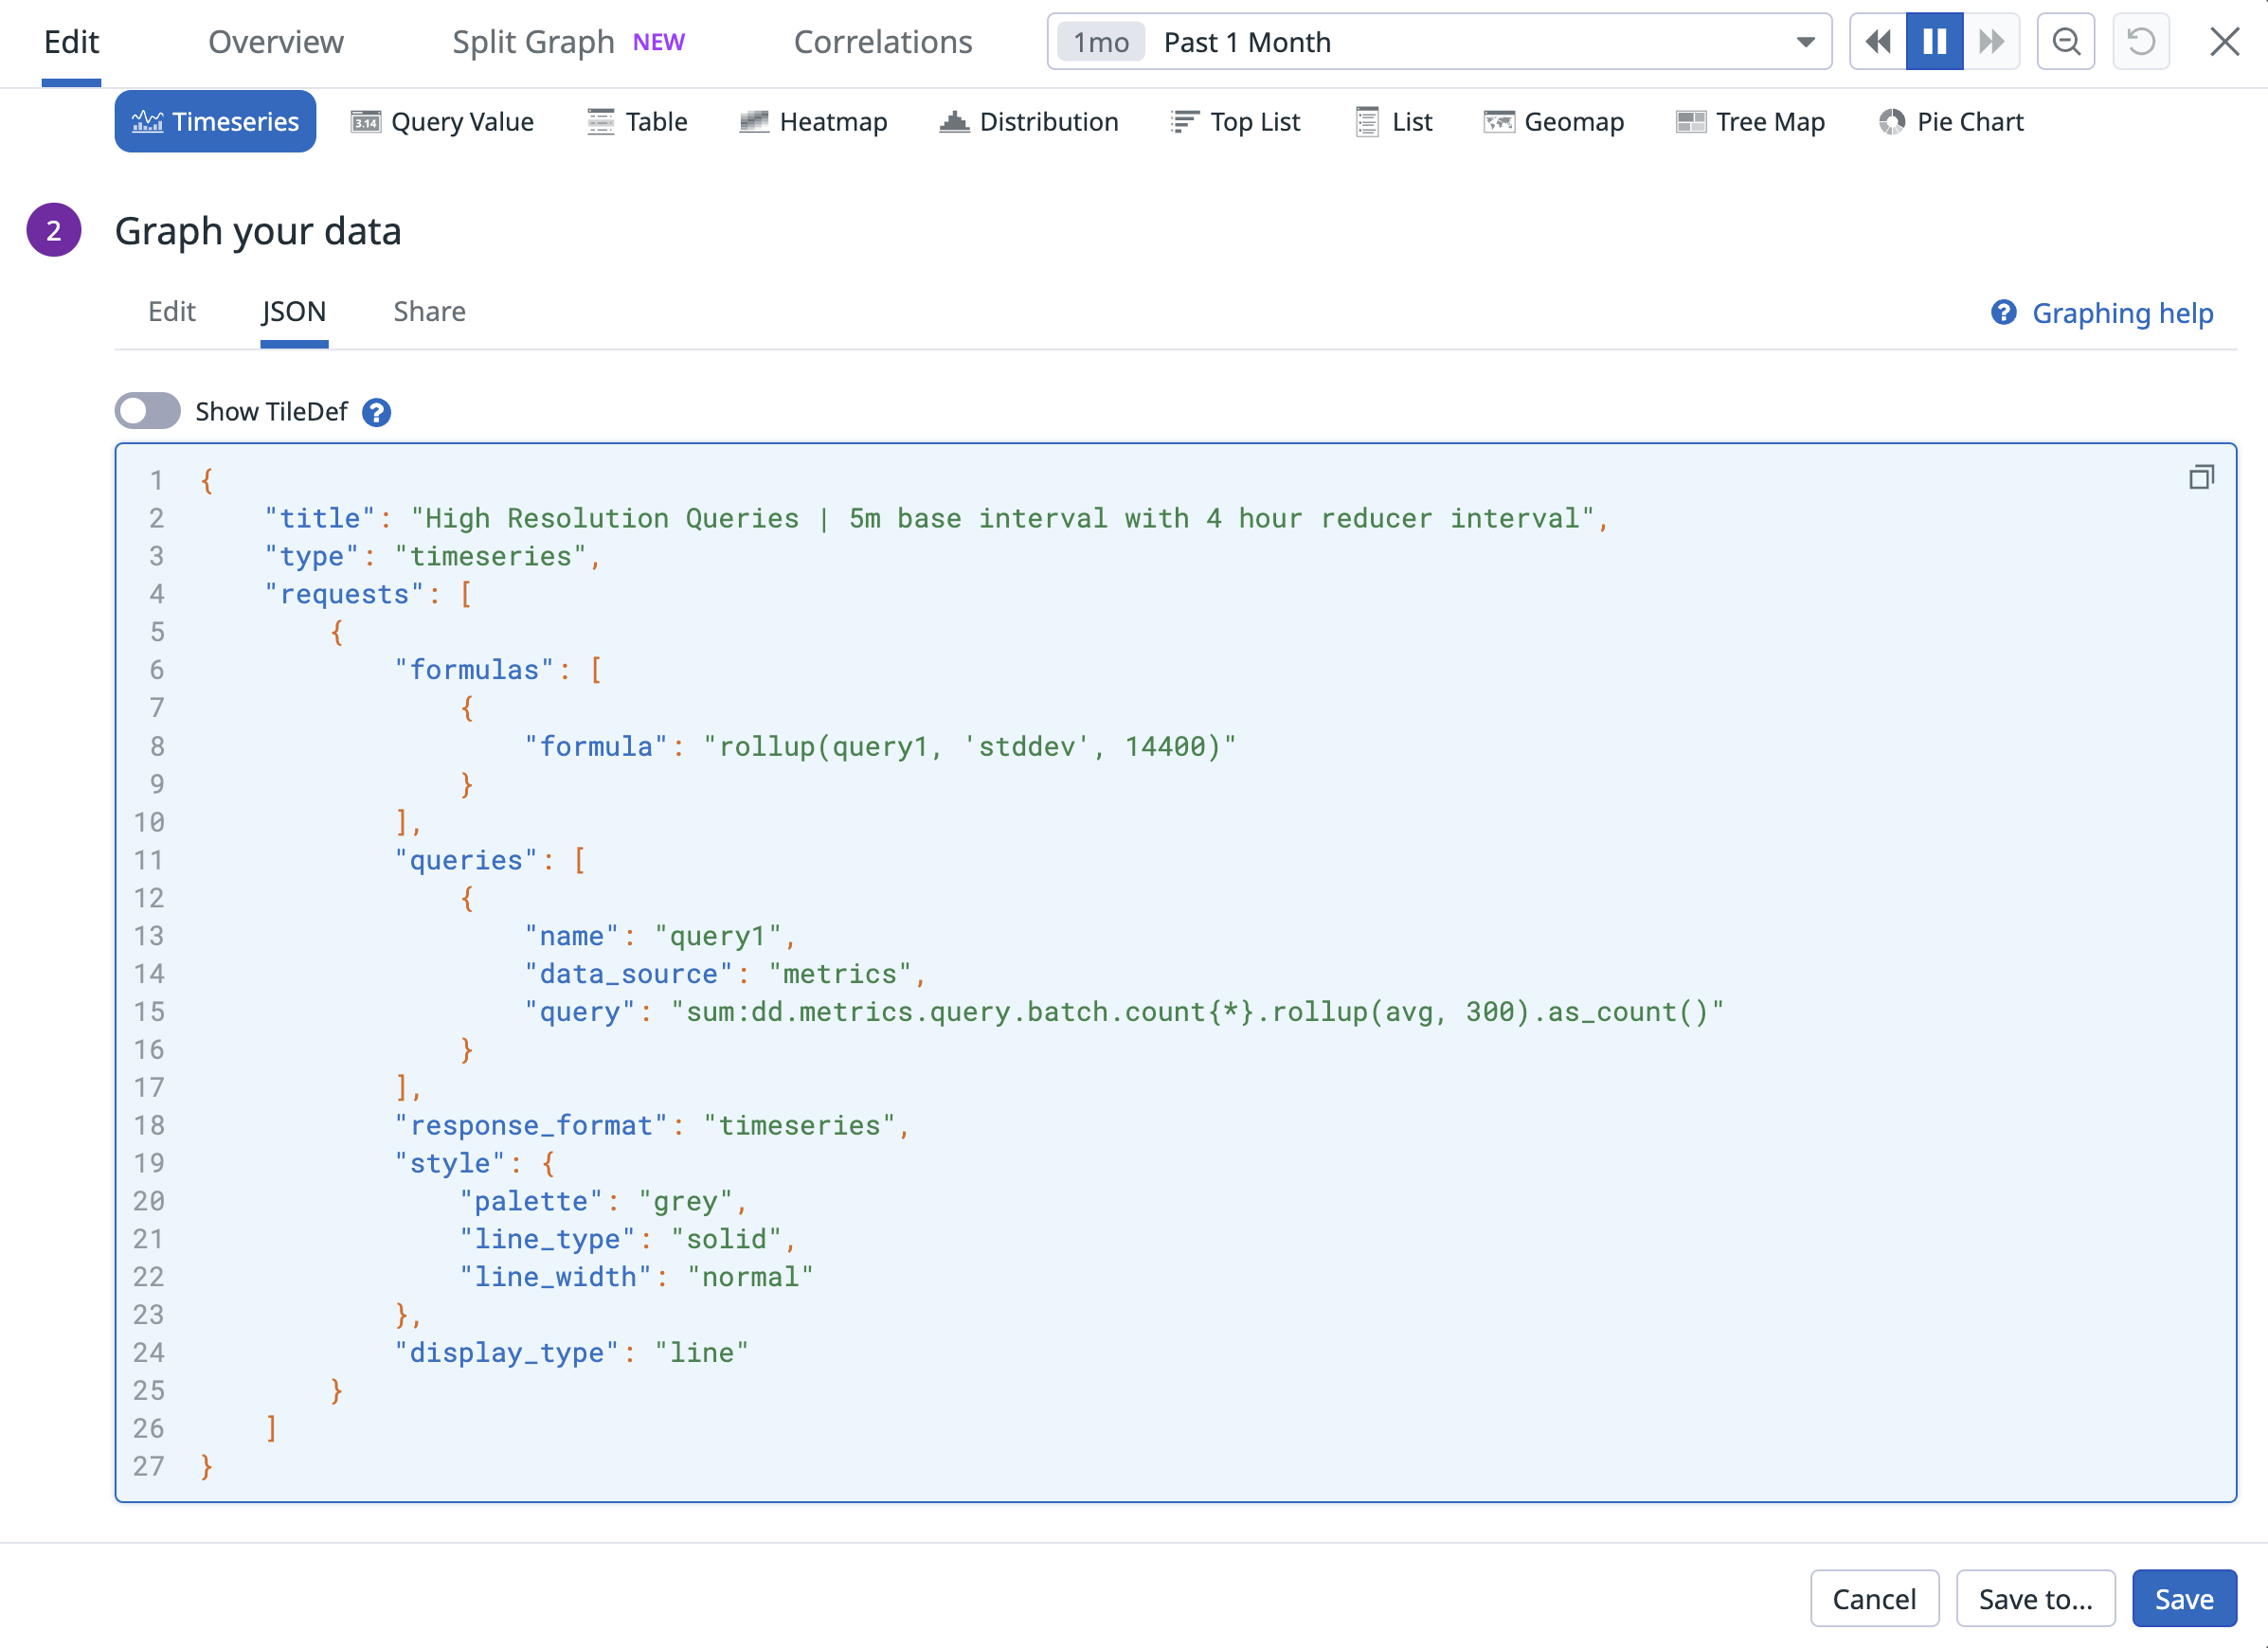
Historically, when querying a metric over the past month, you would see data at 4-hour granularity by default. You can use nested queries to access higher granularity data over this historical timeframe. Here’s an example query graphed over the past month where the query batch count is initially rolled up in 5 minute intervals. Then multilayer time aggregation is applied to calculate the standard deviation in time of this nested query over 4 hour intervals for a more human-readable graph.
Note: Datadog recommends that you define your initial rollup with the most granular rollup interval and use multilayer time aggregation with coarser rollup intervals to get more user-readable graphs.
In the UI or JSON tab, it would look as follows:
Moving rollup
Datadog provides a moving_rollup function that enables aggregation of datapoints over a specified time window. See moving-rollup for more information. By using nested queries, you can extend its functionality to incorporate lookback mode, allowing you to analyze datapoints beyond the original query window. This provides a more comprehensive view of your query’s trends and patterns over the specified time window.
The existing version of the moving_rollup function only supports the following aggregators:
avgsumminmaxmedian
When nesting queries, only the lookback mode version of the moving_rollup function can be used. This version of the function supports the following aggregators:
avgsumminmaxcountcount byarbitrary percentile pxx(p78, p99, p99.99, etc.)stddev
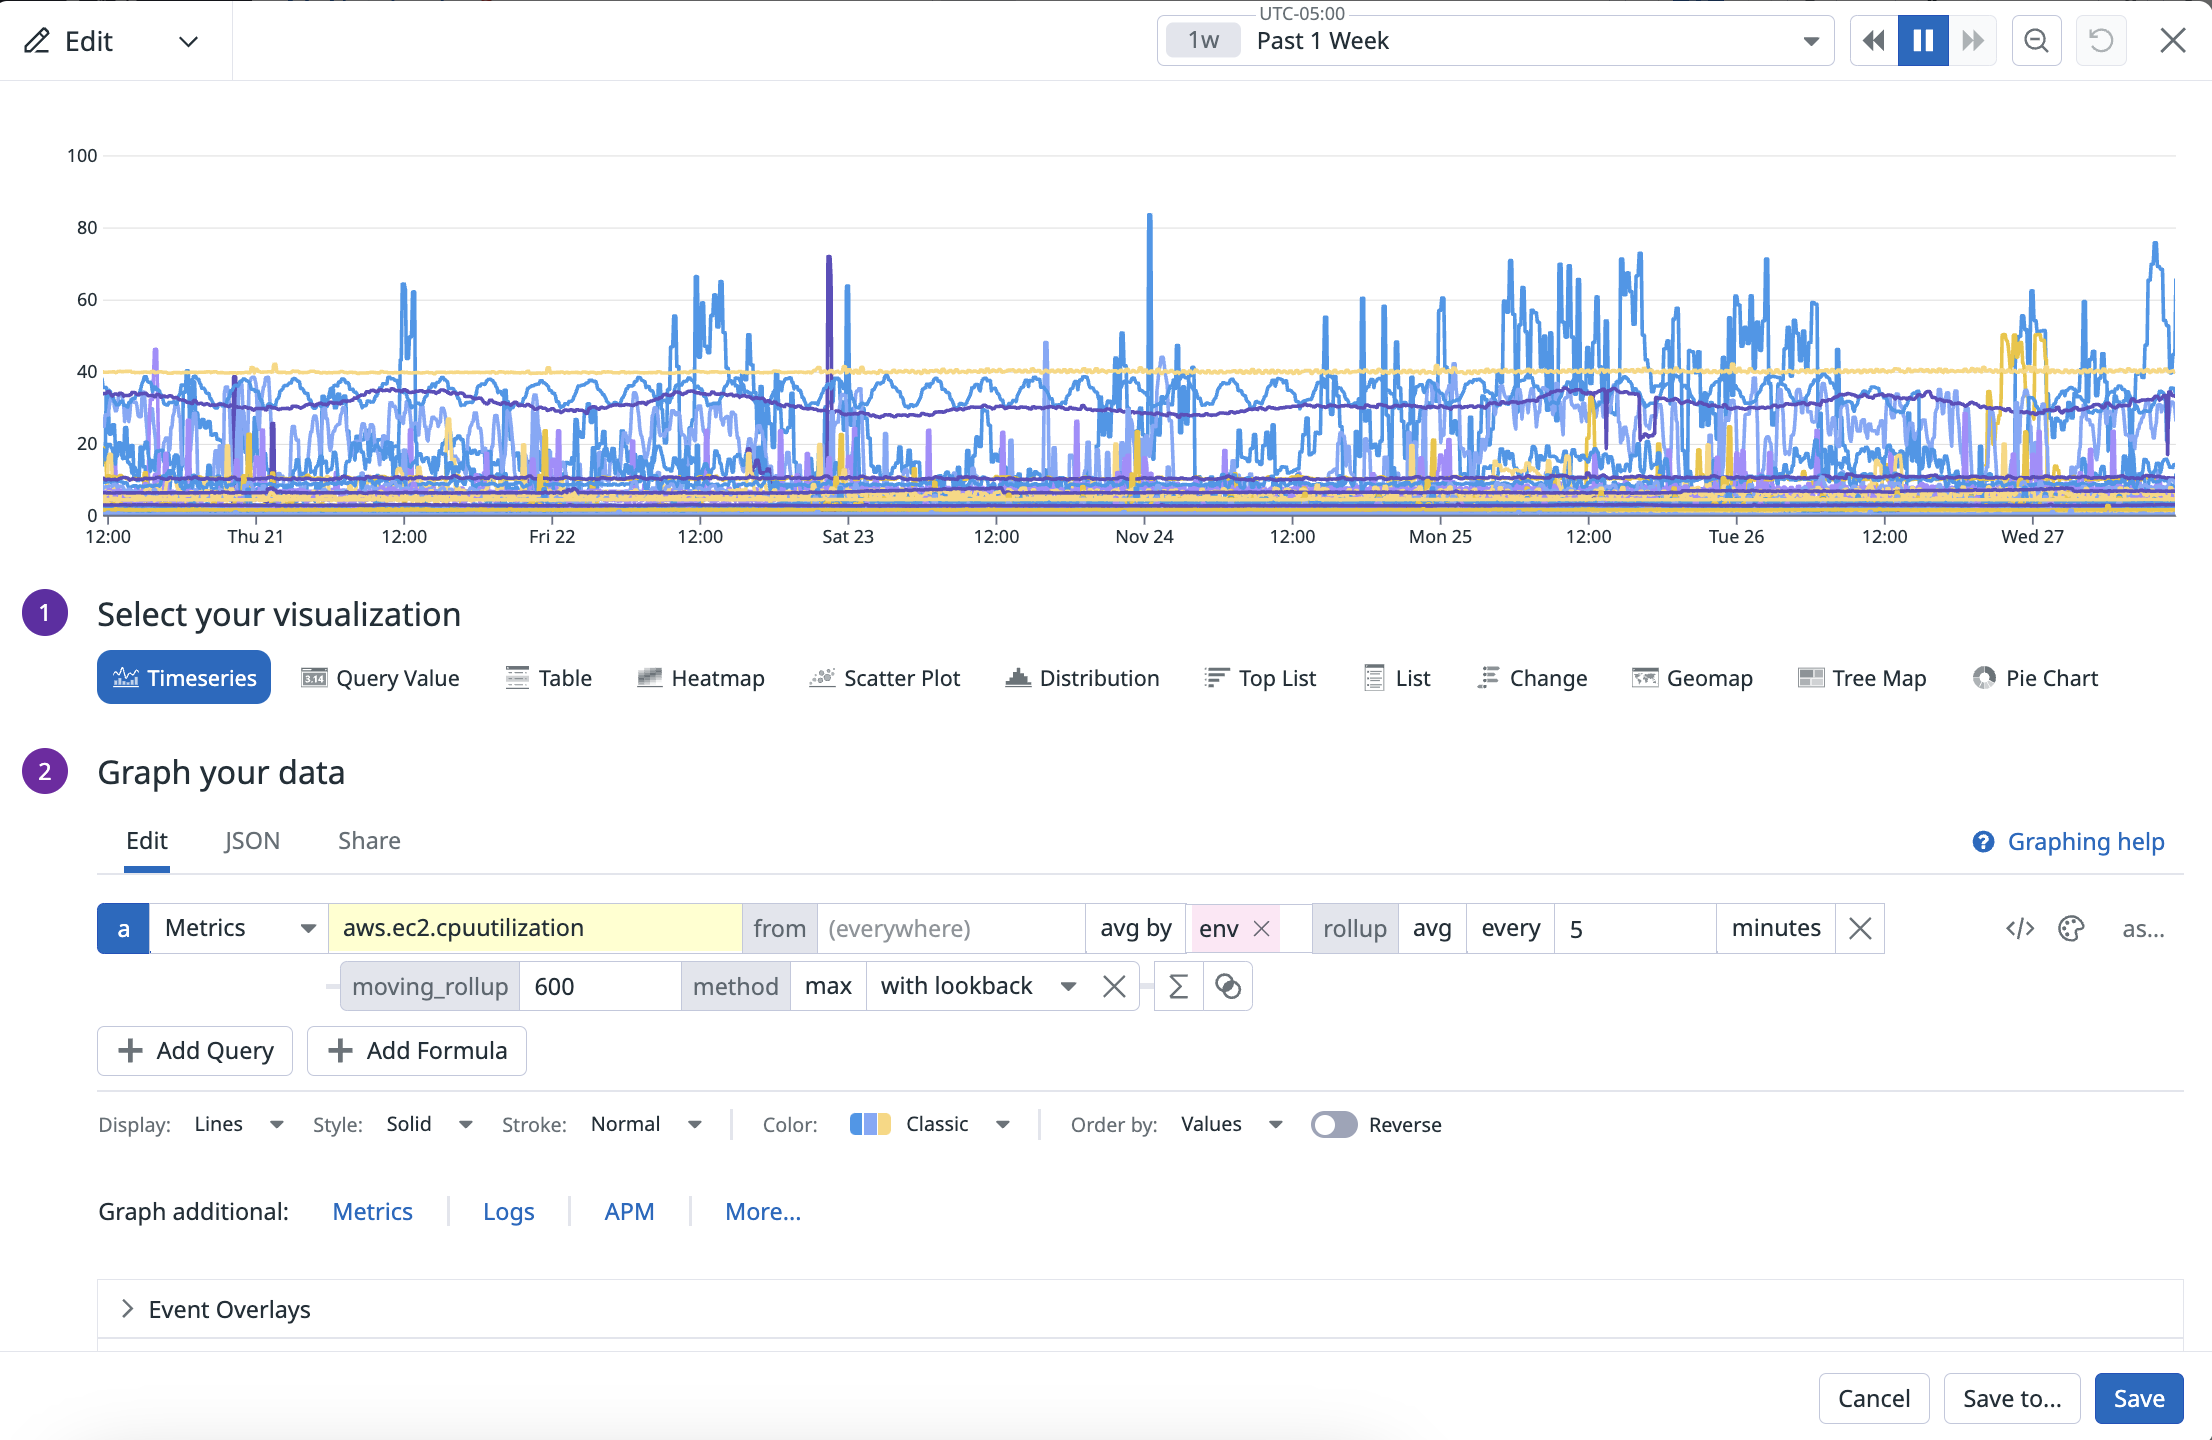
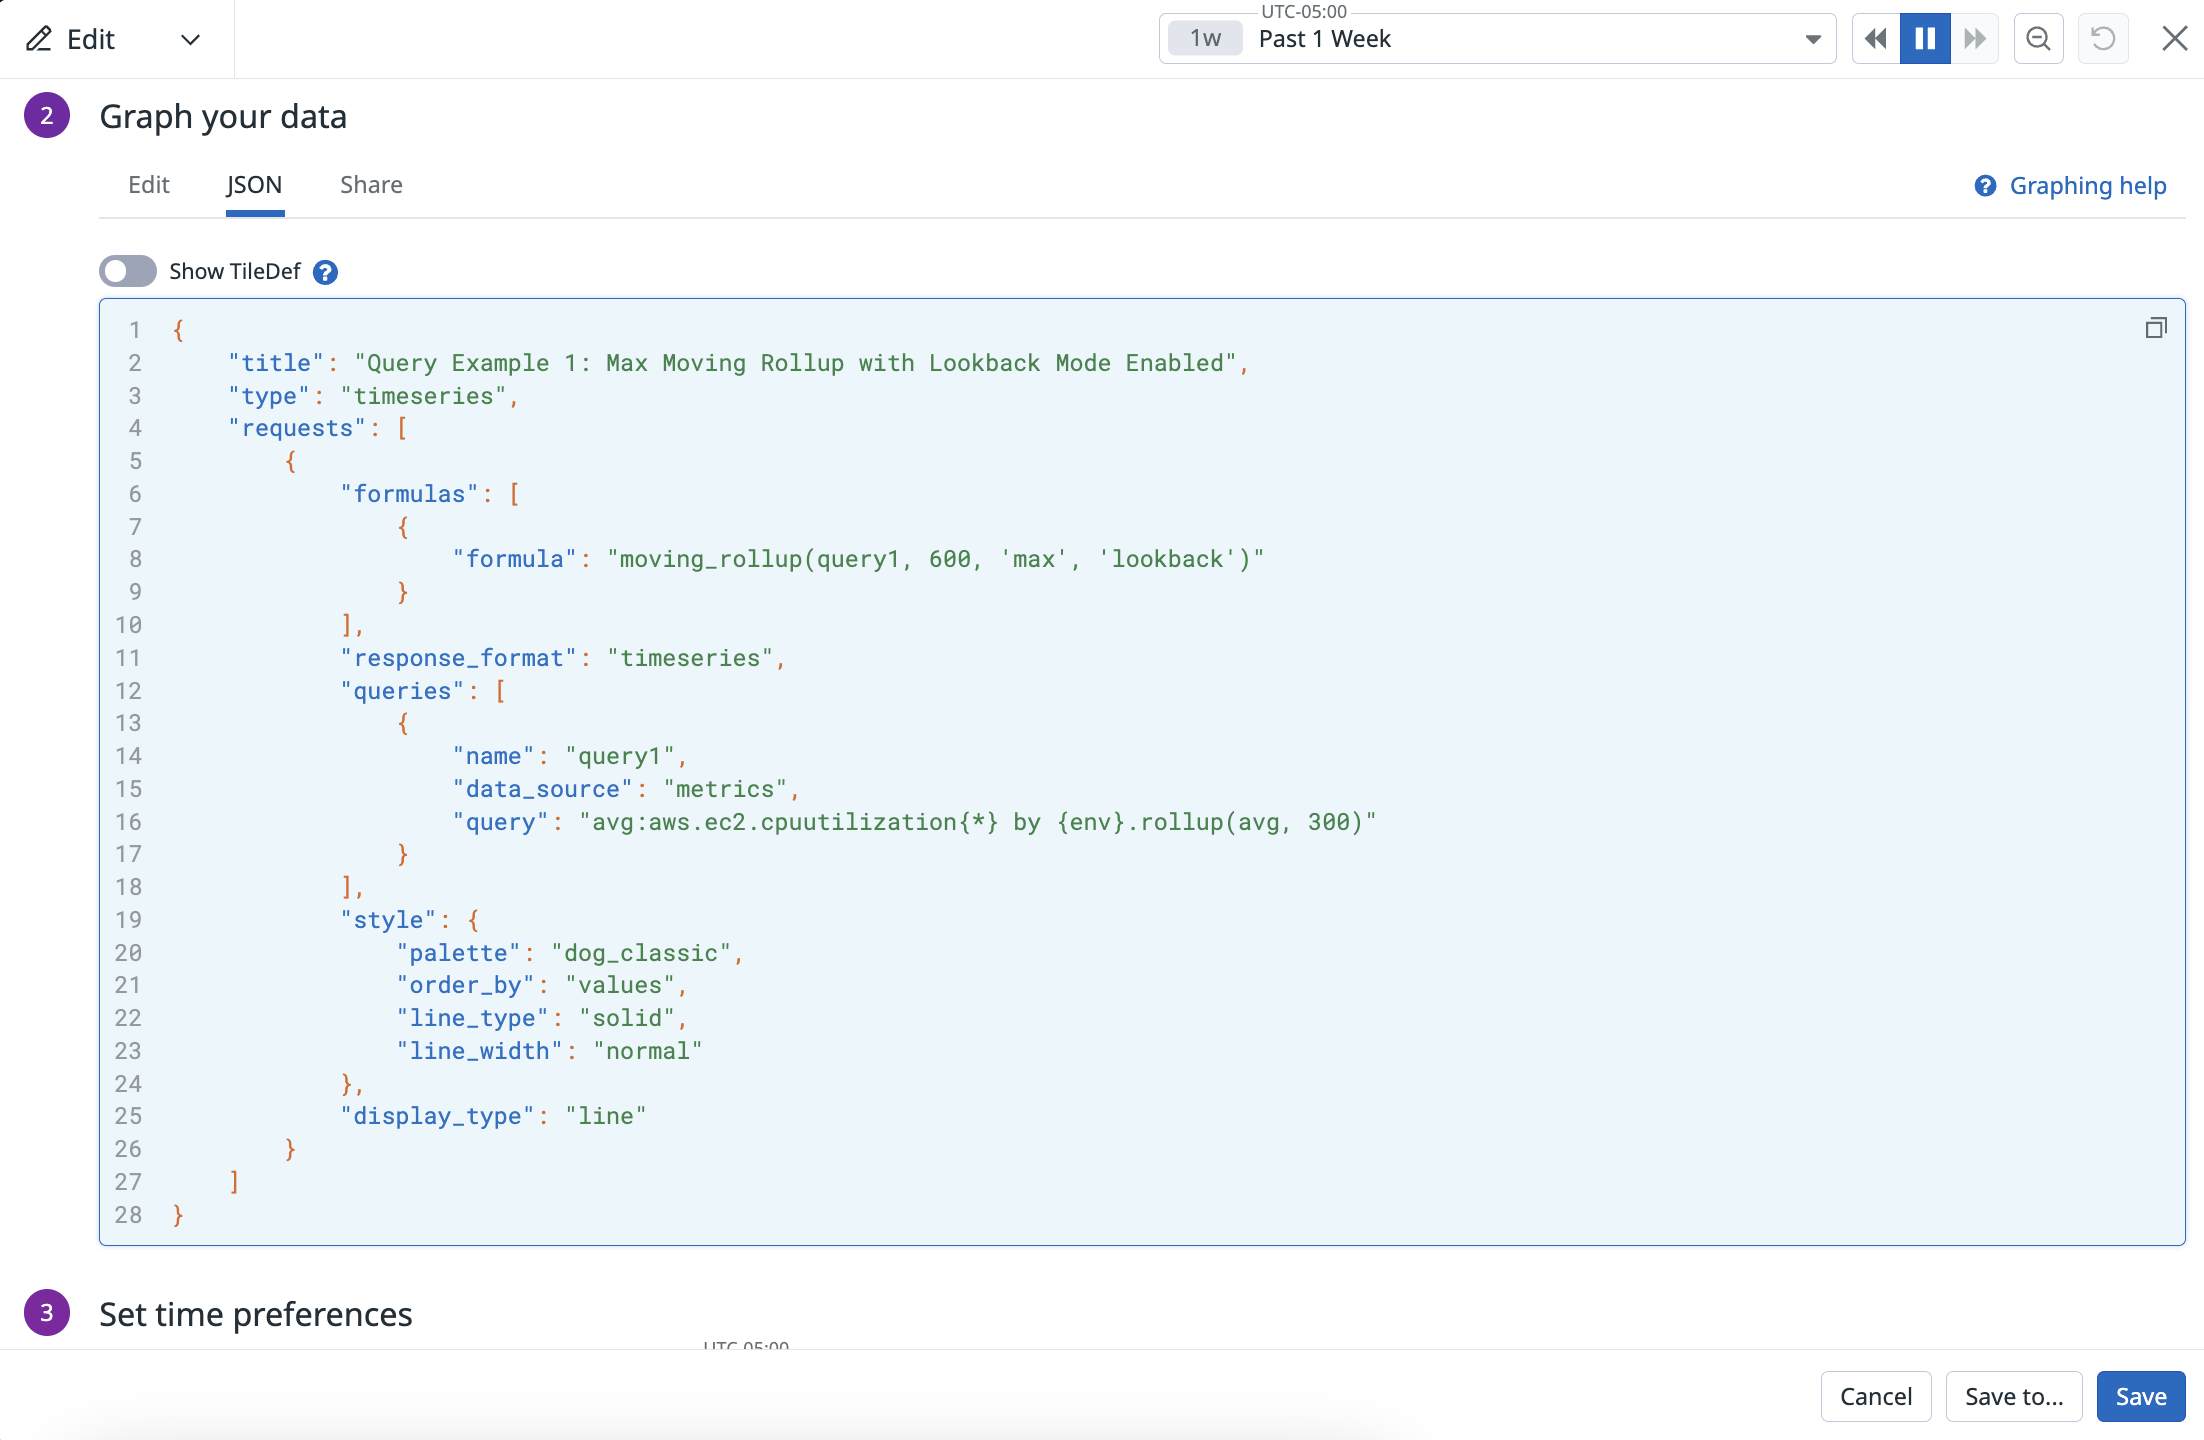
Max Moving rollup with Lookback Mode Enabled
Max Moving rollup with Lookback Mode Enabled
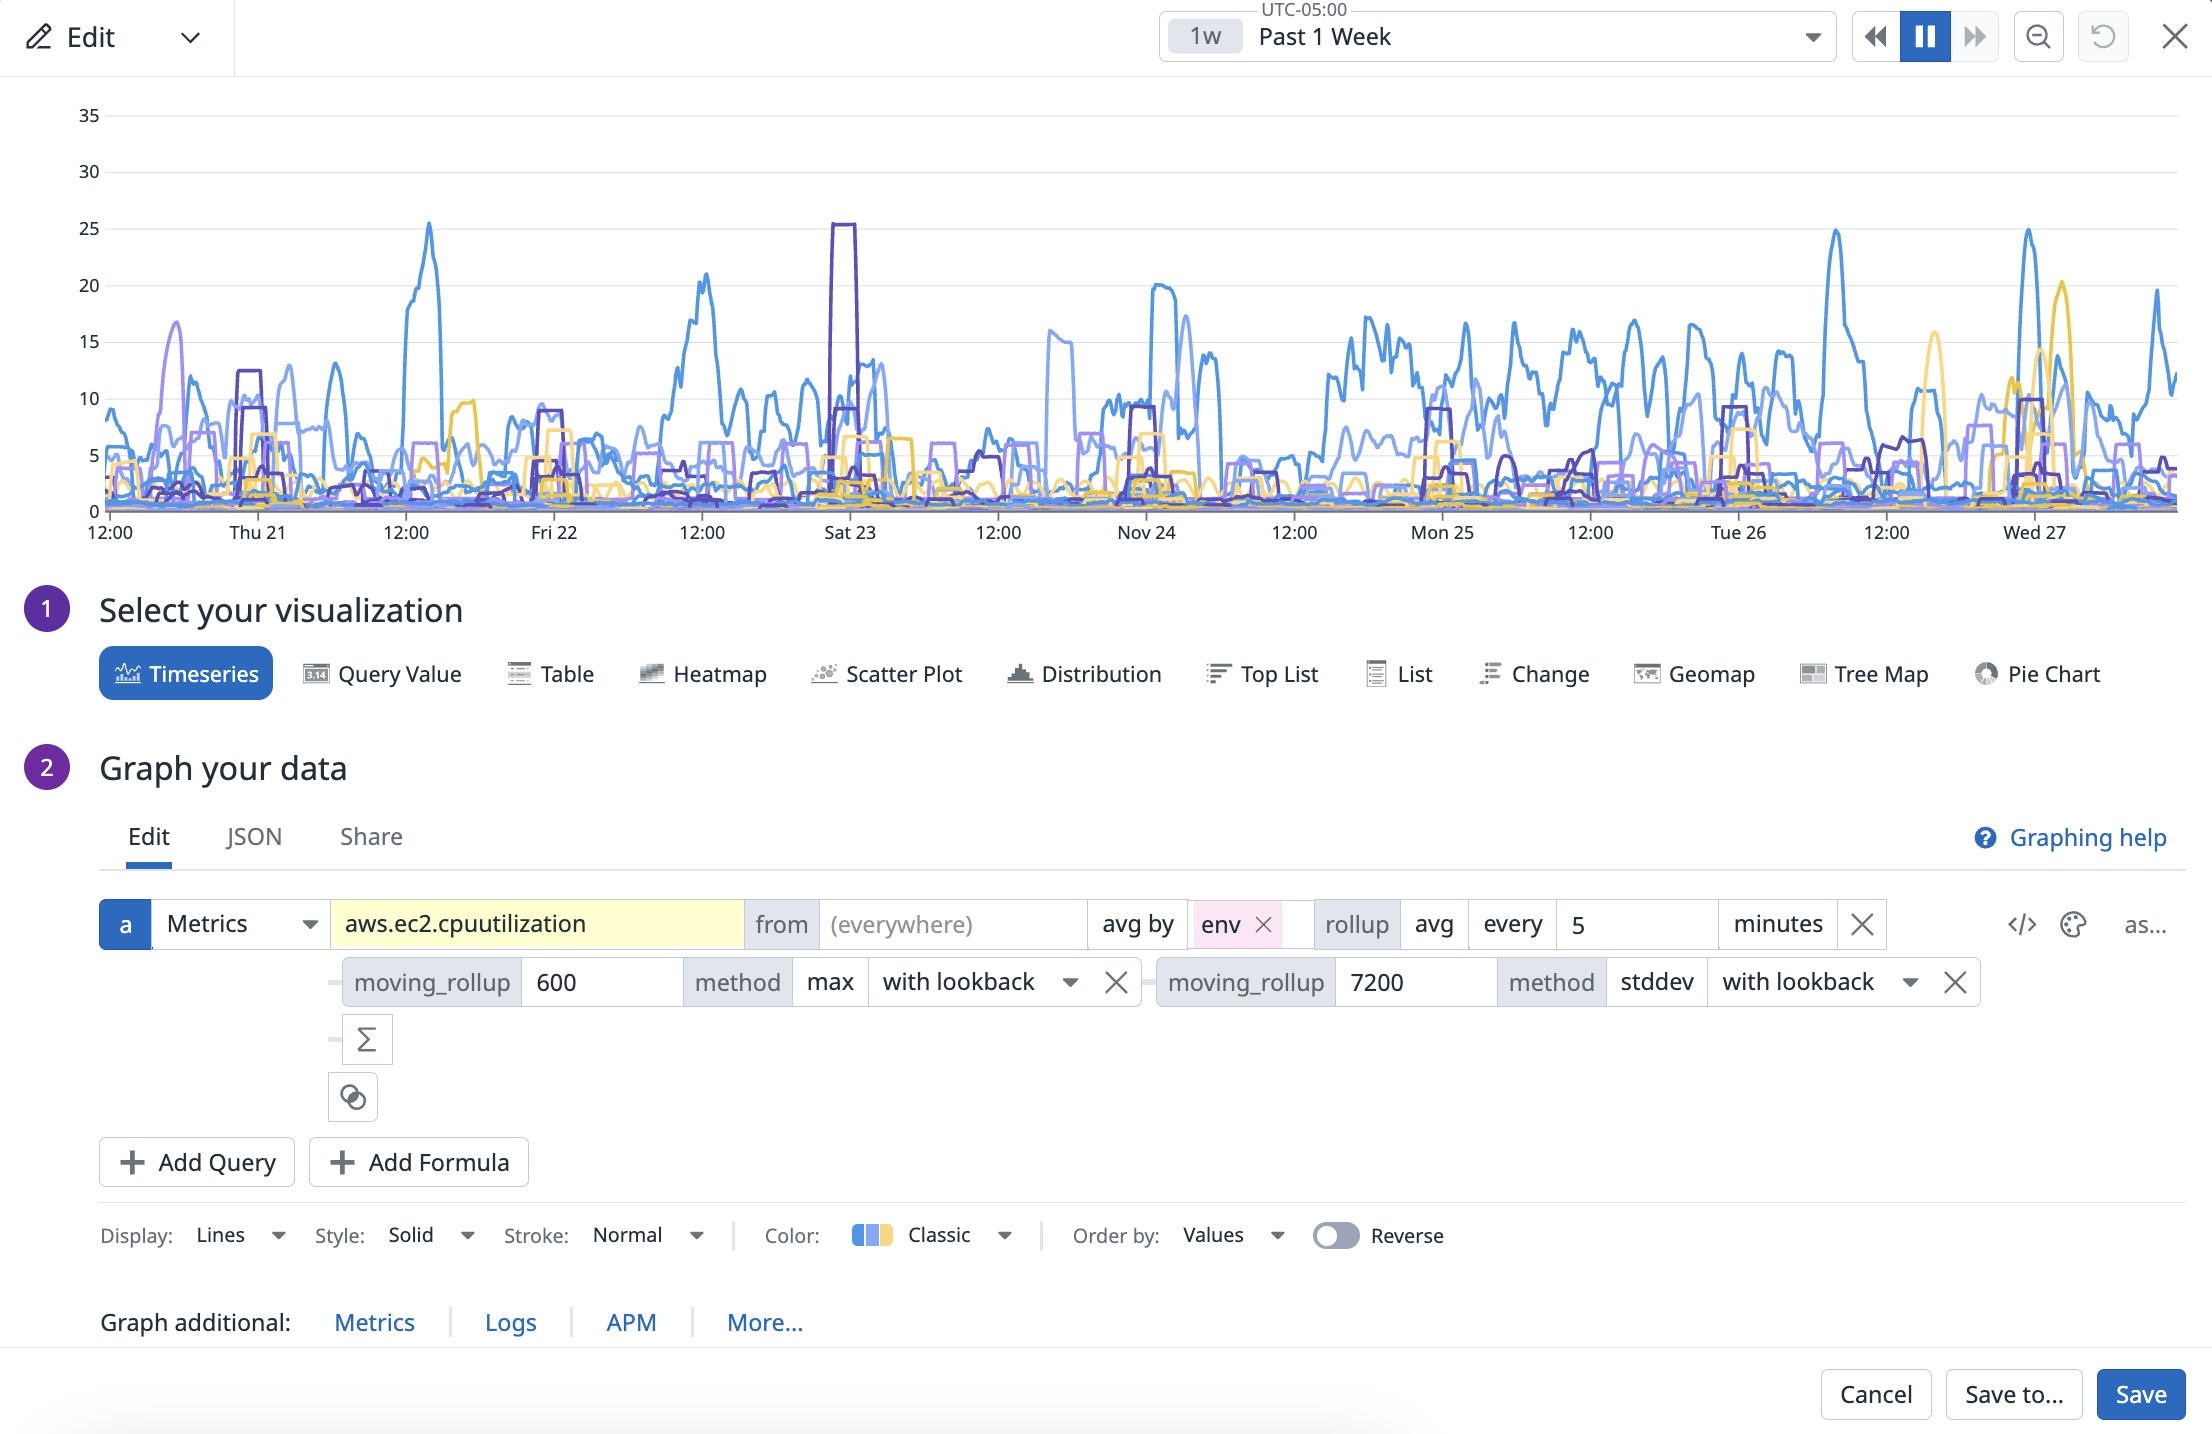
When nesting these moving_rollups, the rollup intervals provided must get larger as shown in the UI or JSON tab:
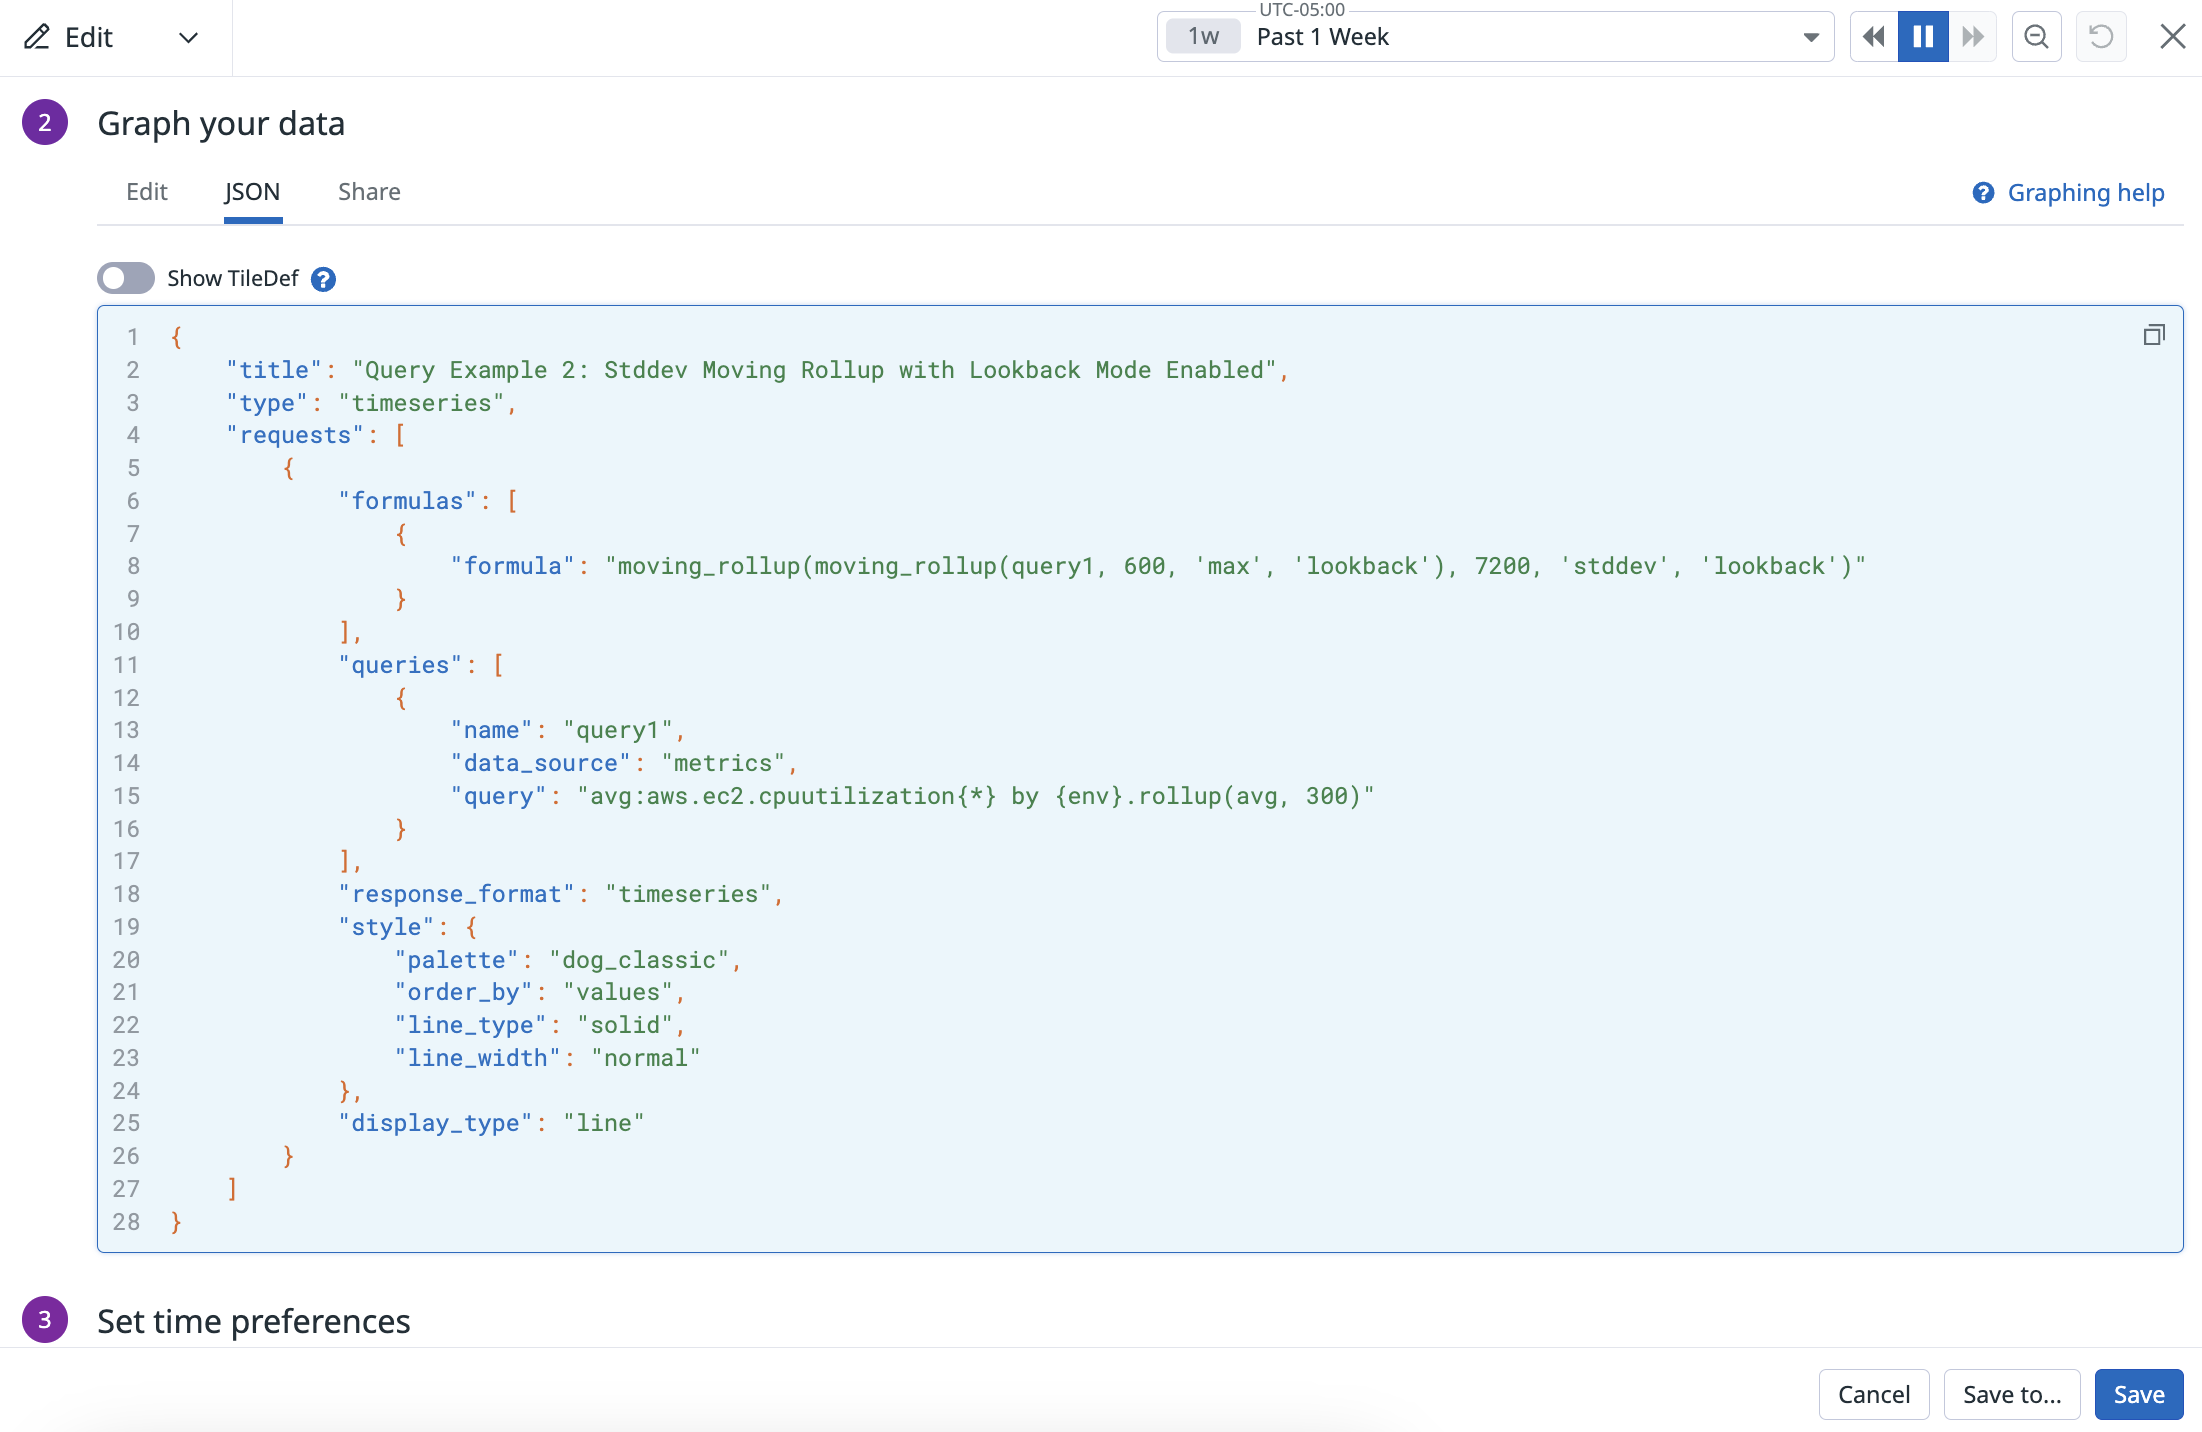
Standard Deviation Moving Rollup with Lookback Mode Enabled
Standard Deviation Moving Rollup with Lookback Mode Enabled
You can also use percentiles and standard deviation with the new moving rollup function, which supports lookback, and allows nesting of moving rollups with lookback enabled.
In the UI or JSON tab, it would look as follows:
Boolean threshold remapping functions
Remap functions allow you to refine and transform query results based on specific conditions, extending functionality for monitoring and analysis. Nested queries unlocks the following three new functions:
is_greater(<QUERY>, <THRESHOLD>)is_less(<QUERY>, <THRESHOLD>)is_between(<QUERY>, <LOWER THRESHOLD>, <UPPER THRESHOLD>)
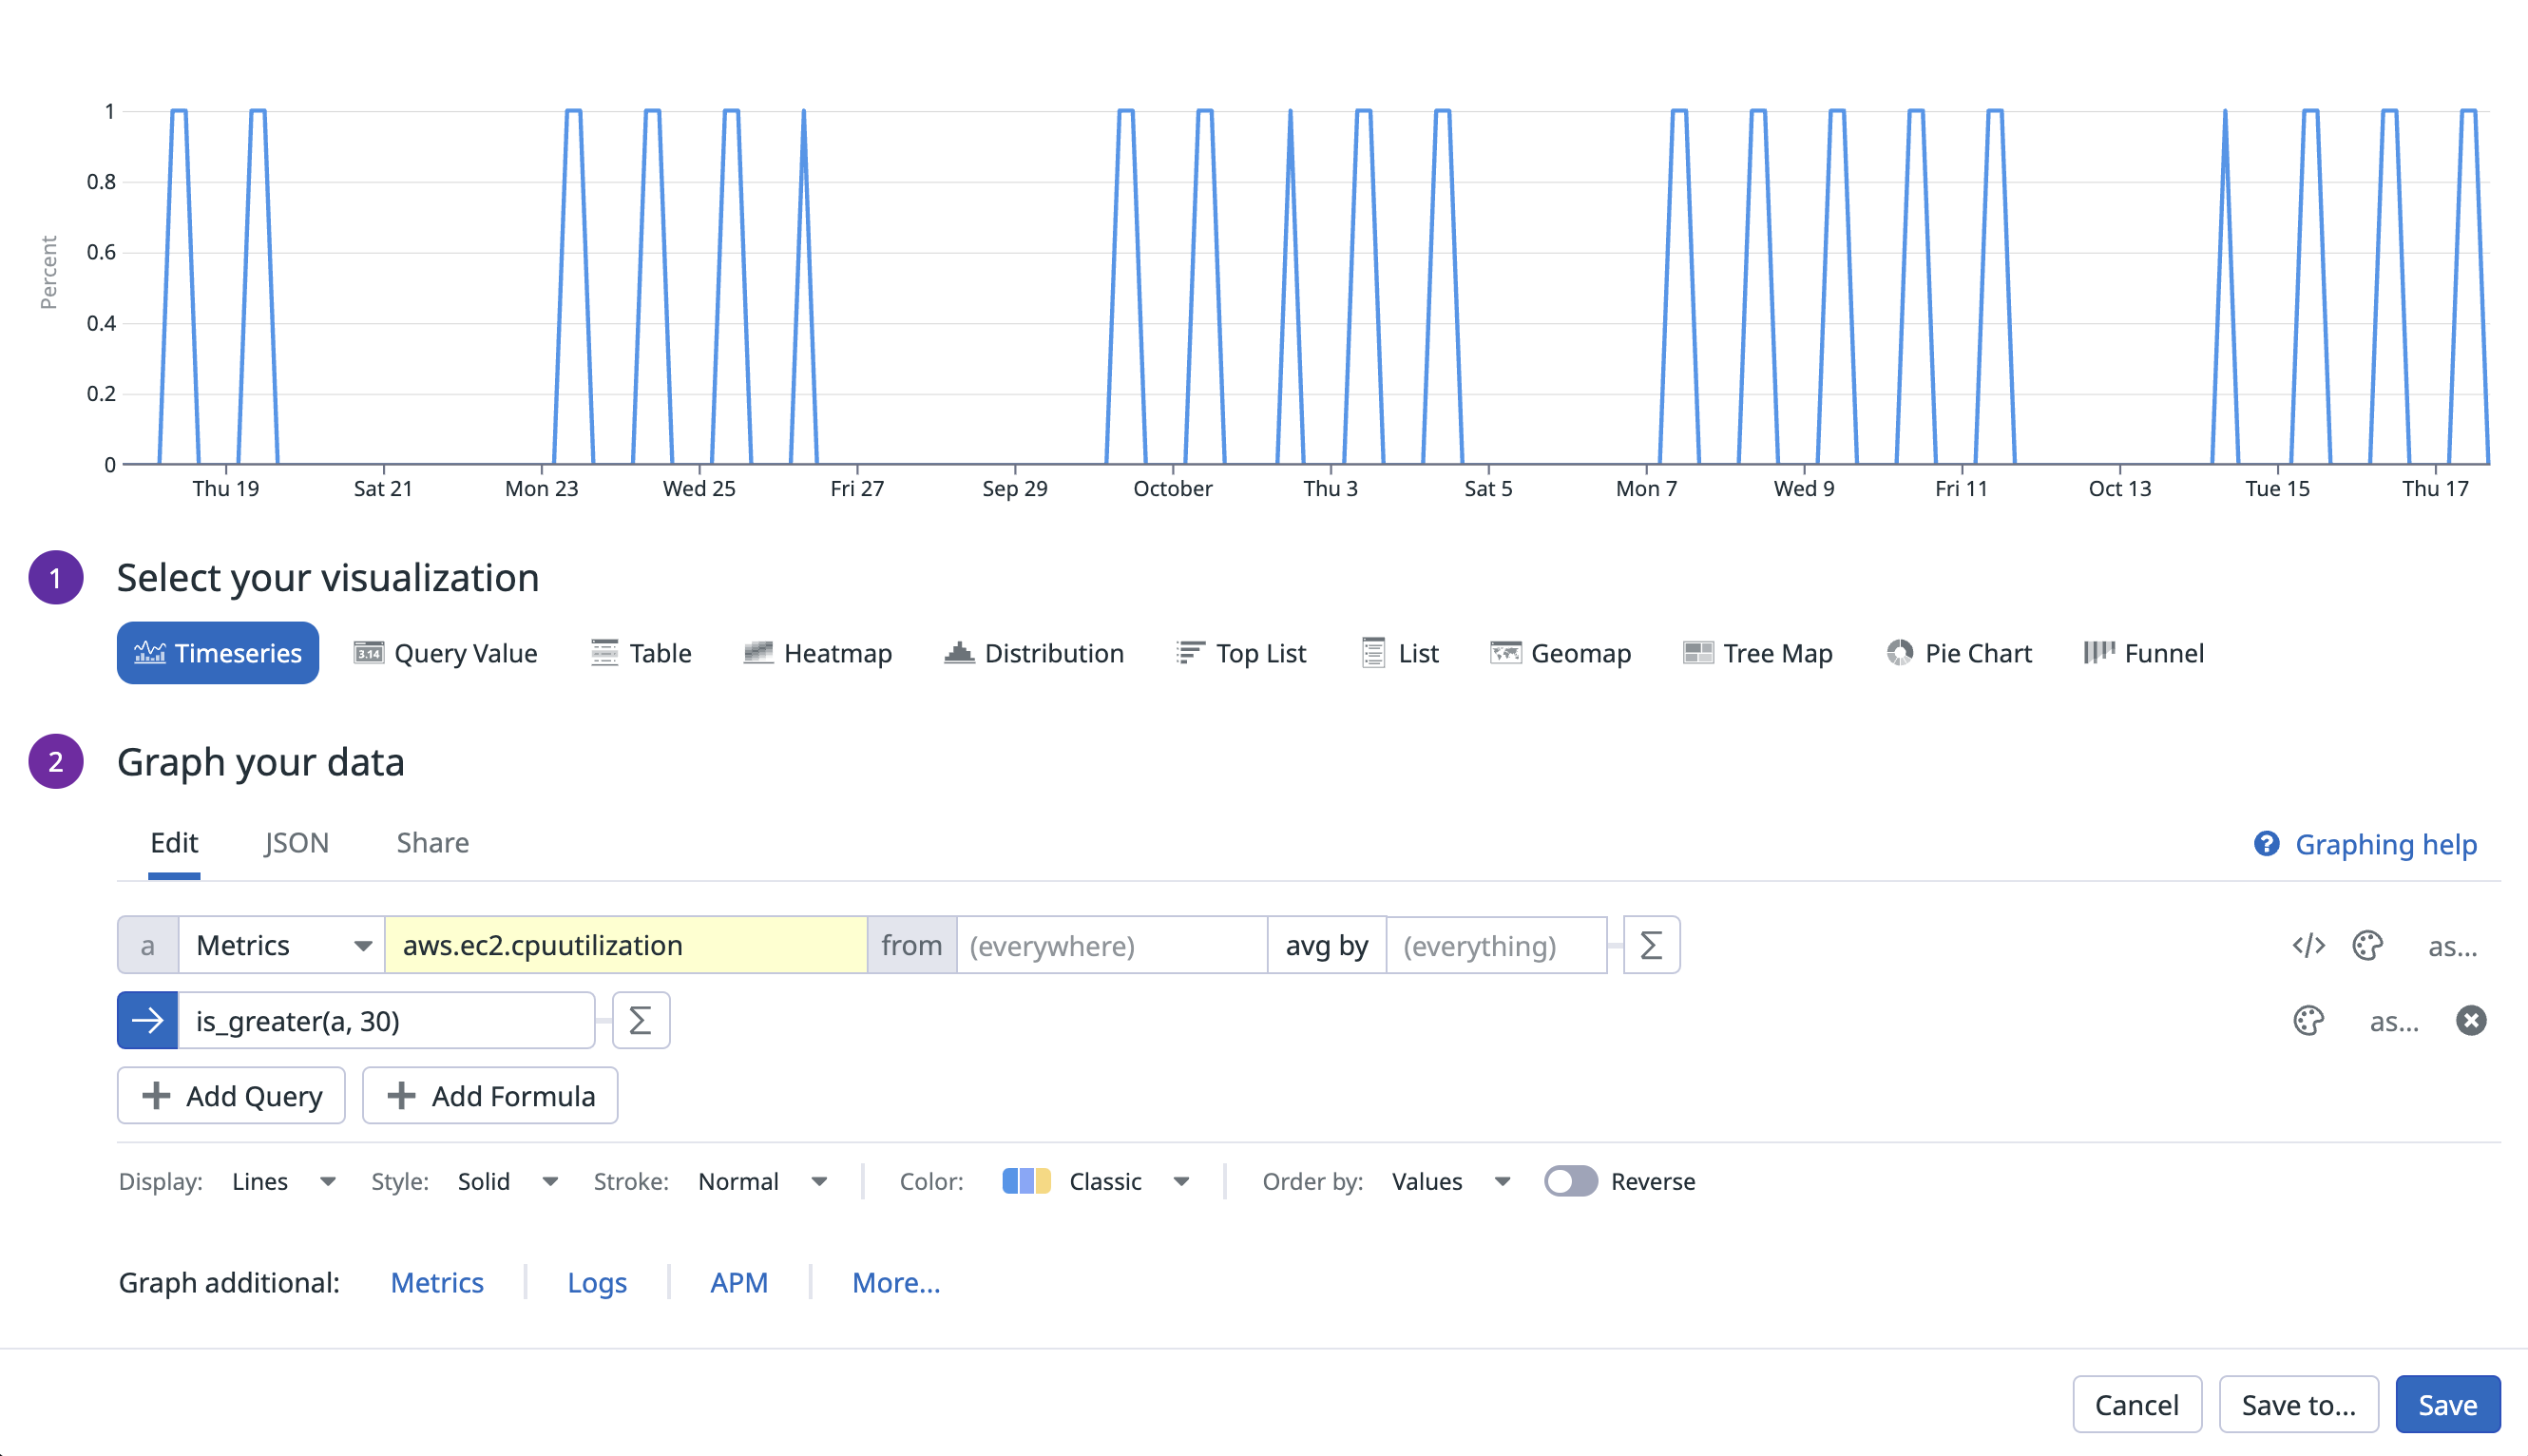
is_greater() example query
is_greater() example query
is_greater() returns 1.0 for each point where the query is greater than a constant of 30 and 0.0 elsewhere.
In the UI or JSON tab, it would look as follows:
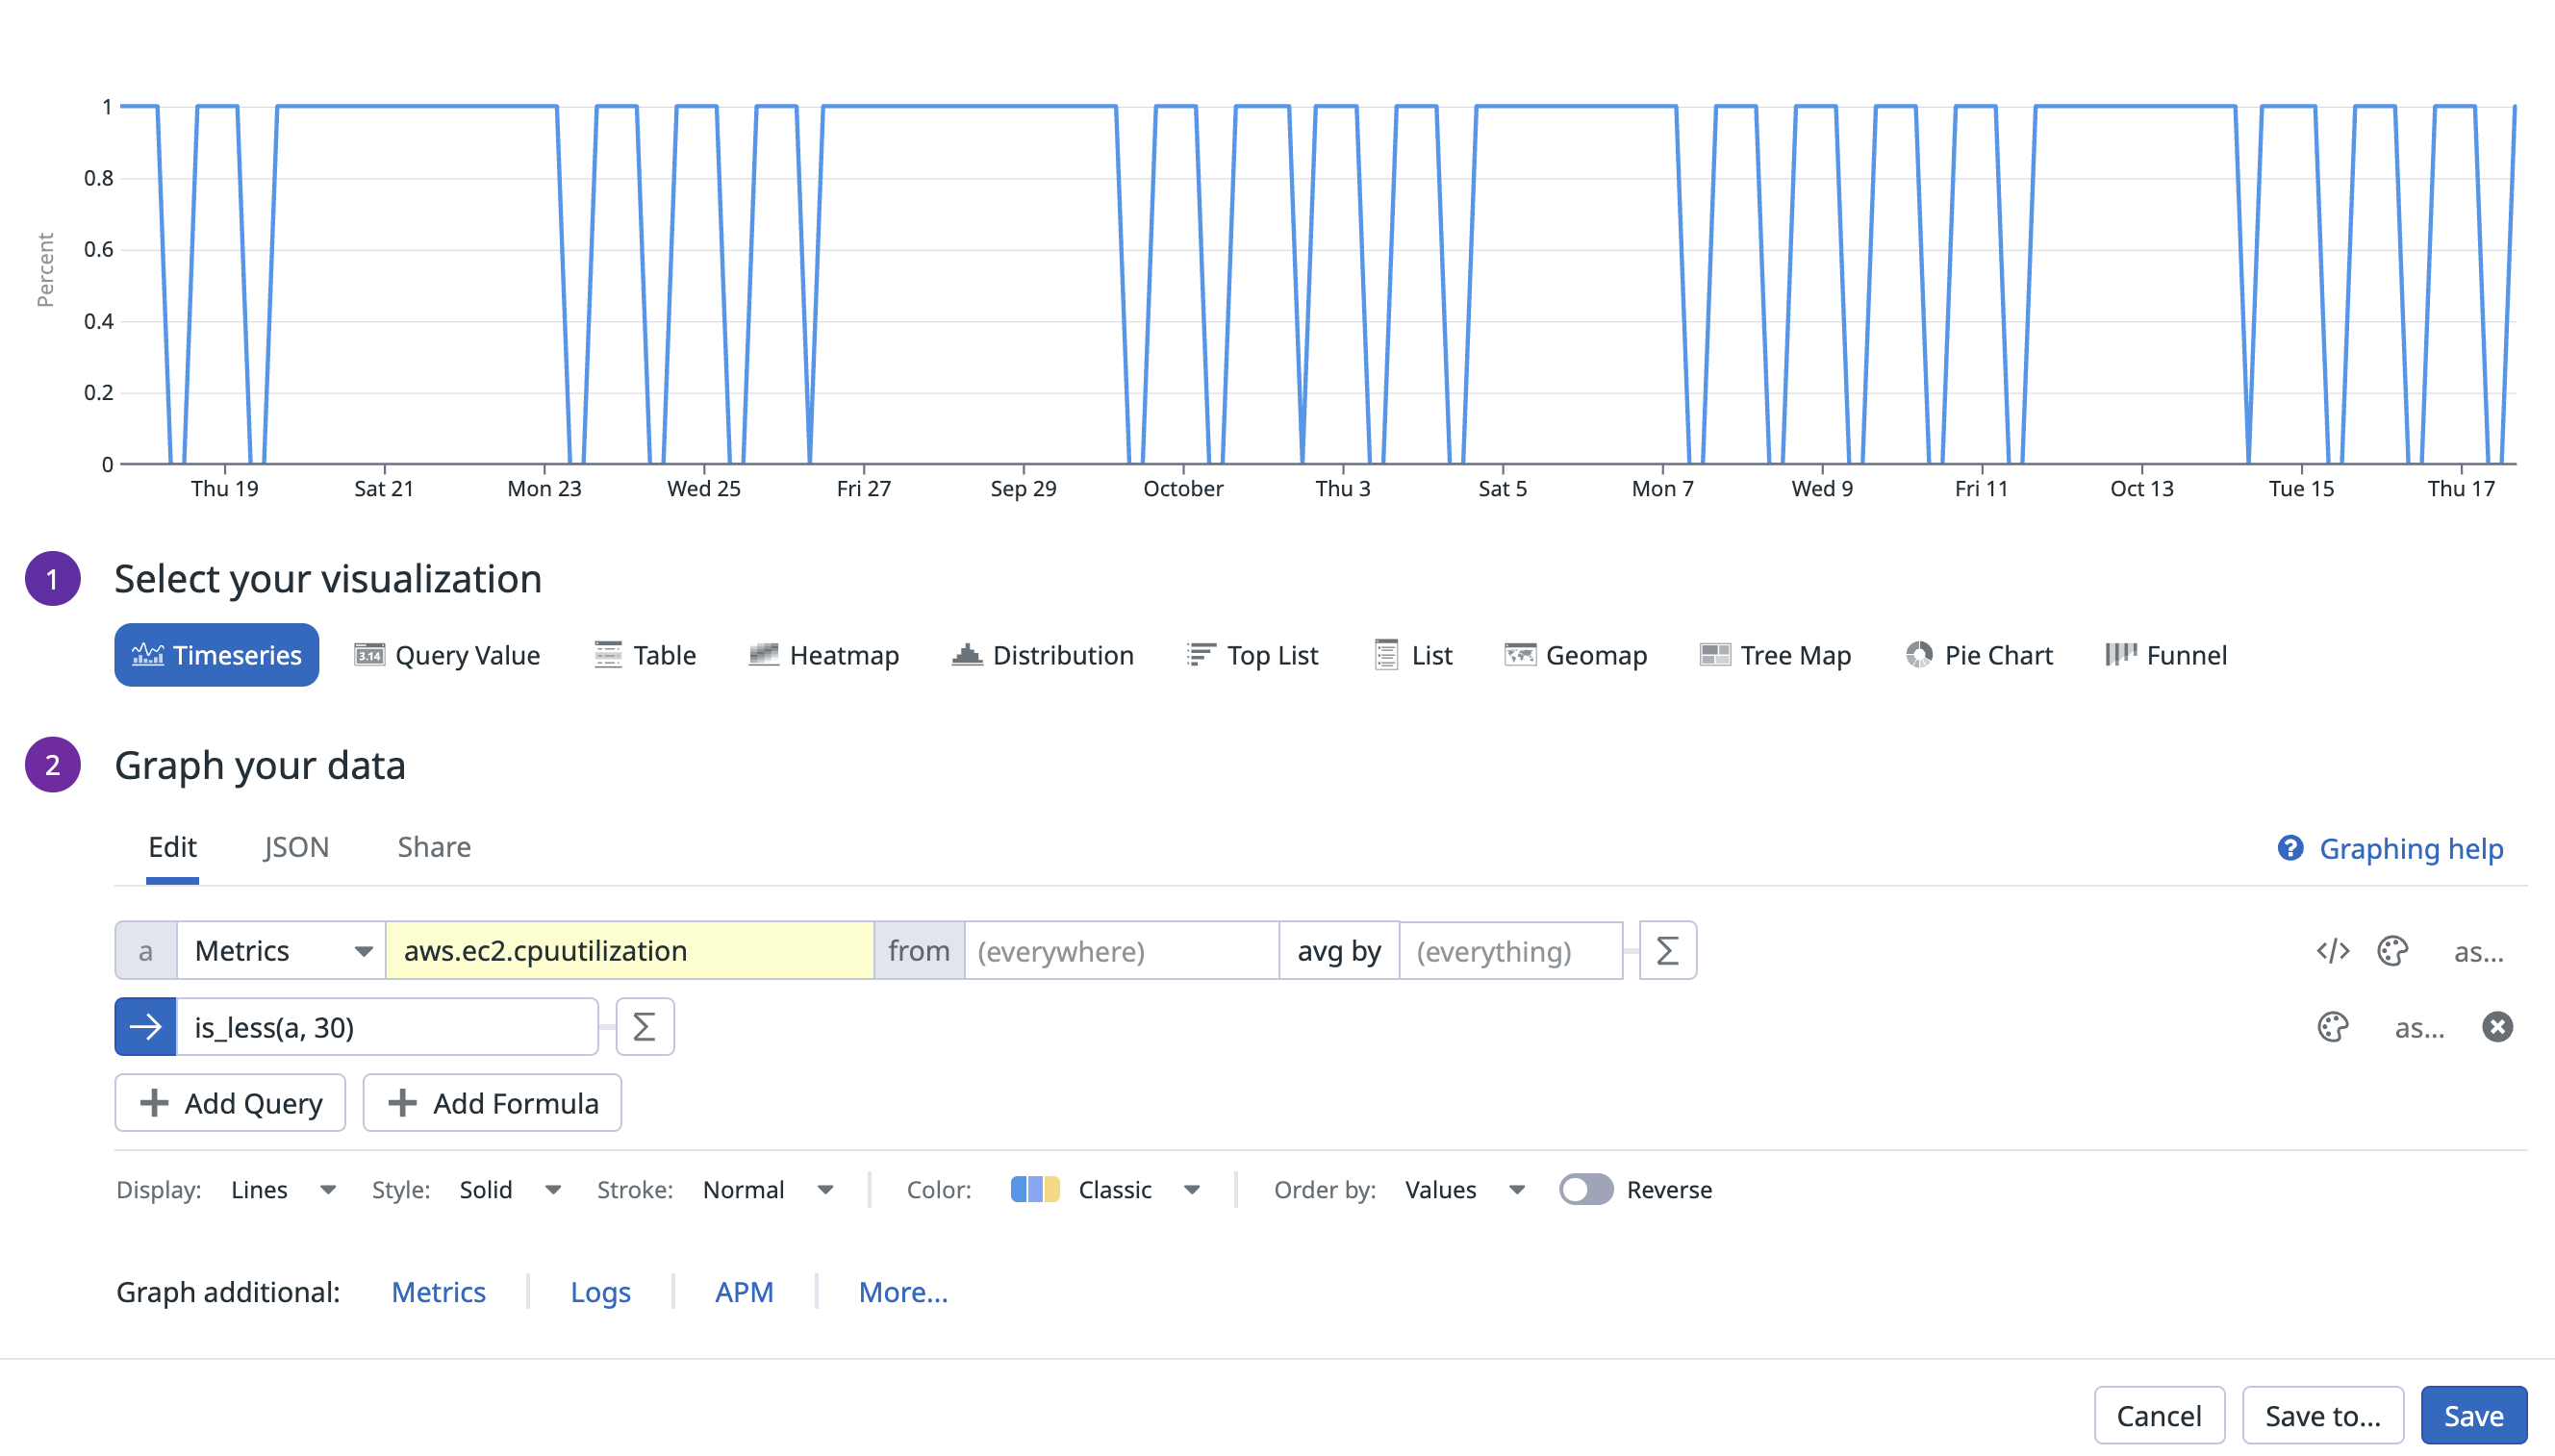
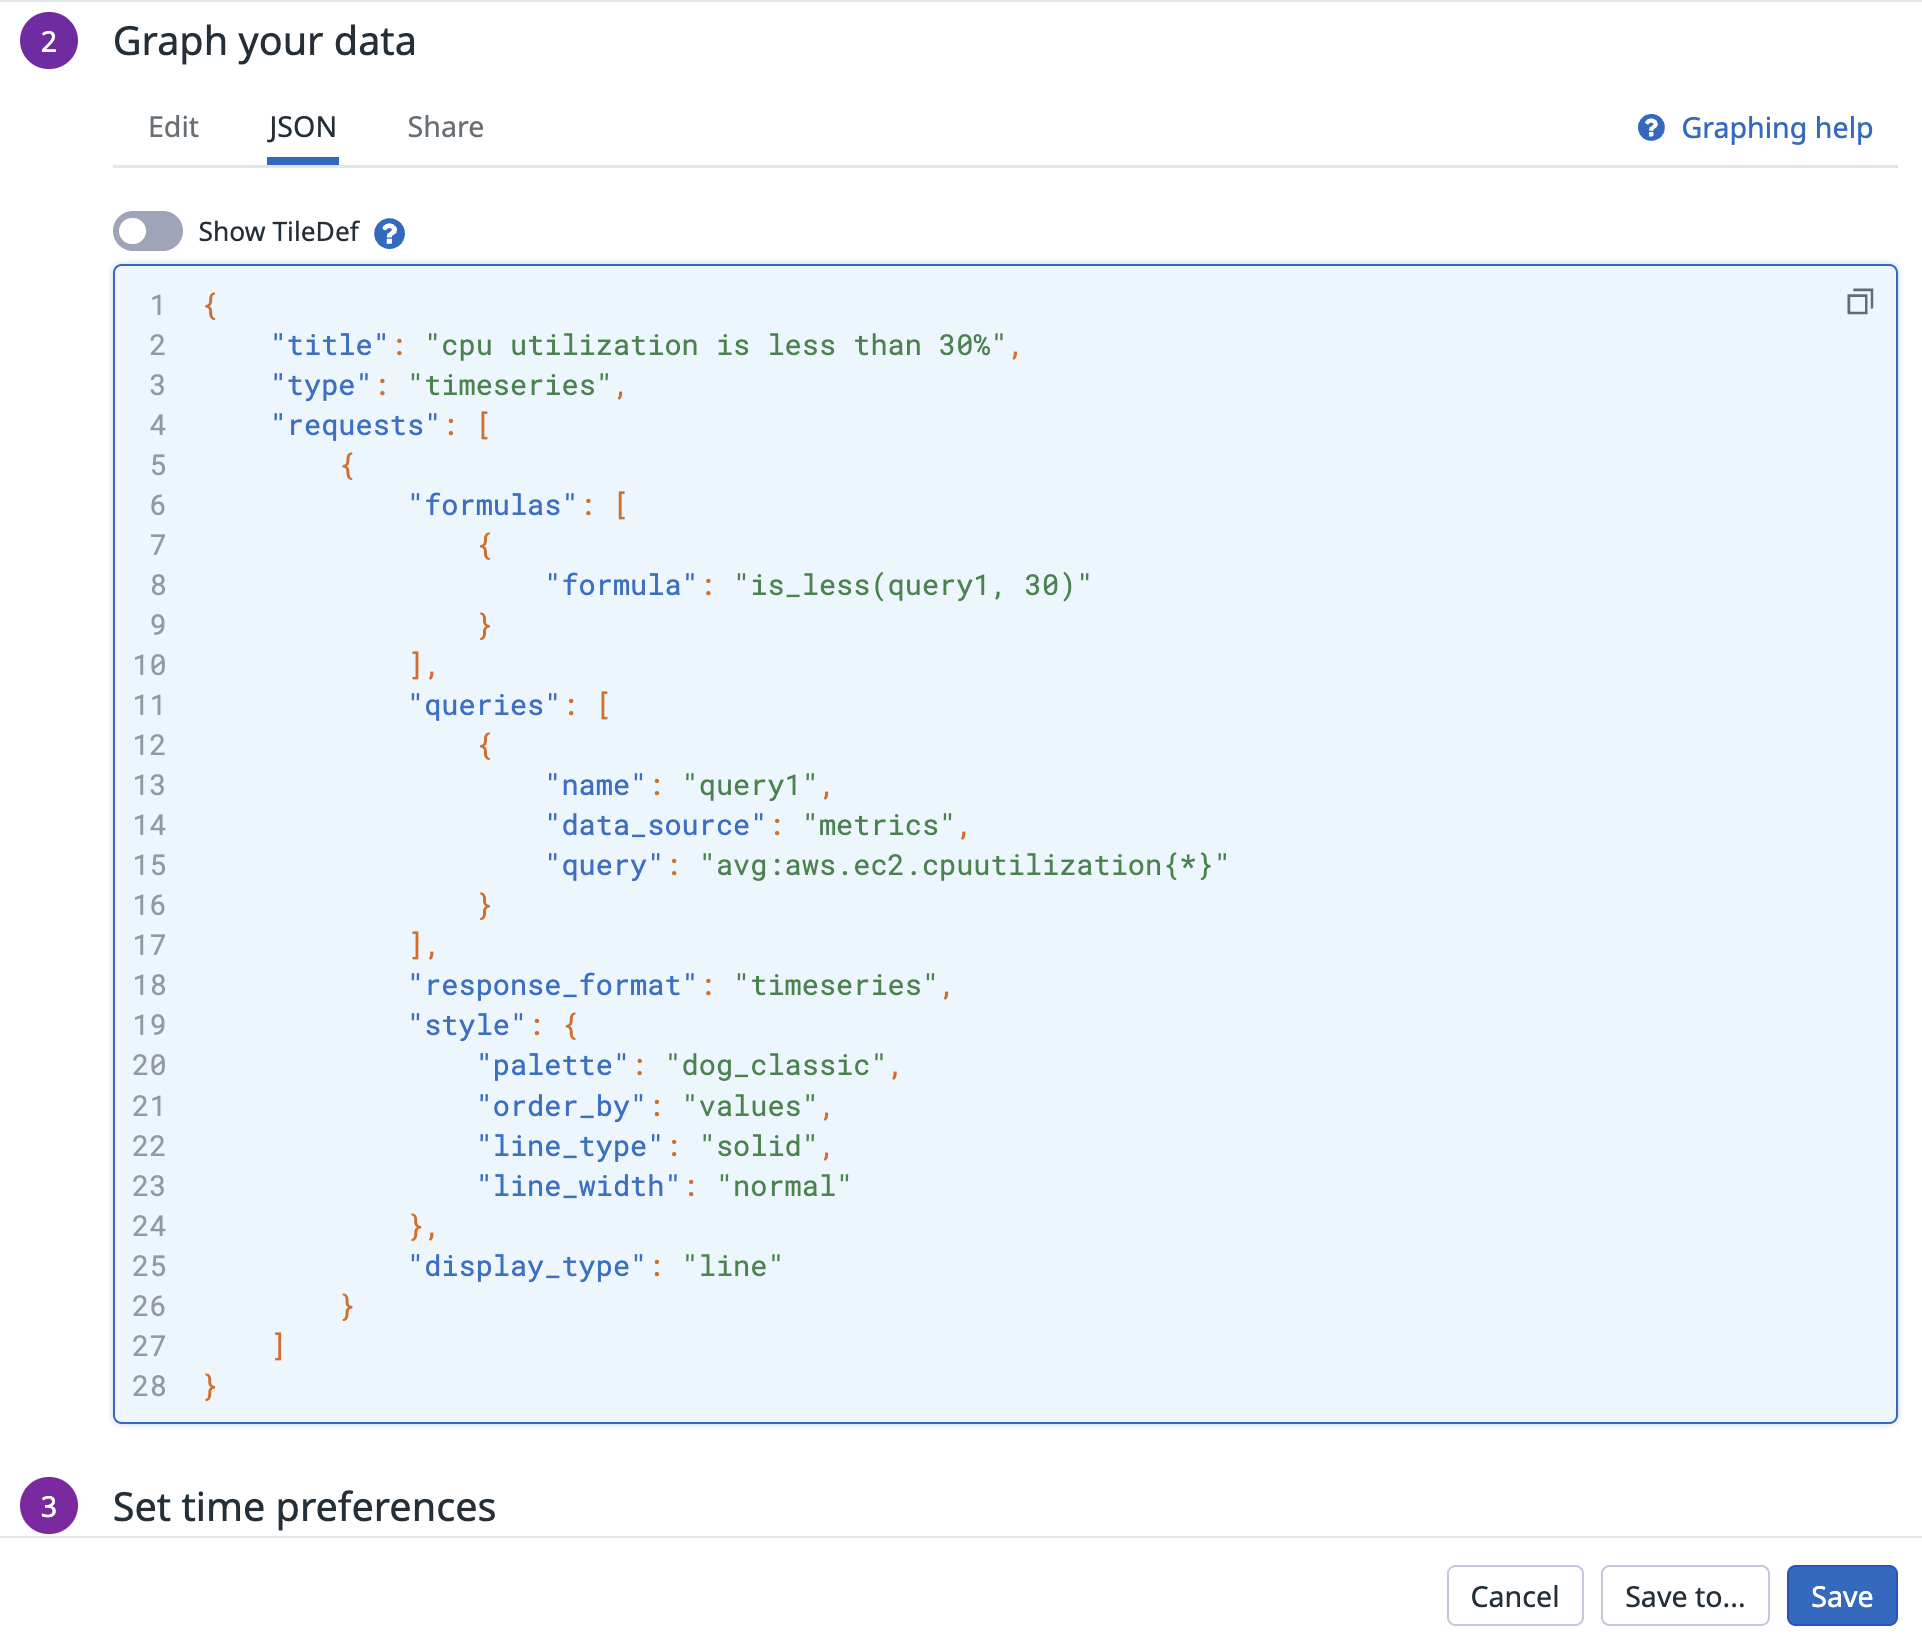
is_less() example query
is_less() example query
is_less() returns 1.0 for each point where the query is less than a constant of 30 and 0.0 elsewhere.
In the UI or JSON tab, it would look as follows:
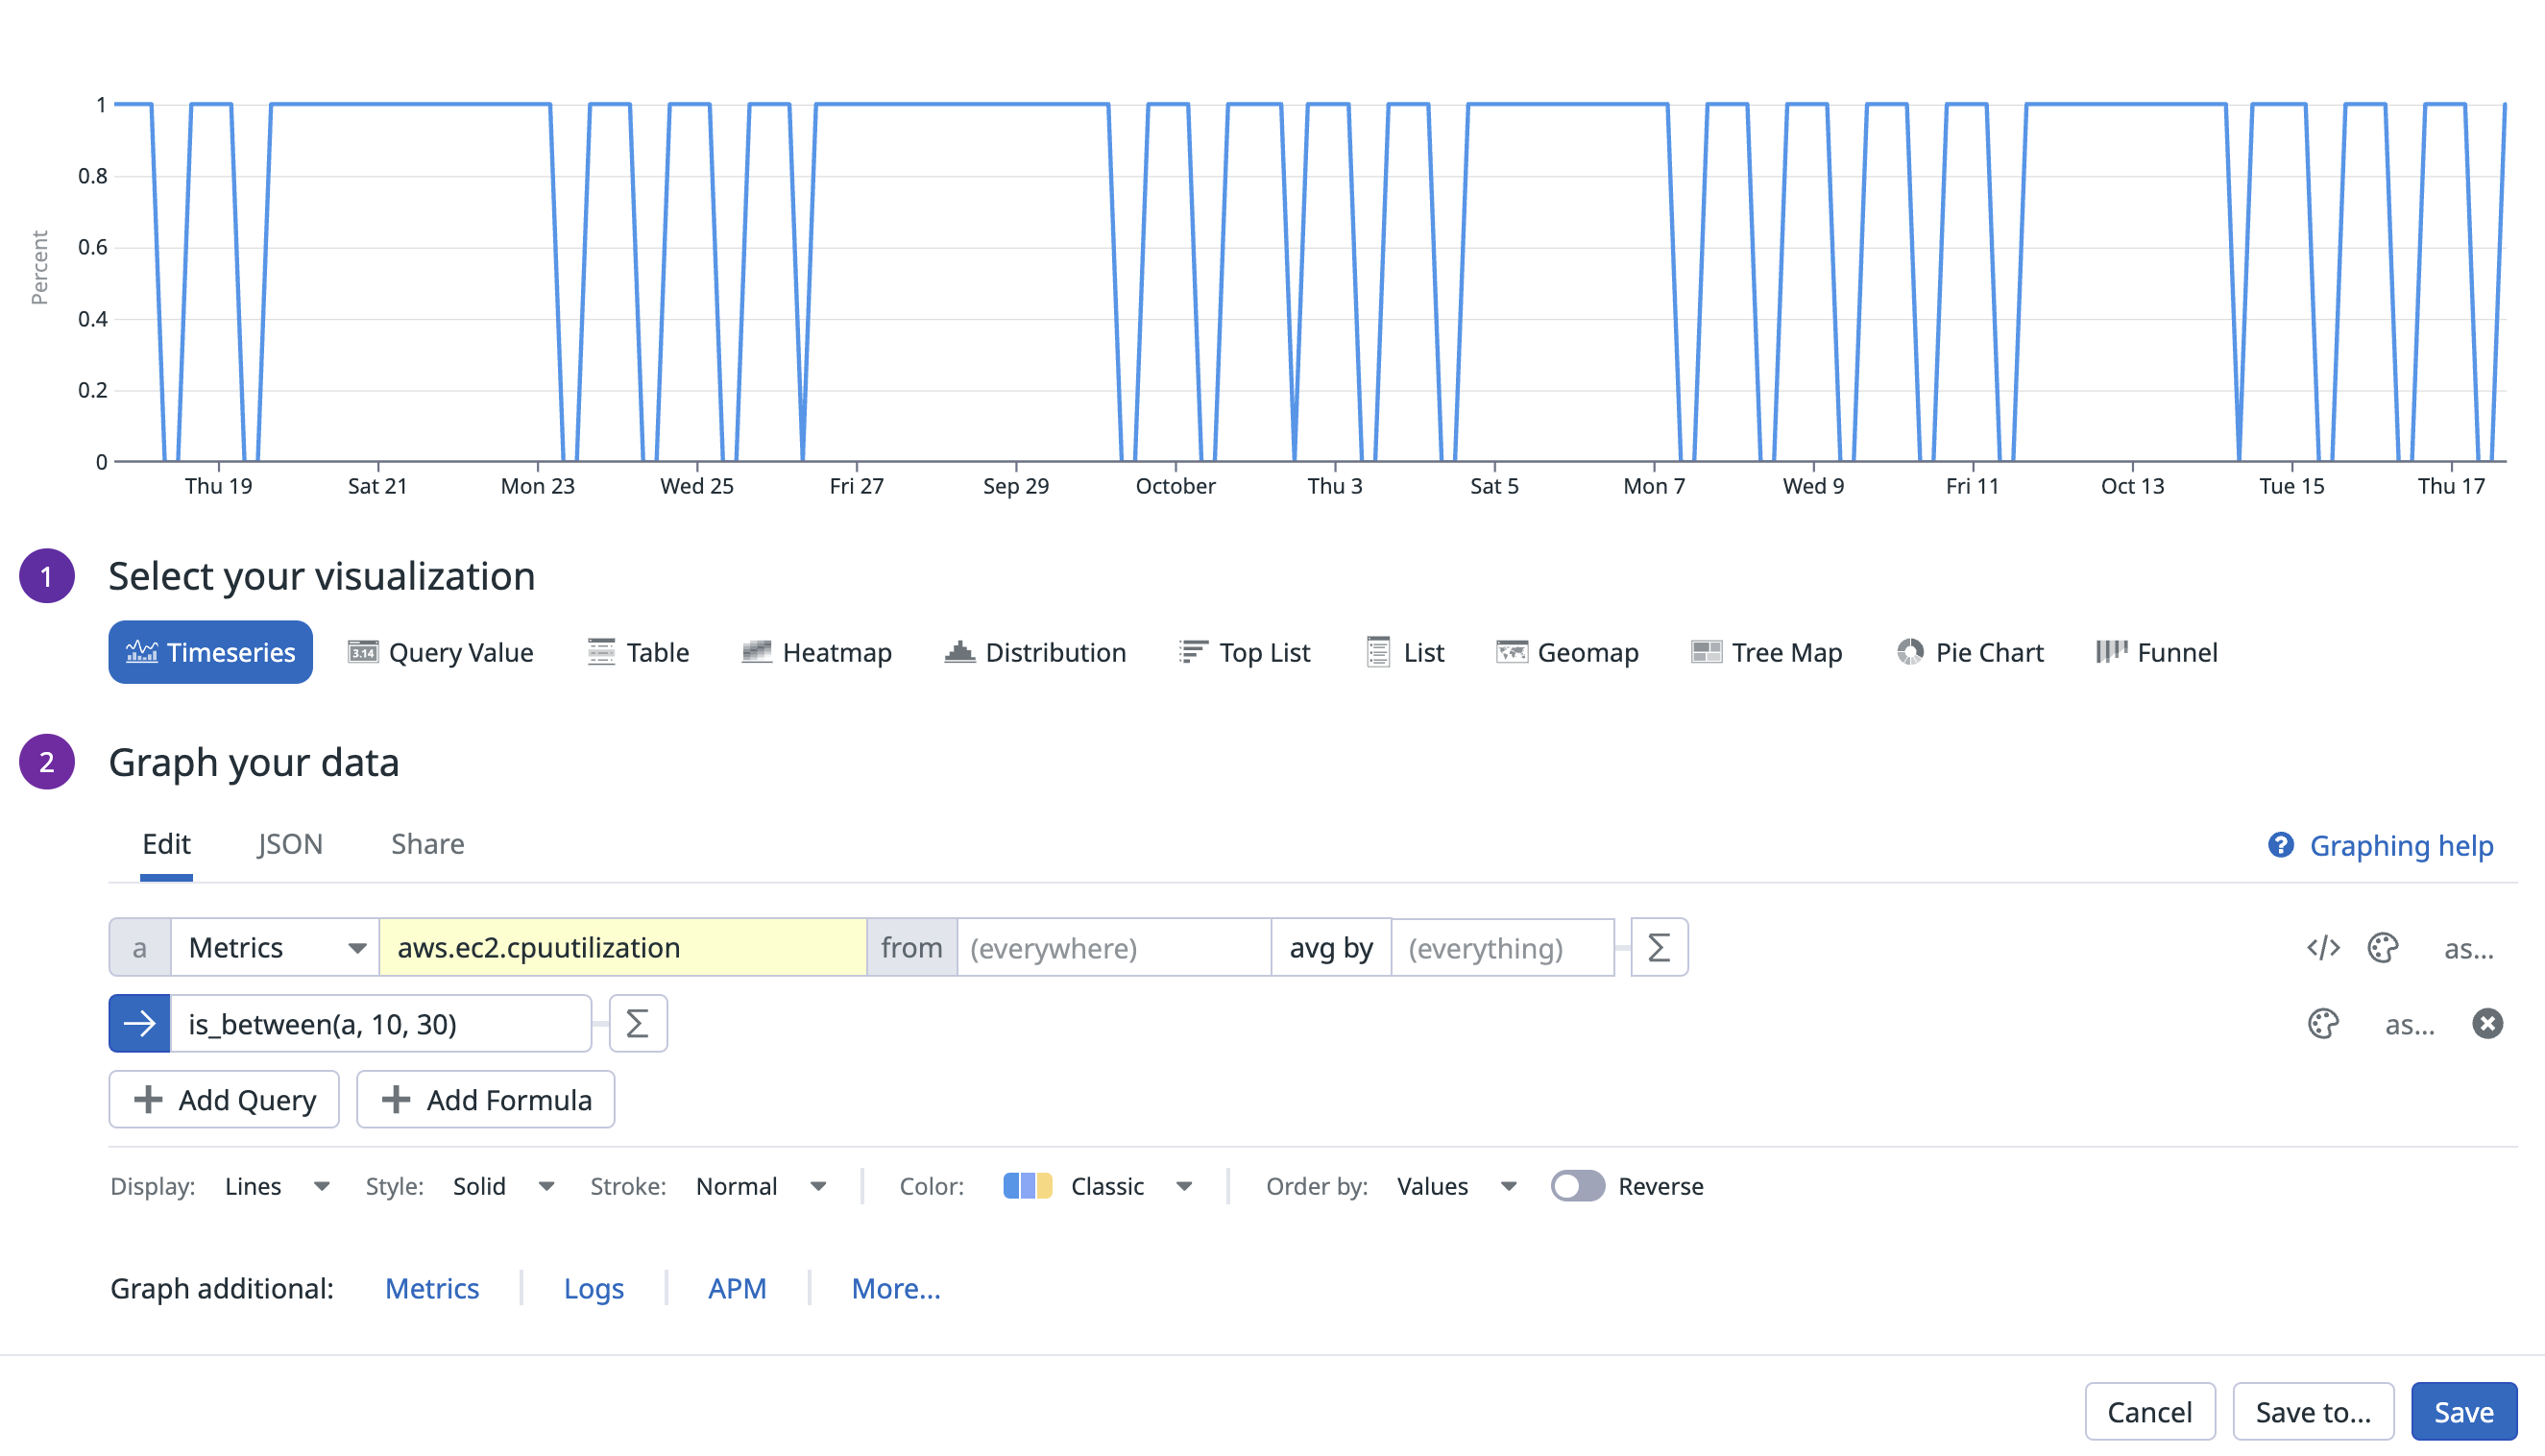
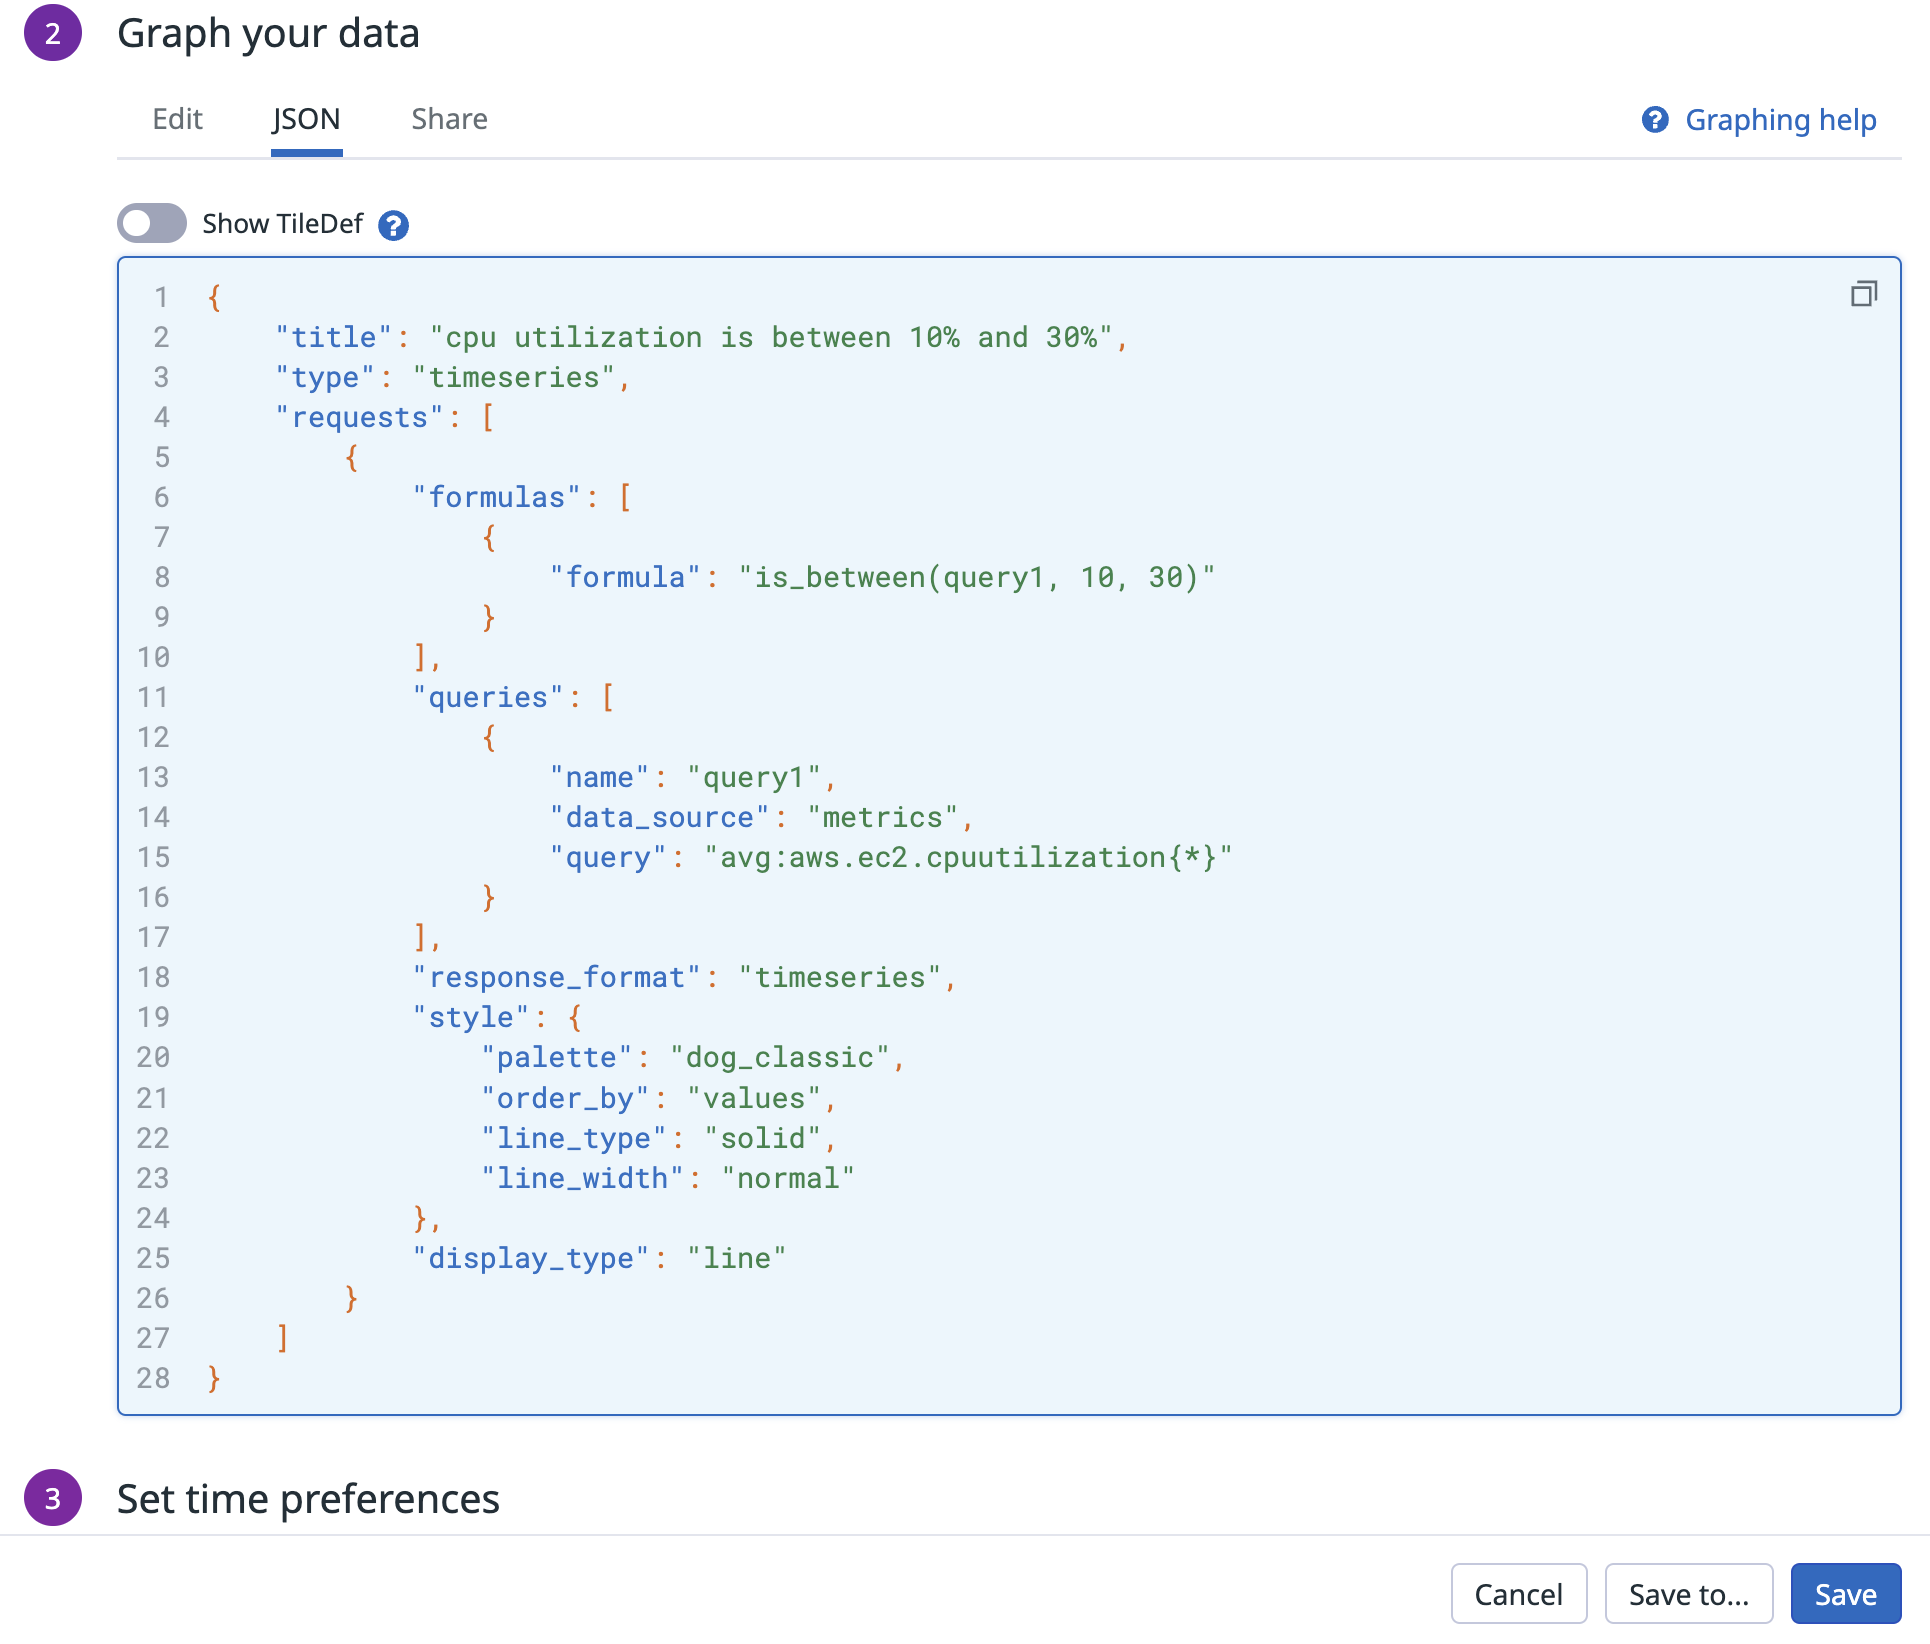
is_between() example query
is_between() example query
is_between() returns 1.0 for each point where the query is between 10 and 30 (exclusive), and 0.0 elsewhere.
In the UI or JSON tab, it would look as follows:
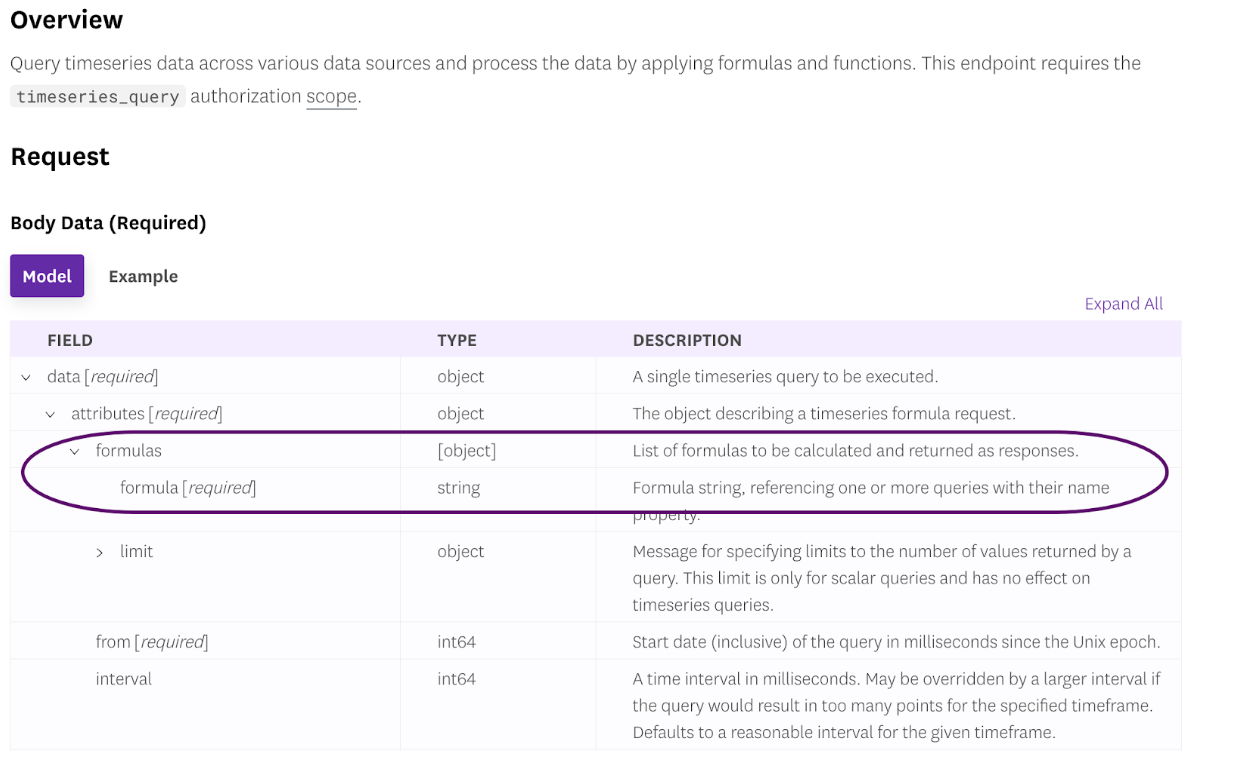
Use nested queries with Datadog’s API
You can use nested queries functionality in our public API for querying timeseries data. Change the contents of the formula object
Further reading
Additional helpful documentation, links, and articles:
