- Agents
- Essentials
- Getting Started
- Agent
- API
- APM Tracing
- Containers
- Dashboards
- Database Monitoring
- Datadog
- Datadog Site
- DevSecOps
- Incident Management
- Integrations
- Internal Developer Portal
- Logs
- Monitors
- Notebooks
- OpenTelemetry
- Profiler
- Search
- Session Replay
- Security
- Serverless for AWS Lambda
- Software Delivery
- Synthetic Monitoring and Testing
- Tags
- Workflow Automation
- Learning Center
- Support
- Glossary
- Standard Attributes
- Guides
- Agent
- Integrations
- Extend Datadog
- Authorization
- DogStatsD
- Custom Checks
- Integrations
- Build an Integration with Datadog
- Create an Agent-based Integration
- Create an API-based Integration
- Create a Log Pipeline
- Integration Assets Reference
- Build a Marketplace Offering
- Create an Integration Dashboard
- Create a Monitor Template
- Create a Cloud SIEM Detection Rule
- Install Agent Integration Developer Tool
- Service Checks
- Community
- Guides
- OpenTelemetry
- Administrator's Guide
- API
- Partners
- Datadog Mobile App
- DDSQL Reference
- CoScreen
- CoTerm
- Remote Configuration
- Cloudcraft (Standalone)
- In The App
- Dashboards
- Notebooks
- DDSQL Editor
- Reference Tables
- Sheets
- Monitors and Alerting
- Service Level Objectives
- Metrics
- Watchdog
- Bits AI
- Internal Developer Portal
- Error Tracking
- Change Tracking
- Event Management
- Incident Response
- Actions & Remediations
- Infrastructure
- Cloudcraft
- Resource Catalog
- Universal Service Monitoring
- End User Device Monitoring
- Hosts
- Containers
- Processes
- Serverless
- Network Monitoring
- Storage Management
- Cloud Cost
- Application Performance
- APM
- Continuous Profiler
- Database Monitoring
- Agent Integration Overhead
- Setup Architectures
- Setting Up Postgres
- Setting Up MySQL
- Setting Up SQL Server
- Setting Up Oracle
- Setting Up Amazon DocumentDB
- Setting Up MongoDB
- Setting Up ClickHouse
- Connecting DBM and Traces
- Data Collected
- Exploring Database Hosts
- Exploring Query Metrics
- Exploring Query Samples
- Exploring Database Schemas
- Exploring Recommendations
- Troubleshooting
- Guides
- Data Streams Monitoring
- Data Observability
- Digital Experience
- Real User Monitoring
- Synthetic Testing and Monitoring
- Continuous Testing
- Experiments
- Product Analytics
- Session Replay
- Software Delivery
- CI Visibility
- CD Visibility
- Deployment Gates
- Test Optimization
- Code Coverage
- PR Gates
- DORA Metrics
- Feature Flags
- Developer Integrations
- Security
- Security Overview
- Cloud SIEM
- Code Security
- Cloud Security
- App and API Protection
- AI Guard
- Workload Protection
- Sensitive Data Scanner
- AI Observability
- Log Management
- Observability Pipelines
- Configuration
- Sources
- Processors
- Destinations
- Packs
- Akamai CDN
- Amazon CloudFront
- Amazon VPC Flow Logs
- AWS Application Load Balancer Logs
- AWS CloudTrail
- AWS Elastic Load Balancer Logs
- AWS Network Load Balancer Logs
- Cisco ASA
- Cloudflare
- F5
- Fastly
- Fortinet Firewall
- HAProxy Ingress
- Istio Proxy
- Juniper SRX Firewall Traffic Logs
- Netskope
- NGINX
- Okta
- Palo Alto Firewall
- Windows XML
- ZScaler ZIA DNS
- Zscaler ZIA Firewall
- Zscaler ZIA Tunnel
- Zscaler ZIA Web Logs
- Search Syntax
- Scaling and Performance
- Monitoring and Troubleshooting
- Guides and Resources
- Log Management
- CloudPrem
- Administration
- Account Management
- Data Security
- Help
Search Logs
Overview
The Log Explorer lets you search and view individual logs as a list. However, the most valuable insights often come from aggregating logs at scale. Using the search feature, you can filter logs and visualize them as timeseries charts, top lists, tree maps, pie charts, or tables to better understand trends, patterns, and outliers across your log data.
Natural language queries
Natural Language Queries is not available in the Datadog site ().
Natural Language Queries (NLQ) for Logs is built with Llama.
Use Natural Language Queries (NLQ) to describe what you’re looking for in plain English. Datadog automatically translates your request into a structured log query, making it easier to explore logs without needing to write complex syntax. To access this feature, click Ask in the search field.
The system translates natural language input into Datadog queries and understands context such as services, attributes, tags, and time ranges. It also detects relevant fields automatically and enables users to create visualizations using simple descriptions—for example, “Top 20 services by errors” or “Show errors from service X in the past 24 hours.”
To disable NLQ, you must have org_management permissions. Navigate to Organization Settings > Preferences and toggle off the Natural Language Queries feature.
Search query
A Log Explorer search consists of a time range and a search query, combining key:value and full-text search. You can choose a time window for your search using the time range selector at the top right of the Log Explorer. For details on setting a custom time range, see the Custom Time Frames documentation.
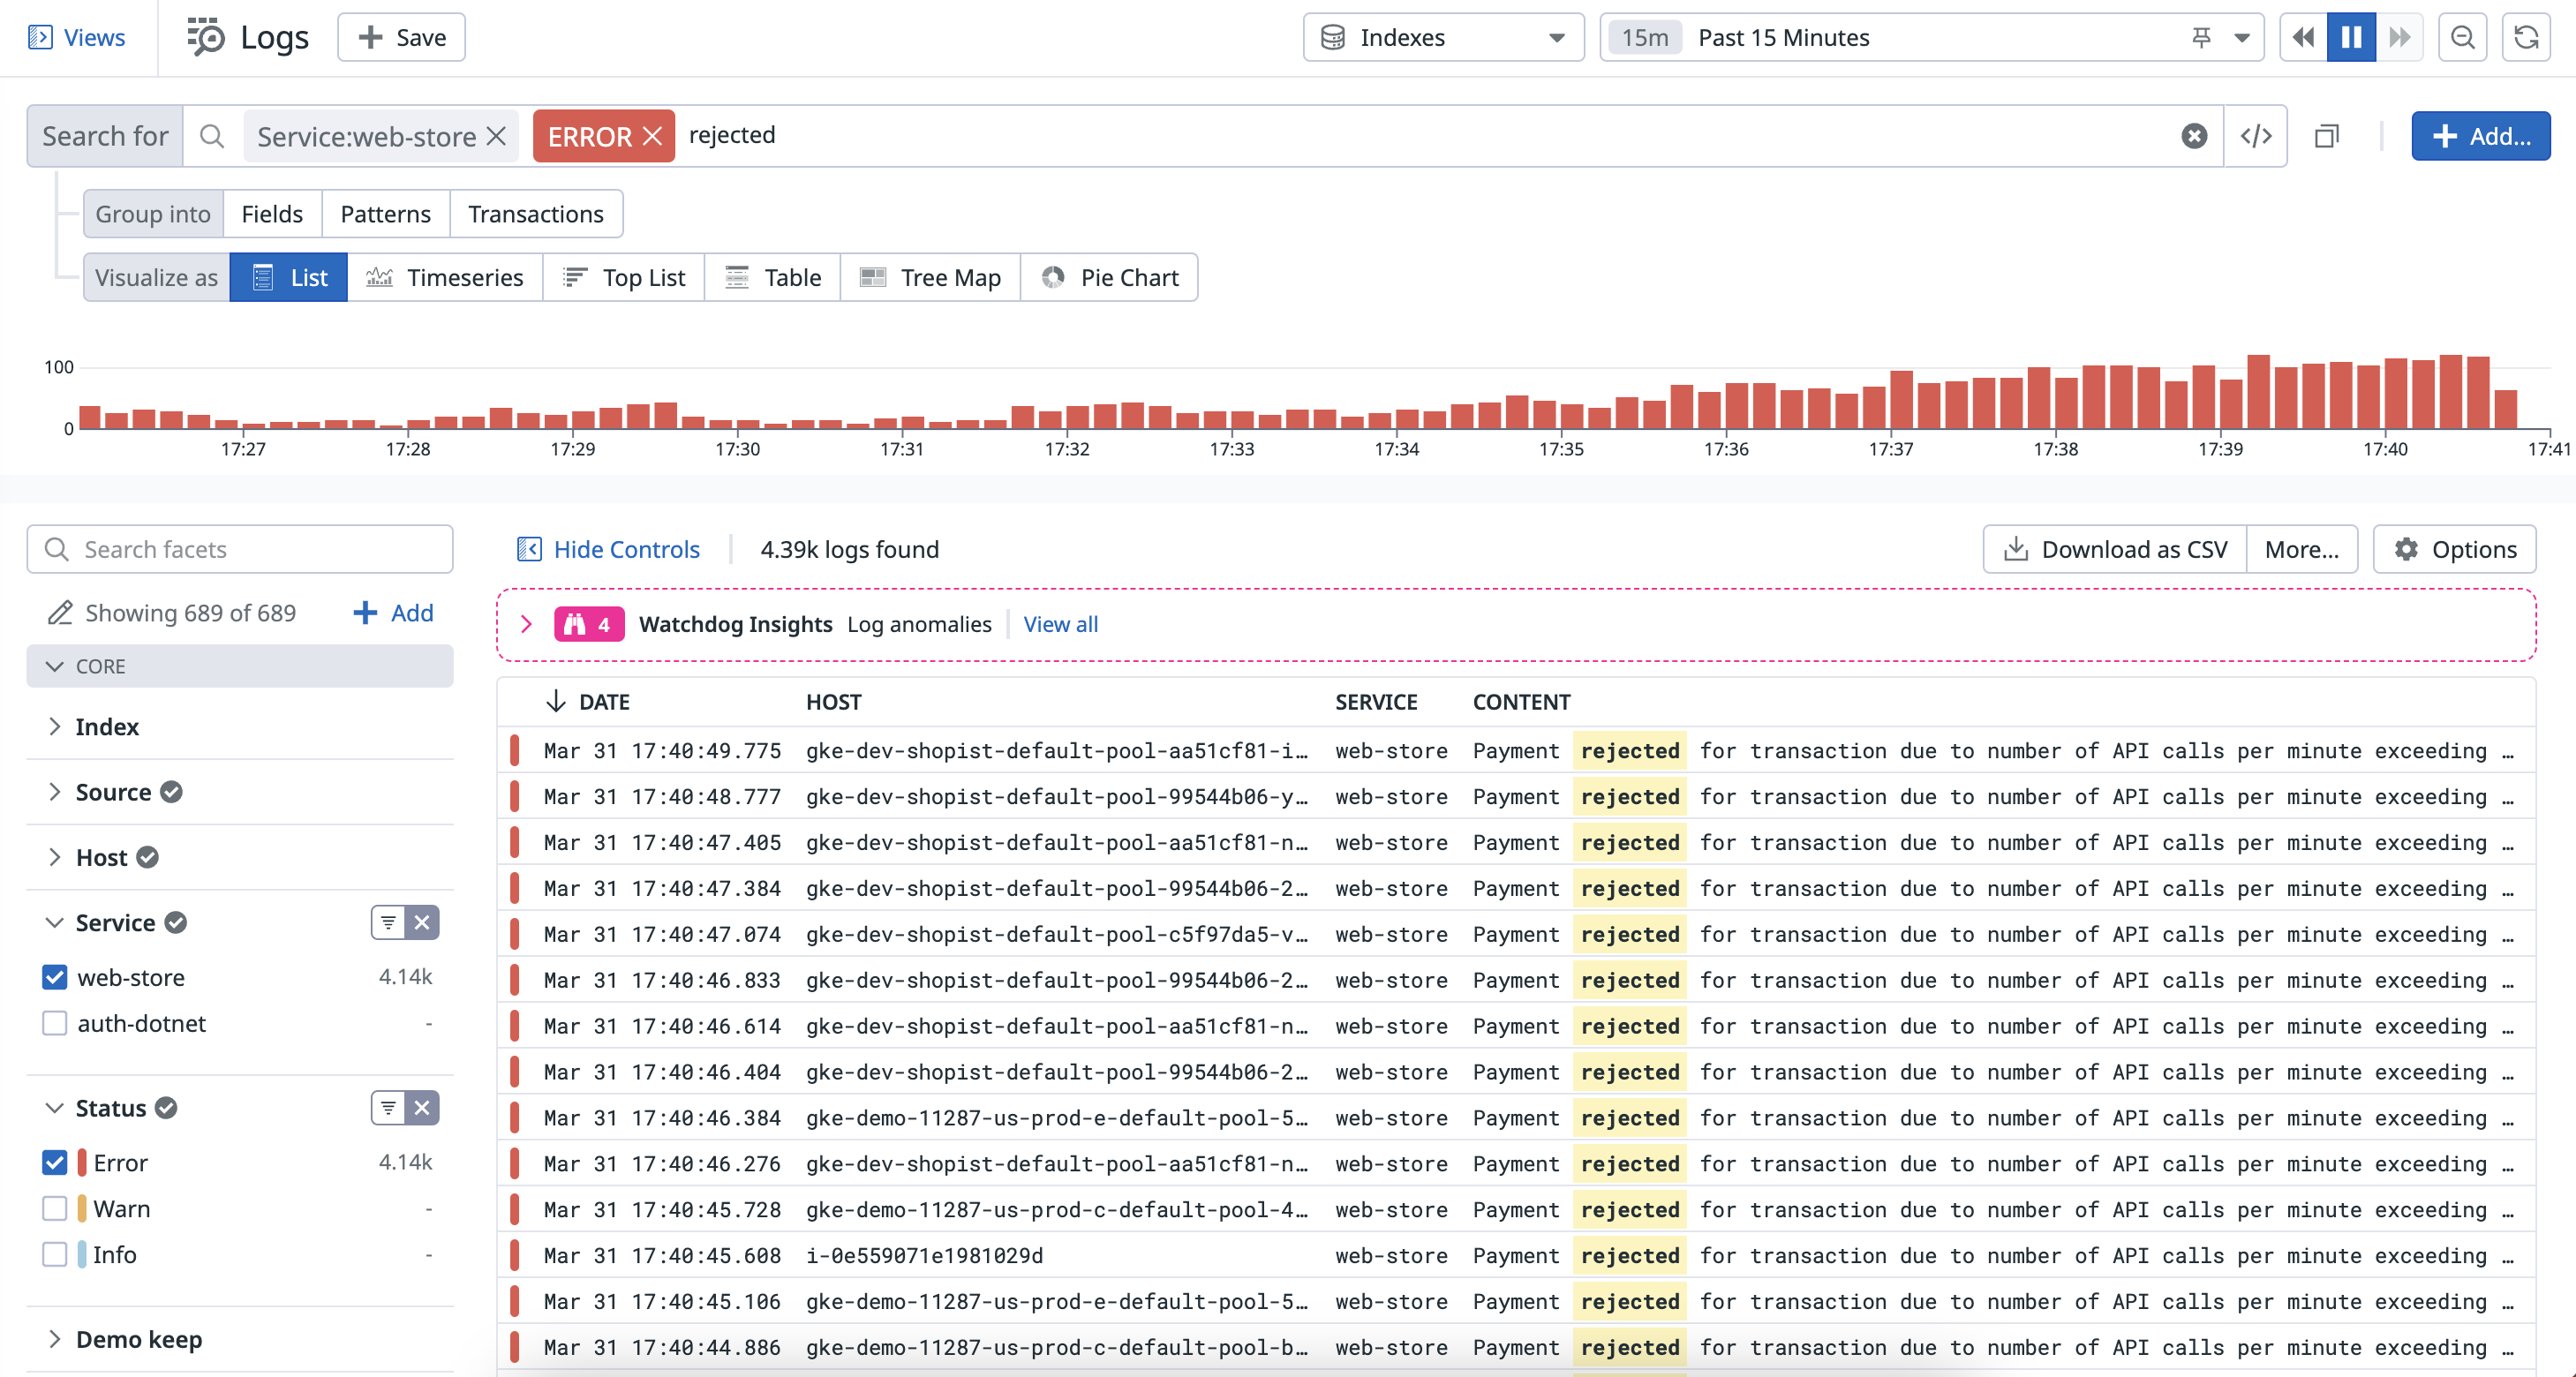
To filter on logs produced by a web store service, with an error status, over the past fifteen minutes, create a custom query like service:payment status:error rejected and set the time range to the Past 15 minutes:
Indexed Logs support both full-text search and key:value search queries.
Note: key:value queries do not require that you declare a facet beforehand.
For complete query syntax reference, see the Search Syntax documentation.
Search bar features
The Log Explorer search bar includes several features to help you write queries more efficiently and accurately.
Syntax highlighting and error validation
Syntax highlighting clearly differentiates input types: keys, values, free text, and control characters. For example, service and status are keys, auth-dotnet and error are values, 500 and check-token are free text, and parentheses are control characters. Status attributes are color-coded by status (red for error, blue for info).
Error validation identifies syntax errors and suggests fixes, such as missing values in key:value pairs, incomplete range queries, or unclosed parentheses.
Autocomplete
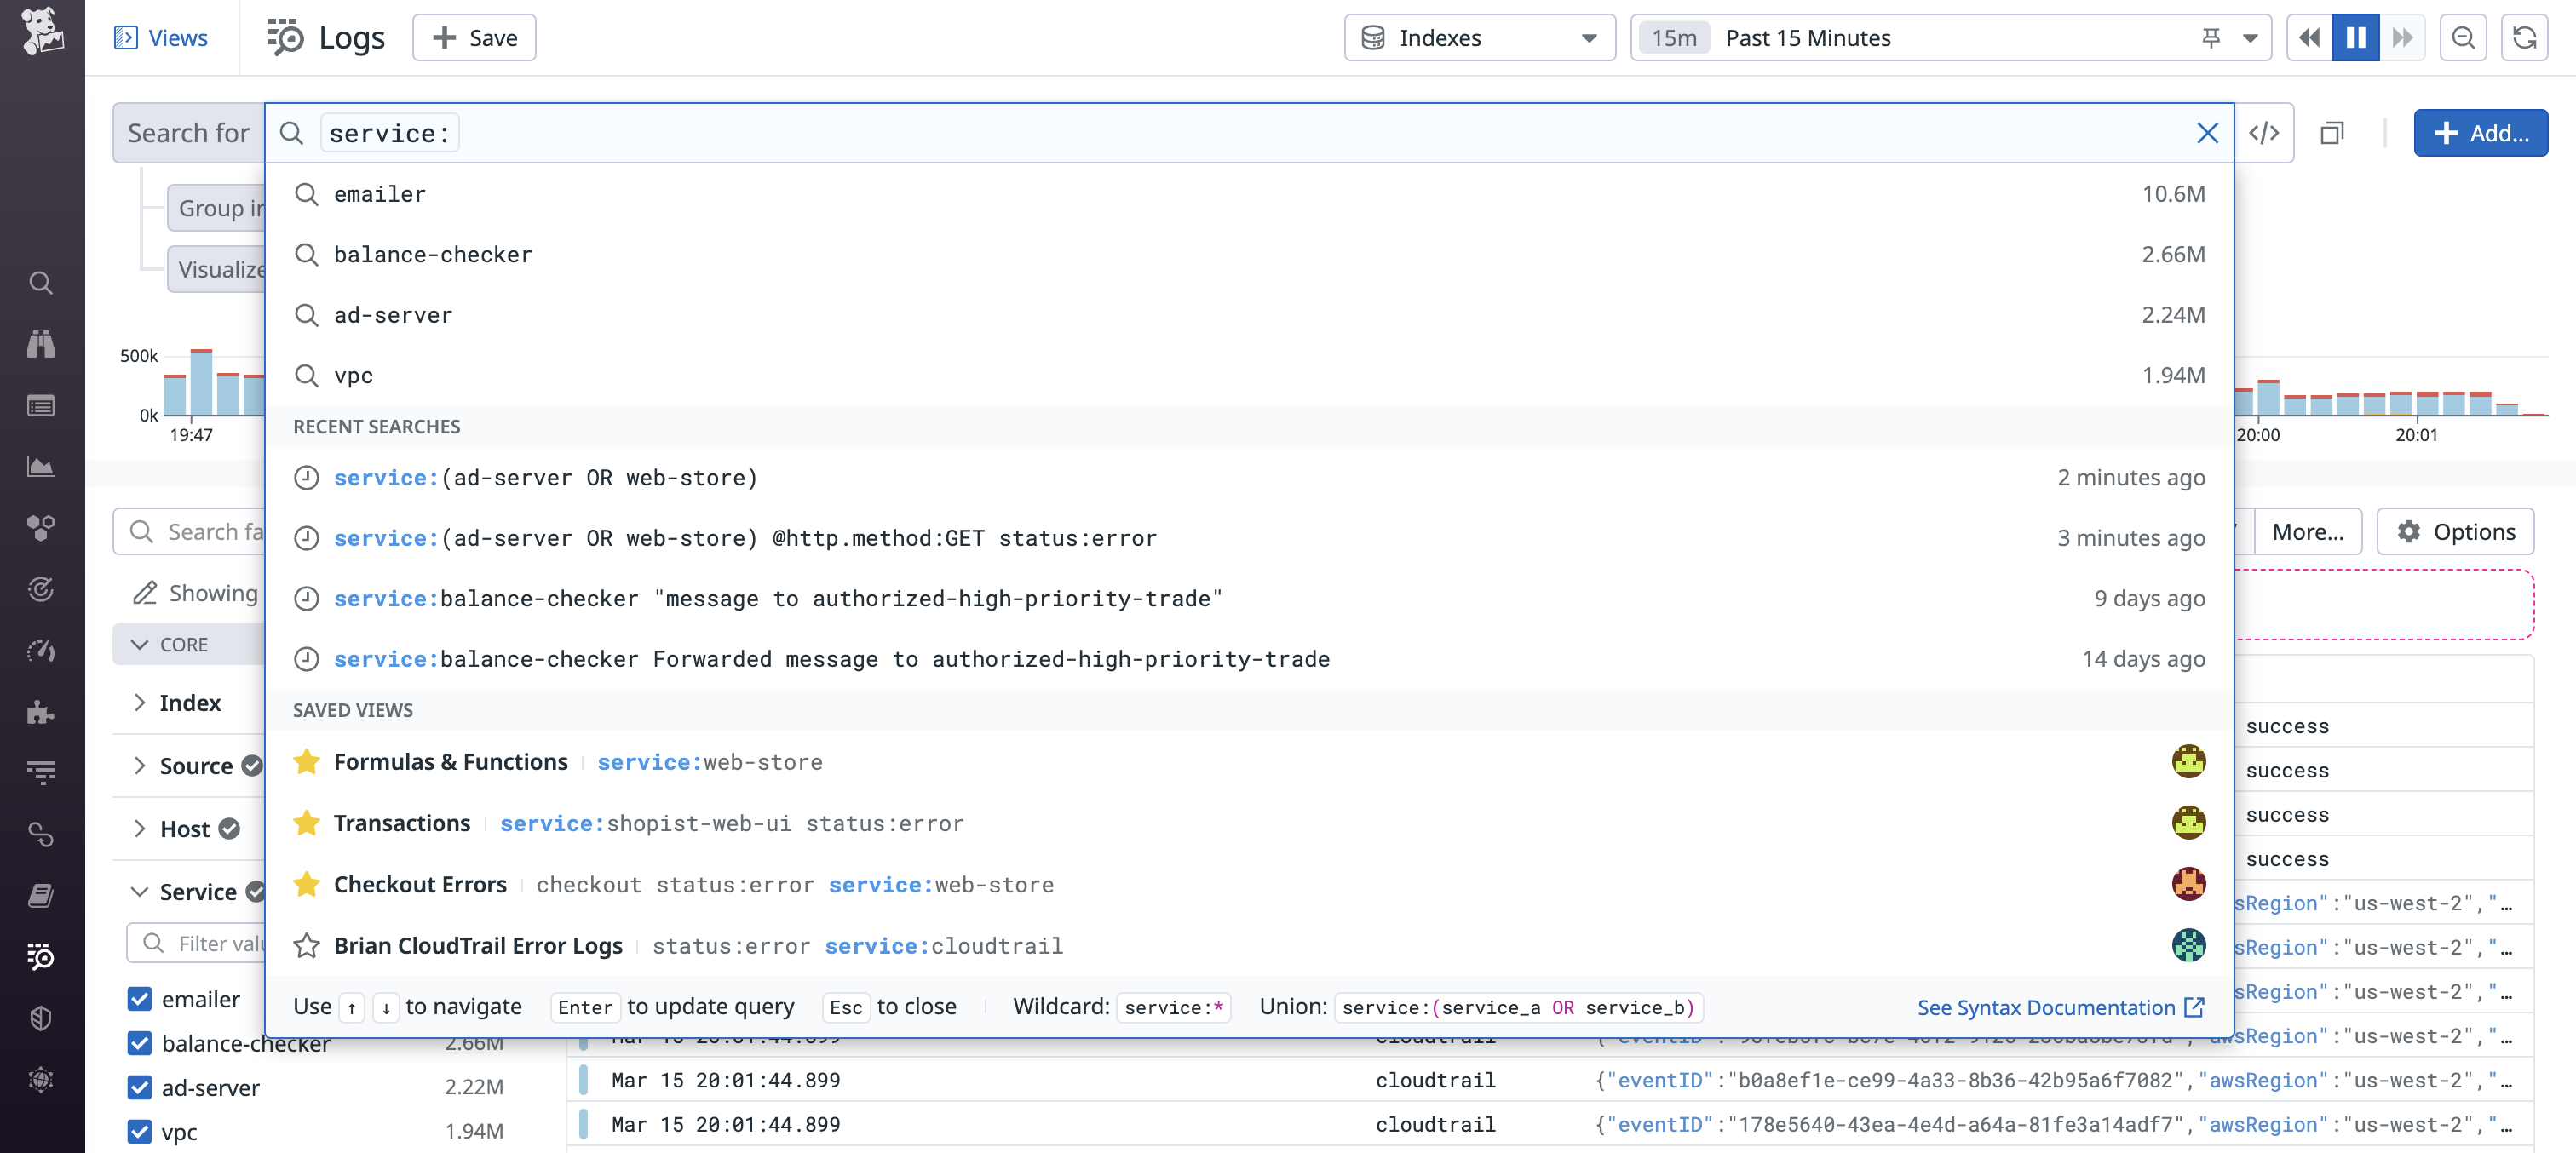
The search bar’s autocomplete feature helps you complete queries using existing keys and values in your logs, recent searches, and saved views.
Autocomplete suggests facets and values based on your input, displayed in the order they appear in the facet panel. After selecting a facet and entering :, values appear in descending order by log count from the past 15 minutes.
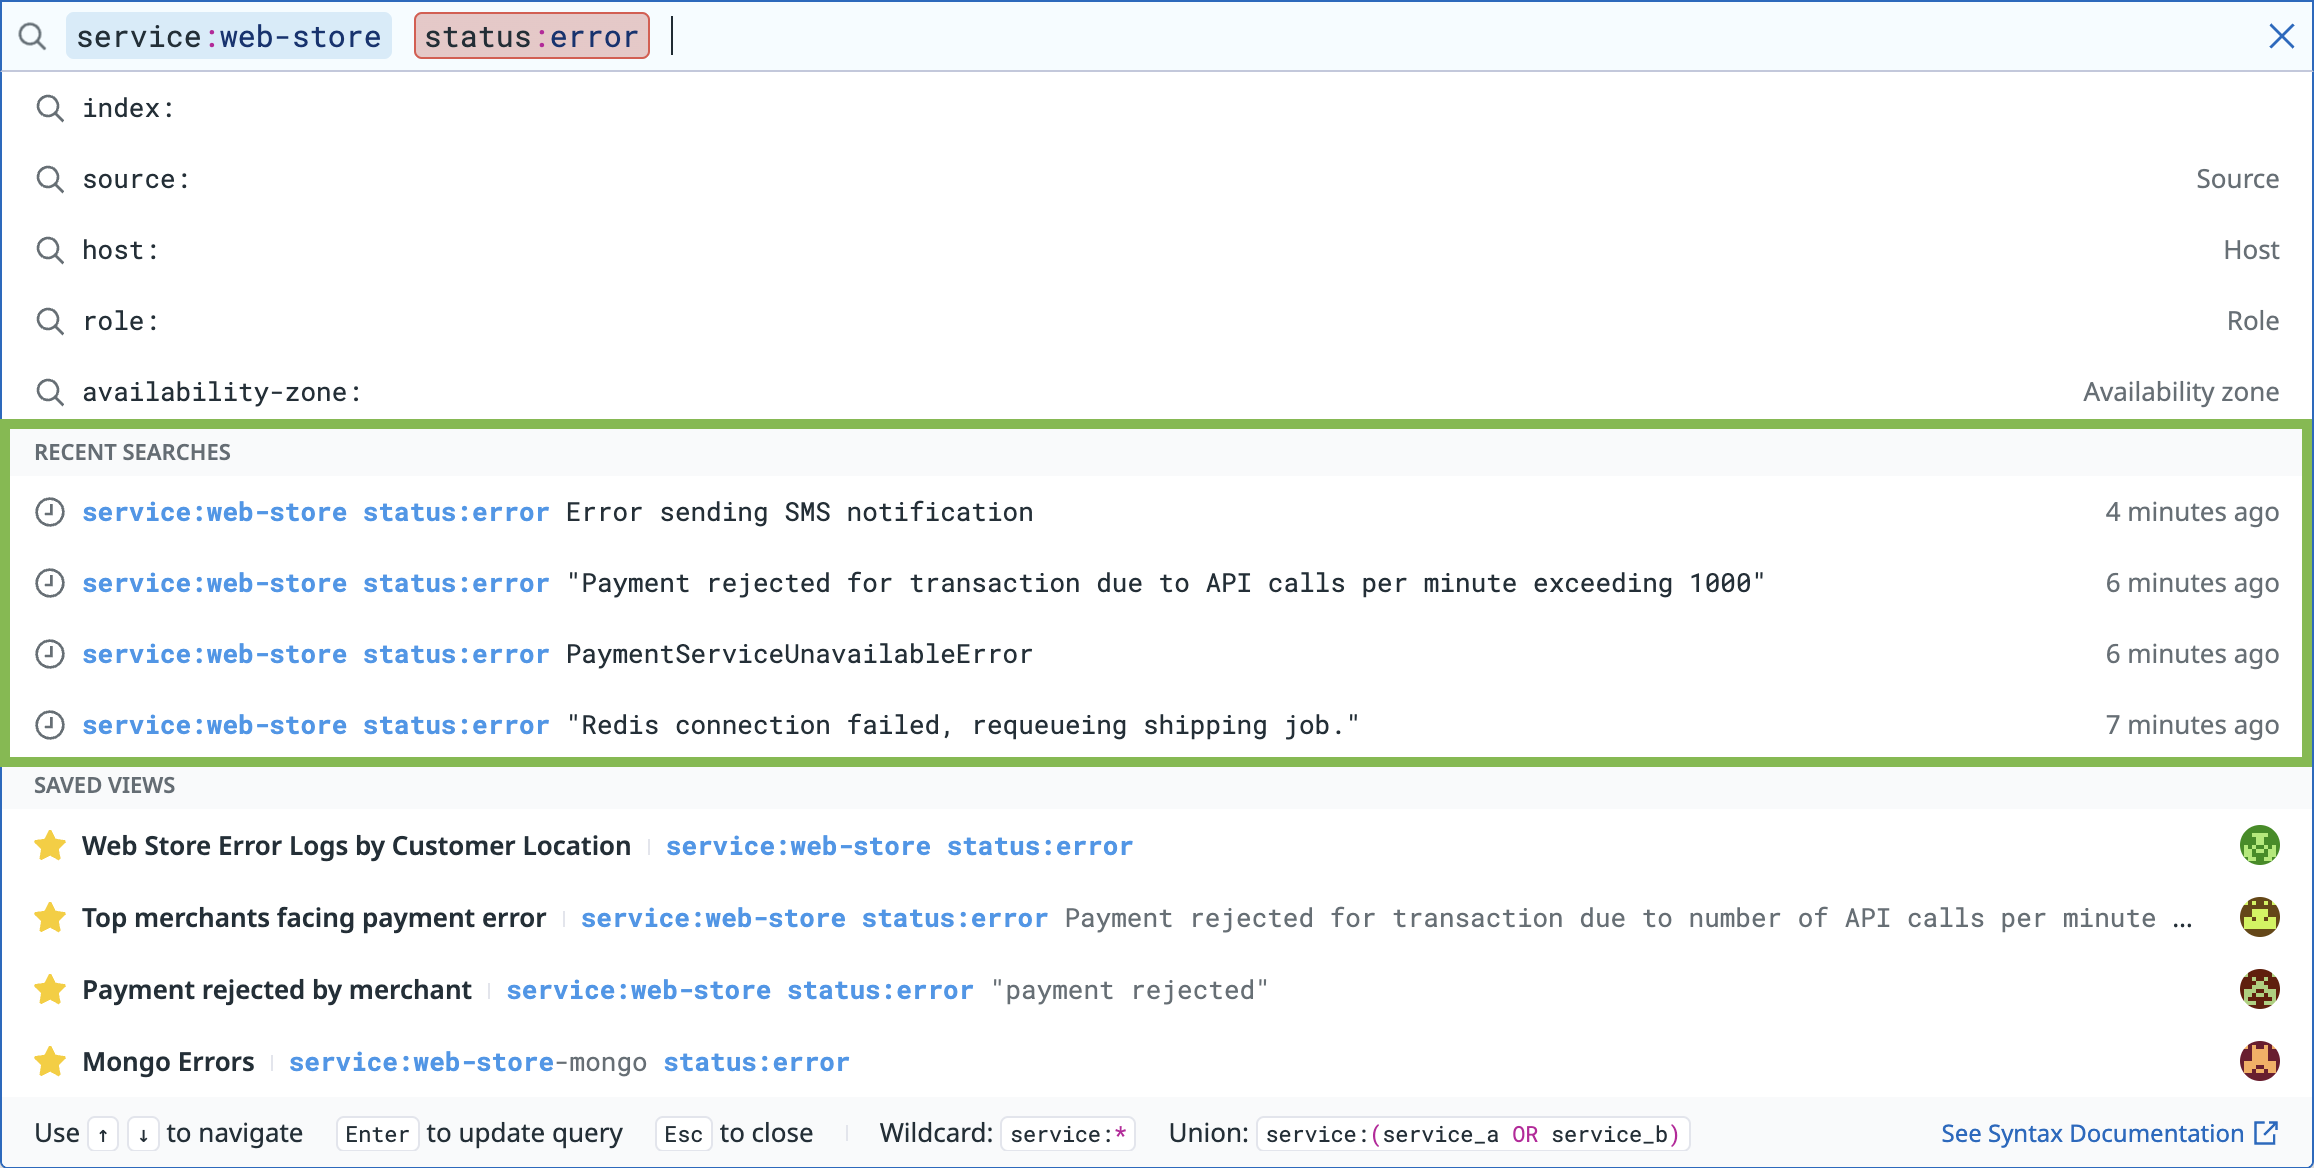
Your 100 most recent searches are retained and suggested as you type. Saved Views that match your query are also suggested, displayed in the same order as the Saved Views panel.
Disable styling and autocomplete for search bar
Toggle the button to the right of the search bar to search in raw mode, where syntax highlighting, search pills styling, and autocomplete are removed:
You can interact with the search bar with your mouse, as well as by using keyboard commands. For example, use CMD-A for selecting text, CMD-C for copying text, CMD-X for cutting text, and CMD-V for pasting text.
Further Reading
Additional helpful documentation, links, and articles:


