- Agents
- Essentials
- Getting Started
- Agent
- API
- APM Tracing
- Containers
- Dashboards
- Database Monitoring
- Datadog
- Datadog Site
- DevSecOps
- Incident Management
- Integrations
- Internal Developer Portal
- Logs
- Monitors
- Notebooks
- OpenTelemetry
- Profiler
- Search
- Session Replay
- Security
- Serverless for AWS Lambda
- Software Delivery
- Synthetic Monitoring and Testing
- Tags
- Workflow Automation
- Learning Center
- Support
- Glossary
- Standard Attributes
- Guides
- Agent
- Integrations
- Extend Datadog
- Authorization
- DogStatsD
- Custom Checks
- Integrations
- Build an Integration with Datadog
- Create an Agent-based Integration
- Create an API-based Integration
- Create a Log Pipeline
- Integration Assets Reference
- Build a Marketplace Offering
- Create an Integration Dashboard
- Create a Monitor Template
- Create a Cloud SIEM Detection Rule
- Install Agent Integration Developer Tool
- Service Checks
- Community
- Guides
- OpenTelemetry
- Administrator's Guide
- API
- Partners
- Datadog Mobile App
- DDSQL Reference
- CoScreen
- CoTerm
- Remote Configuration
- Cloudcraft (Standalone)
- In The App
- Dashboards
- Notebooks
- DDSQL Editor
- Reference Tables
- Sheets
- Monitors and Alerting
- Service Level Objectives
- Metrics
- Watchdog
- Bits AI
- Internal Developer Portal
- Error Tracking
- Change Tracking
- Event Management
- Incident Response
- Actions & Remediations
- Infrastructure
- Cloudcraft
- Resource Catalog
- Universal Service Monitoring
- End User Device Monitoring
- Hosts
- Containers
- Processes
- Serverless
- Network Monitoring
- Storage Management
- Cloud Cost
- Application Performance
- APM
- Continuous Profiler
- Database Monitoring
- Agent Integration Overhead
- Setup Architectures
- Setting Up Postgres
- Setting Up MySQL
- Setting Up SQL Server
- Setting Up Oracle
- Setting Up Amazon DocumentDB
- Setting Up MongoDB
- Setting Up ClickHouse
- Connecting DBM and Traces
- Data Collected
- Exploring Database Hosts
- Exploring Query Metrics
- Exploring Query Samples
- Exploring Database Schemas
- Exploring Recommendations
- Troubleshooting
- Guides
- Data Streams Monitoring
- Data Observability
- Digital Experience
- Real User Monitoring
- Synthetic Testing and Monitoring
- Continuous Testing
- Experiments
- Product Analytics
- Session Replay
- Software Delivery
- CI Visibility
- CD Visibility
- Deployment Gates
- Test Optimization
- Code Coverage
- PR Gates
- DORA Metrics
- Feature Flags
- Developer Integrations
- Security
- Security Overview
- Cloud SIEM
- Code Security
- Cloud Security
- App and API Protection
- AI Guard
- Workload Protection
- Sensitive Data Scanner
- AI Observability
- Log Management
- Observability Pipelines
- Configuration
- Sources
- Processors
- Destinations
- Packs
- Akamai CDN
- Amazon CloudFront
- Amazon VPC Flow Logs
- AWS Application Load Balancer Logs
- AWS CloudTrail
- AWS Elastic Load Balancer Logs
- AWS Network Load Balancer Logs
- Cisco ASA
- Cloudflare
- F5
- Fastly
- Fortinet Firewall
- HAProxy Ingress
- Istio Proxy
- Juniper SRX Firewall Traffic Logs
- Netskope
- NGINX
- Okta
- Palo Alto Firewall
- Windows XML
- ZScaler ZIA DNS
- Zscaler ZIA Firewall
- Zscaler ZIA Tunnel
- Zscaler ZIA Web Logs
- Search Syntax
- Scaling and Performance
- Monitoring and Troubleshooting
- Guides and Resources
- Log Management
- CloudPrem
- Administration
Tracing Proxy Services
This product is not supported for your selected Datadog site. ().
Overview
Like traditional applications, an LLM application can span multiple microservices. With LLM Observability, if one of these services is an LLM proxy or gateway, you can trace LLM calls within a complete end-to-end trace, capturing the full request path across services.
Enabling LLM Observability for a proxy or gateway service
To enable LLM Observability for a proxy or gateway service used by multiple ML applications, you can configure it without specifying an ML application name. Instead, set the service name. This allows you to filter spans specific to that proxy or gateway service within LLM observability.
# proxy.py
from ddtrace.llmobs import LLMObs

LLMObs.enable(service="chat-proxy")

# proxy-specific logic, including guardrails, sensitive data scans, and the LLM call
// proxy.js
const tracer = require('dd-trace').init({
  llmobs: true,
  service: "chat-proxy"
});
const llmobs = tracer.llmobs;

// proxy-specific logic, including guardrails, sensitive data scans, and the LLM call
If you have a service that orchestrates ML applications which send requests to an LLM proxy or gateway, enable LLM Observability with the ML application name:
# application.py
from ddtrace.llmobs import LLMObs
LLMObs.enable(ml_app="my-ml-app")

import requests

if __name__ == "__main__":
    with LLMObs.workflow(name="run-chat"):
      # other application-specific logic - (such as RAG steps and parsing)

      response = requests.post("http://localhost:8080/chat", json={
        # data to pass to the proxy service
      })


      # other application-specific logic handling the response
// application.js
const tracer = require('dd-trace').init({
  llmobs: {
    mlApp: 'my-ml-app'
  }
});
const llmobs = tracer.llmobs;

const axios = require('axios');

async function main () {
  llmobs.trace({ name: 'run-chat', kind: 'workflow' }, async () => {
    // other application-specific logic - (such as RAG steps and parsing)

    // wrap the proxy call in a task span
    const response = await axios.post('http://localhost:8080/chat', {
      // data to pass to the proxy service
    });

    // other application-specific logic handling the response
  });
}

main();
When the LLM application makes a request to the proxy or gateway service, the LLM Observability SDK automatically propagates the ML application name from the original LLM application. The propagated ML application name takes precedence over the ML application name specified in the proxy or gateway service.
Observing LLM gateway and proxy services
All requests to the proxy or gateway service
To view all requests to the proxy service as top-level spans, wrap the entrypoint of the proxy service endpoint in a workflow span:
# proxy.py
from ddtrace.llmobs import LLMObs

LLMObs.enable(service="chat-proxy")

@app.route('/chat')
def chat():
    with LLMObs.workflow(name="chat-proxy-entrypoint"):
        # proxy-specific logic, including guardrails, sensitive data scans, and the LLM call
// proxy.js
const tracer = require('dd-trace').init({
  llmobs: true,
  service: "chat-proxy"
});
const llmobs = tracer.llmobs;

app.post('/chat', async (req, res) => {
  await llmobs.trace({ name: 'chat-proxy-entrypoint', kind: 'workflow' }, async () => {
    // proxy-specific logic, including guardrails, sensitive data scans, and the LLM call
    res.send("Hello, world!");
  });
});
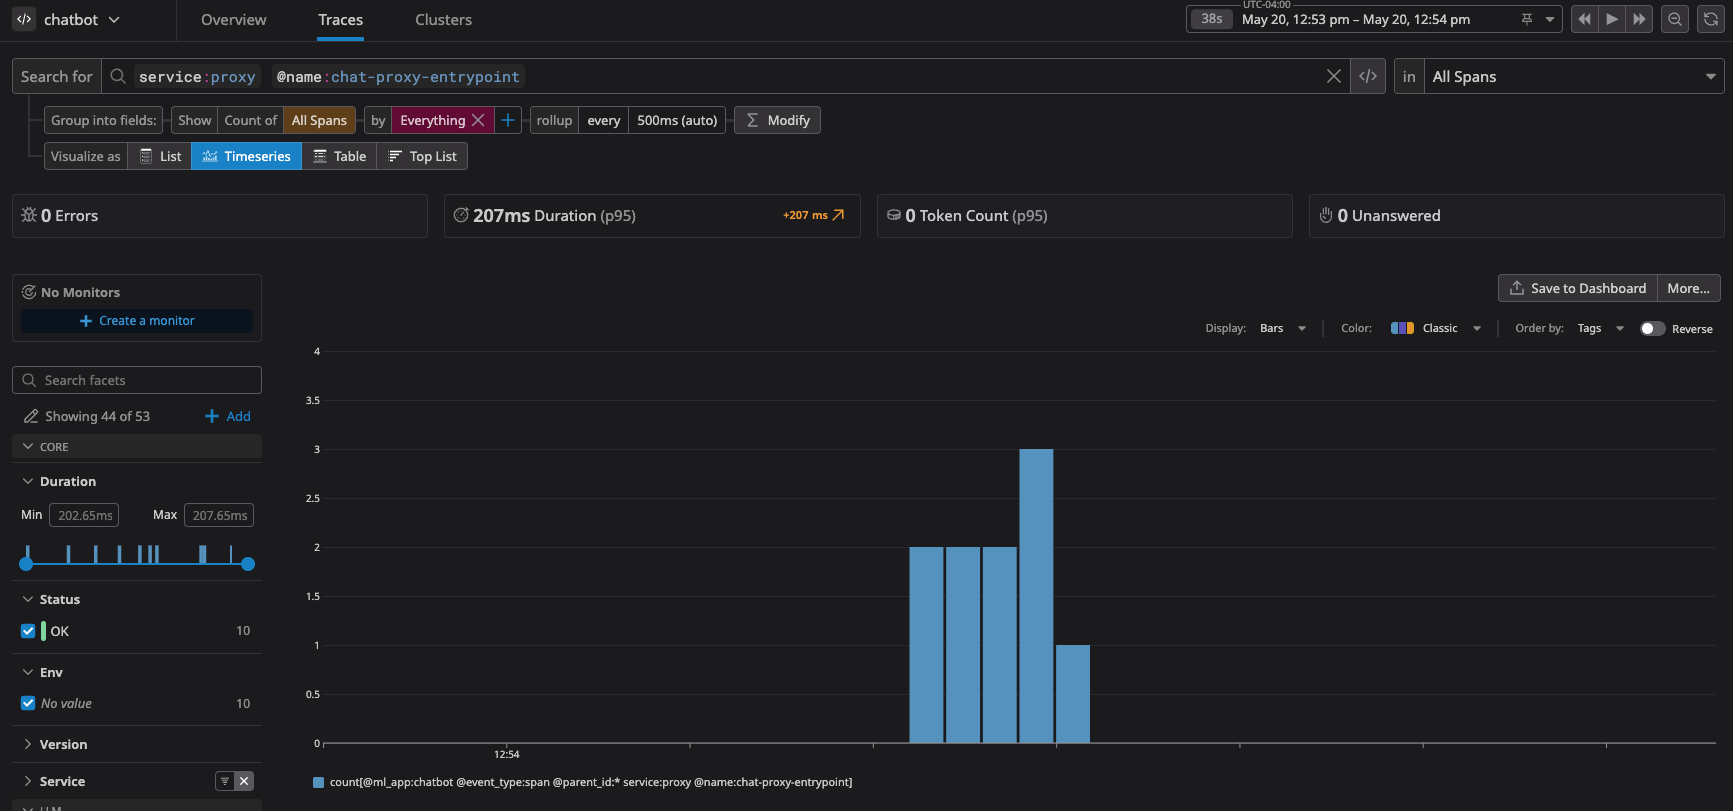
All requests to the proxy service can then be viewed as top-level spans within the LLM trace view:
- In the LLM trace page, select All Applications from the top-left dropdown.
- Switch to the All Spans view in the top-right dropdown.
- Filter the list by the
servicetag and the workflow name.
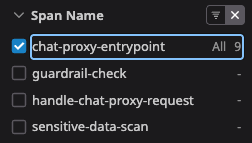
You can also filter the workflow Span Name using the facet on the left hand side of the trace view:
All LLM calls made within the proxy or gateway service
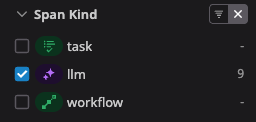
To only monitor the LLM calls made within a proxy or gateway service, filter by llm spans in the trace view:
You can also filter the Span Kind facet on the left hand side of the trace view:
Filtering by a specific ML application and observing patterns and trends
You can apply both filtering processes (top-level calls to the proxy service and LLM calls made within the proxy or gateway service) to a specific ML application to view its interaction with the proxy or gateway service.
- In the top-left dropdown, select the ML application of interest.
- To see all traces for the ML application, switch from the All Spans view to the Traces view in the top-right dropdown.
- To see a timeseries of traces for the ML application, switch back to the All Spans filter in the top-right dropdown and next to “Visualize as”, select Timeseries.
Observing end-to-end usage of LLM applications making calls to a proxy or gateway service
To observe the complete end-to-end usage of an LLM application that makes calls to a proxy or gateway service, you can filter for traces with that ML application name:
- In the LLM trace view, select the ML application name of interest from the top-left dropdown.
- Switch to the
Tracesview in the top-right dropdown.


