概要

Synthetic Monitoring における Network Path Testing は、Synthetic テストがたどる経路に対する完全な可視性を提供します。アプリケーション、オンプレミス ネットワーク、ISP のいずれで障害が発生しているかを正確に特定できます。これにより、根本原因の特定が加速され、プロアクティブな問題検知が可能になり、テスト失敗時に対応可能なアラートをトリガーできます。また、稼働時間データも提供され、ネットワークの信頼性への投資価値を測定し、共有するのに役立ちます。

Managed Locations から Network Path テストを実行すると、アプリケーションに対して TCP、UDP、ICMP チェックを実施できます。世界各地のロケーションからクエリを実行する際に、パケットがたどる Network Path を可視化します。

Synthetic Monitoring における Network Path テストの課金については、料金ページを参照してください。

テストの作成

  1. Datadog で、左側メニューの Digital Experience にマウス オーバーし、Tests (under Synthetic Monitoring & Testing) を選択します。
  2. New Test > Network Path Test をクリックします。
New Synthetics Test から Network Path テストを作成

テストの設定

  1. request type (TCP、UDP、ICMP) を選択し、クエリ先のホスト または URL を指定します。ポート情報は任意です。
  2. テストに名前を付けます。
  3. 任意: 詳細オプションを設定します:
    1. Source service: Network Path の可視化で、送信元ホストに表示するラベル。
    2. Destination service: Network Path の可視化で、宛先ホストに表示するラベル。
    3. Max TTL: 送信プローブ パケットの最大 TTL (最大ホップ数)。既定値は 30 ホップ。
    4. E2E Queries: パケット ロス、レイテンシ、ジッタを測定するために宛先へ送信するパケット数。既定値は 50。
    5. Traceroute Queries: 実行する traceroute の回数。結果は各テスト実行の詳細パネルで集約されます。既定値は 3。
    6. TCP traceroute strategy (TCP テストのみ): SACK と SYN の traceroute 戦略から選択します。SACK と Force SACK は、最新のアプリケーション トラフィックにより近い挙動を模倣します。
  4. 任意: テストに Tags を追加します (環境タグなど)。タグを使うと、Synthetic Monitoring & Continuous Testing ページ で Synthetic テストをフィルタリングできます。
Advanced options を表示した Network Path テスト作成フォーム。
  1. 期待する結果を定義するために assertions を設定します。少なくとも 1 つの assertion が必要です。

    assertions ドロップ ダウンのある Network Path テスト作成フォーム。
    タイプ演算子 1演算子 2値の型
    latencyavg, max, minis, <, <=, >, >=int
    packet lossis, <, <=, >, >=int (0 から 100)
    jitteris, <, <=, >, >=float
    network hopsavg, max, minis, <, <=, >, >=int
  2. テストを実行する locations を選択します。Network Path テストは Managed Locations から実行でき、グローバルなロケーションからエンド ポイントを検証できます。

    Datadog’s out-of-the-box managed locations allow you to test public-facing websites and endpoints from regions where your customers are located.

    AWS:

    AmericasAsia PacificEMEA
    Canada CentralHong KongBahrain
    Northern CaliforniaJakartaCape Town
    Northern VirginiaMumbaiFrankfurt
    OhioOsakaIreland
    OregonSeoulLondon
    São PauloSingaporeMilan
    SydneyParis
    TokyoStockholm

    GCP:

    AmericasAsia PacificEMEA
    DallasTokyoFrankfurt
    Los Angeles
    Oregon
    Virginia

    Azure:

    RegionLocation
    AmericasVirginia

    The Datadog for Government site (US1-FED) uses the following managed location:

    RegionLocation
    AmericasUS-West
  3. test frequency を設定して、Datadog が Network Path テストを実行する頻度を決定します。スケジュール済みのテストにより、最重要のエンド ポイントがユーザーに引き続き利用可能であることを保証します。

  4. Network Path テストに対して、アラート条件を定義 し、テスト モニターを設定 します。

Define alert conditions

Set alert conditions to determine the circumstances under which you want a test to fail and trigger an alert.

Alerting rule

When you set the alert conditions to: An alert is triggered if any assertion fails for X minutes from any n of N locations, an alert is triggered only if these two conditions are true:

  • At least one location was in failure (at least one assertion failed) during the last X minutes;
  • At one moment during the last X minutes, at least n locations were in failure.

Configure the test monitor

A notification is sent by your test based on the alerting conditions previously defined. Use this section to define how and what to message your team.

  1. Similar to how you configure monitors, select users and/or services that should receive notifications either by adding an @notification to the message or by searching for team members and connected integrations with the dropdown menu.

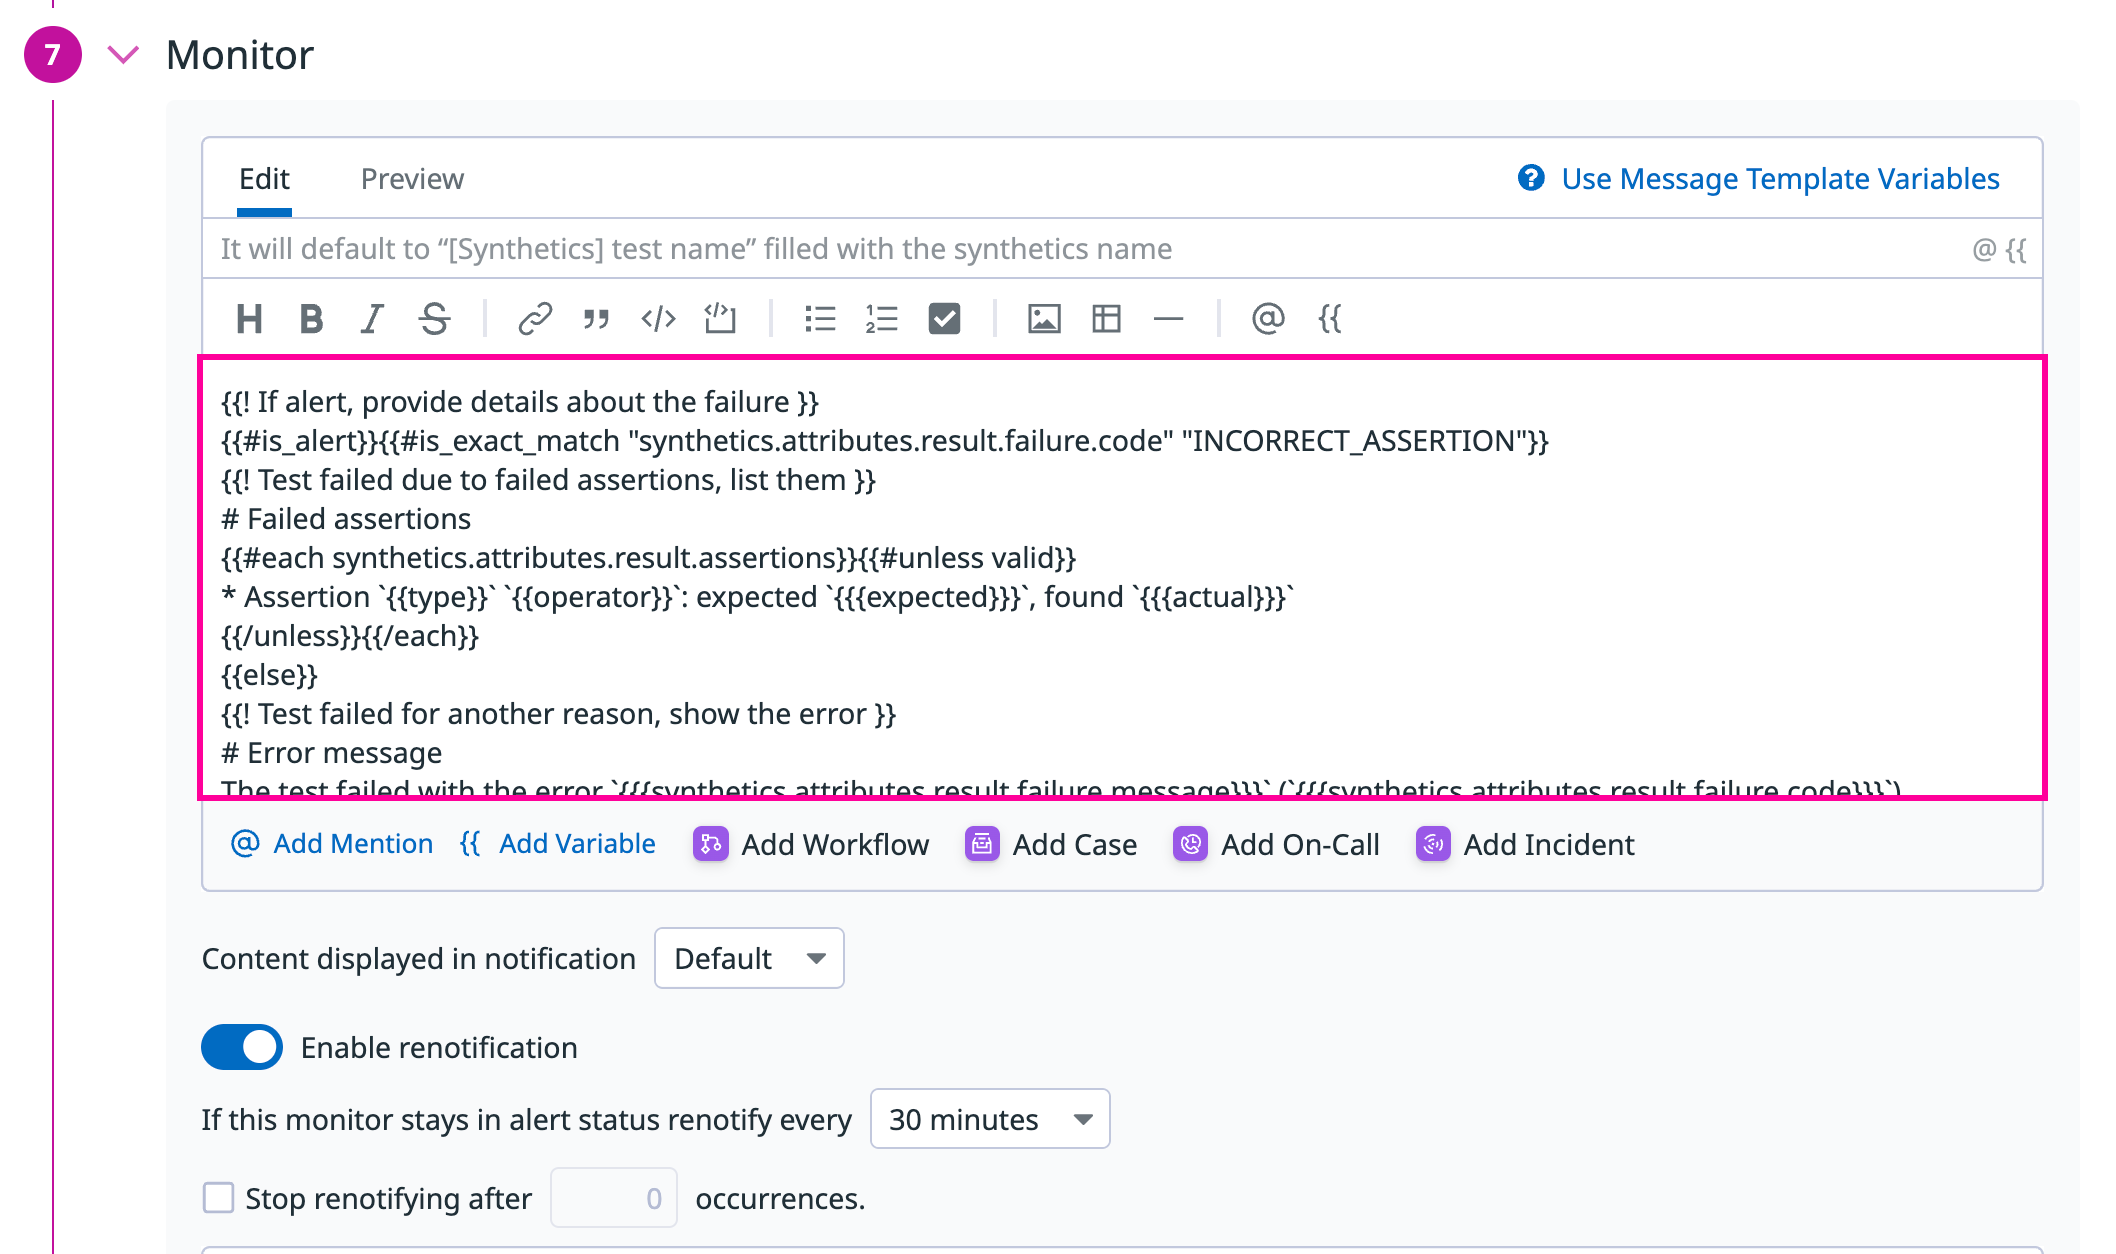
  2. Enter the notification message for your test or use pre-filled monitor messages. This field allows standard Markdown formatting and supports the following conditional variables:

Conditional VariableDescription
{{#is_alert}}Show when the test alerts.
{{^is_alert}}Show unless the test alerts.
{{#is_recovery}}Show when the test recovers from alert.
{{^is_recovery}}Show unless the test recovers from alert.
{{#is_renotify}}Show when the monitor renotifies.
{{^is_renotify}}Show unless the monitor renotifies.
{{#is_priority}}Show when the monitor matches priority (P1 to P5).
{{^is_priority}}Show unless the monitor matches priority (P1 to P5).

Notification messages include the message defined in this section and information about the failing locations. Pre-filled monitor messages are included in the message body section:

Synthetic Monitoring monitor section for API tests, highlighting the pre-filled monitor messages
  1. Specify how often you want your test to re-send the notification message in case of test failure. To prevent renotification on failing tests, check the option Stop re-notifying on X occurrences.

  2. Click Save Test to save your Network Path test configuration and monitor.

For more information, see Synthetic Monitoring notifications.

テスト結果を表示

Synthetic Tests ページ の Network Path テストをクリックすると、Test Details ページが開き、テストに関する包括的な情報が表示されます:

  • テストのプロパティと設定
  • テスト履歴
  • 個々のテスト実行
  • すべてのテスト実行にわたる Network Path の集計可視化

Network Path の可視化は、各テスト実行中にクエリを完了するためにパケットが通る経路を表示します。ヘルス バー のハンドルをドラッグして時間範囲を調整し、特定の時間間隔におけるエンド ツー エンドのレイテンシとパケット ロスのスナップショットを確認できます。Network Path の可視化の構成方法の詳細は、Network Path ドキュメント を参照してください。

ヘルス バーを変更しても、ページ上部のグローバルな時間範囲には影響しません。
Network Path の可視化セクション

特定のテスト実行の詳細を表示するには、ページ下部のテーブルで該当するテスト実行をクリックします。サイド パネルが開き、実行情報、Network Path の可視化、assertion 結果が表示されます。

ネットワーク テストの単一のテスト実行を表示するサイド パネル

保持期間

Network Path Testing のデータは 30 日間保持されます。

参考資料