- Principales informations
- Getting Started
- Agent
- API
- Tracing
- Conteneurs
- Dashboards
- Database Monitoring
- Datadog
- Site Datadog
- DevSecOps
- Incident Management
- Intégrations
- Internal Developer Portal
- Logs
- Monitors
- OpenTelemetry
- Profileur
- Session Replay
- Security
- Serverless for AWS Lambda
- Software Delivery
- Surveillance Synthetic
- Tags
- Workflow Automation
- Learning Center
- Support
- Glossary
- Standard Attributes
- Guides
- Agent
- Intégrations
- Développeurs
- OpenTelemetry
- Administrator's Guide
- API
- Partners
- Application mobile
- DDSQL Reference
- CoScreen
- CoTerm
- Remote Configuration
- Cloudcraft
- In The App
- Dashboards
- Notebooks
- DDSQL Editor
- Reference Tables
- Sheets
- Alertes
- Watchdog
- Métriques
- Bits AI
- Internal Developer Portal
- Error Tracking
- Change Tracking
- Service Management
- Actions & Remediations
- Infrastructure
- Cloudcraft
- Resource Catalog
- Universal Service Monitoring
- Hosts
- Conteneurs
- Processes
- Sans serveur
- Surveillance réseau
- Cloud Cost
- Application Performance
- APM
- Termes et concepts de l'APM
- Sending Traces to Datadog
- APM Metrics Collection
- Trace Pipeline Configuration
- Connect Traces with Other Telemetry
- Trace Explorer
- Recommendations
- Code Origin for Spans
- Observabilité des services
- Endpoint Observability
- Dynamic Instrumentation
- Live Debugger
- Suivi des erreurs
- Sécurité des données
- Guides
- Dépannage
- Profileur en continu
- Database Monitoring
- Agent Integration Overhead
- Setup Architectures
- Configuration de Postgres
- Configuration de MySQL
- Configuration de SQL Server
- Setting Up Oracle
- Setting Up Amazon DocumentDB
- Setting Up MongoDB
- Connecting DBM and Traces
- Données collectées
- Exploring Database Hosts
- Explorer les métriques de requête
- Explorer des échantillons de requêtes
- Exploring Database Schemas
- Exploring Recommendations
- Dépannage
- Guides
- Data Streams Monitoring
- Data Jobs Monitoring
- Data Observability
- Digital Experience
- RUM et Session Replay
- Surveillance Synthetic
- Continuous Testing
- Product Analytics
- Software Delivery
- CI Visibility
- CD Visibility
- Deployment Gates
- Test Visibility
- Code Coverage
- Quality Gates
- DORA Metrics
- Feature Flags
- Securité
- Security Overview
- Cloud SIEM
- Code Security
- Cloud Security Management
- Application Security Management
- Workload Protection
- Sensitive Data Scanner
- AI Observability
- Log Management
- Pipelines d'observabilité
- Log Management
- CloudPrem
- Administration
Network Path Testing
Cette page n'est pas encore disponible en français, sa traduction est en cours.
Si vous avez des questions ou des retours sur notre projet de traduction actuel, n'hésitez pas à nous contacter.
Si vous avez des questions ou des retours sur notre projet de traduction actuel, n'hésitez pas à nous contacter.
Overview
Network Path Testing in Synthetic Monitoring gives you complete visibility into the routes your synthetic tests follow. You can pinpoint where failures happen, whether in applications, on-premises networks, or with ISPs. This accelerates root cause analysis, enables proactive issue detection, and triggers actionable alerts when tests fail. It also provides uptime data to help you measure and communicate the value of your network reliability investments.
Running Network Path tests from managed locations lets you perform TCP, UDP, and ICMP checks on your application. Visualize the Network Path packets follow when executing queries from different global locations and private environments.
For information on billing for Network Path Testing in Synthetic Monitoring, see the pricing page.
Test creation
Note: This page covers running Network Path tests in Synthetic Monitoring, including Agent-based configuration. For scheduled and dynamic tests in Network Monitoring, see the Network Path Setup documentation. See understanding Network Path tests for more information.
- In Datadog, hover over Digital Experience in the left-hand menu and select Tests (under Synthetic Monitoring & Testing).
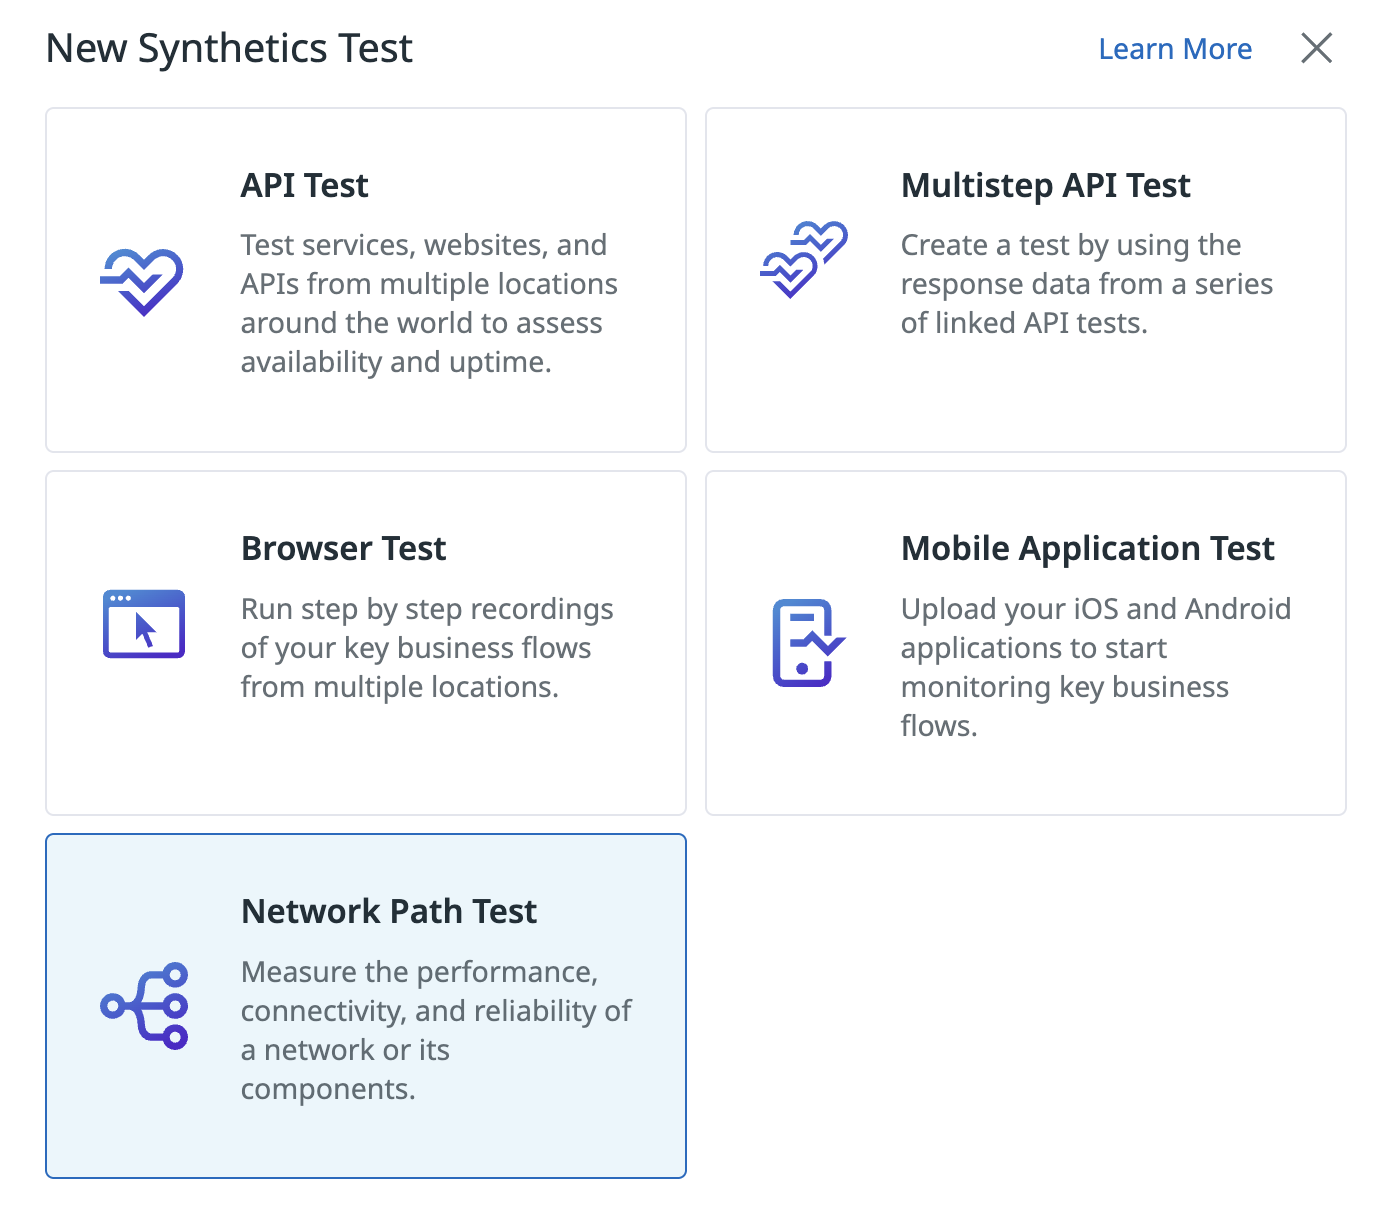
- Click New Test > Network Path Test.
Test configuration
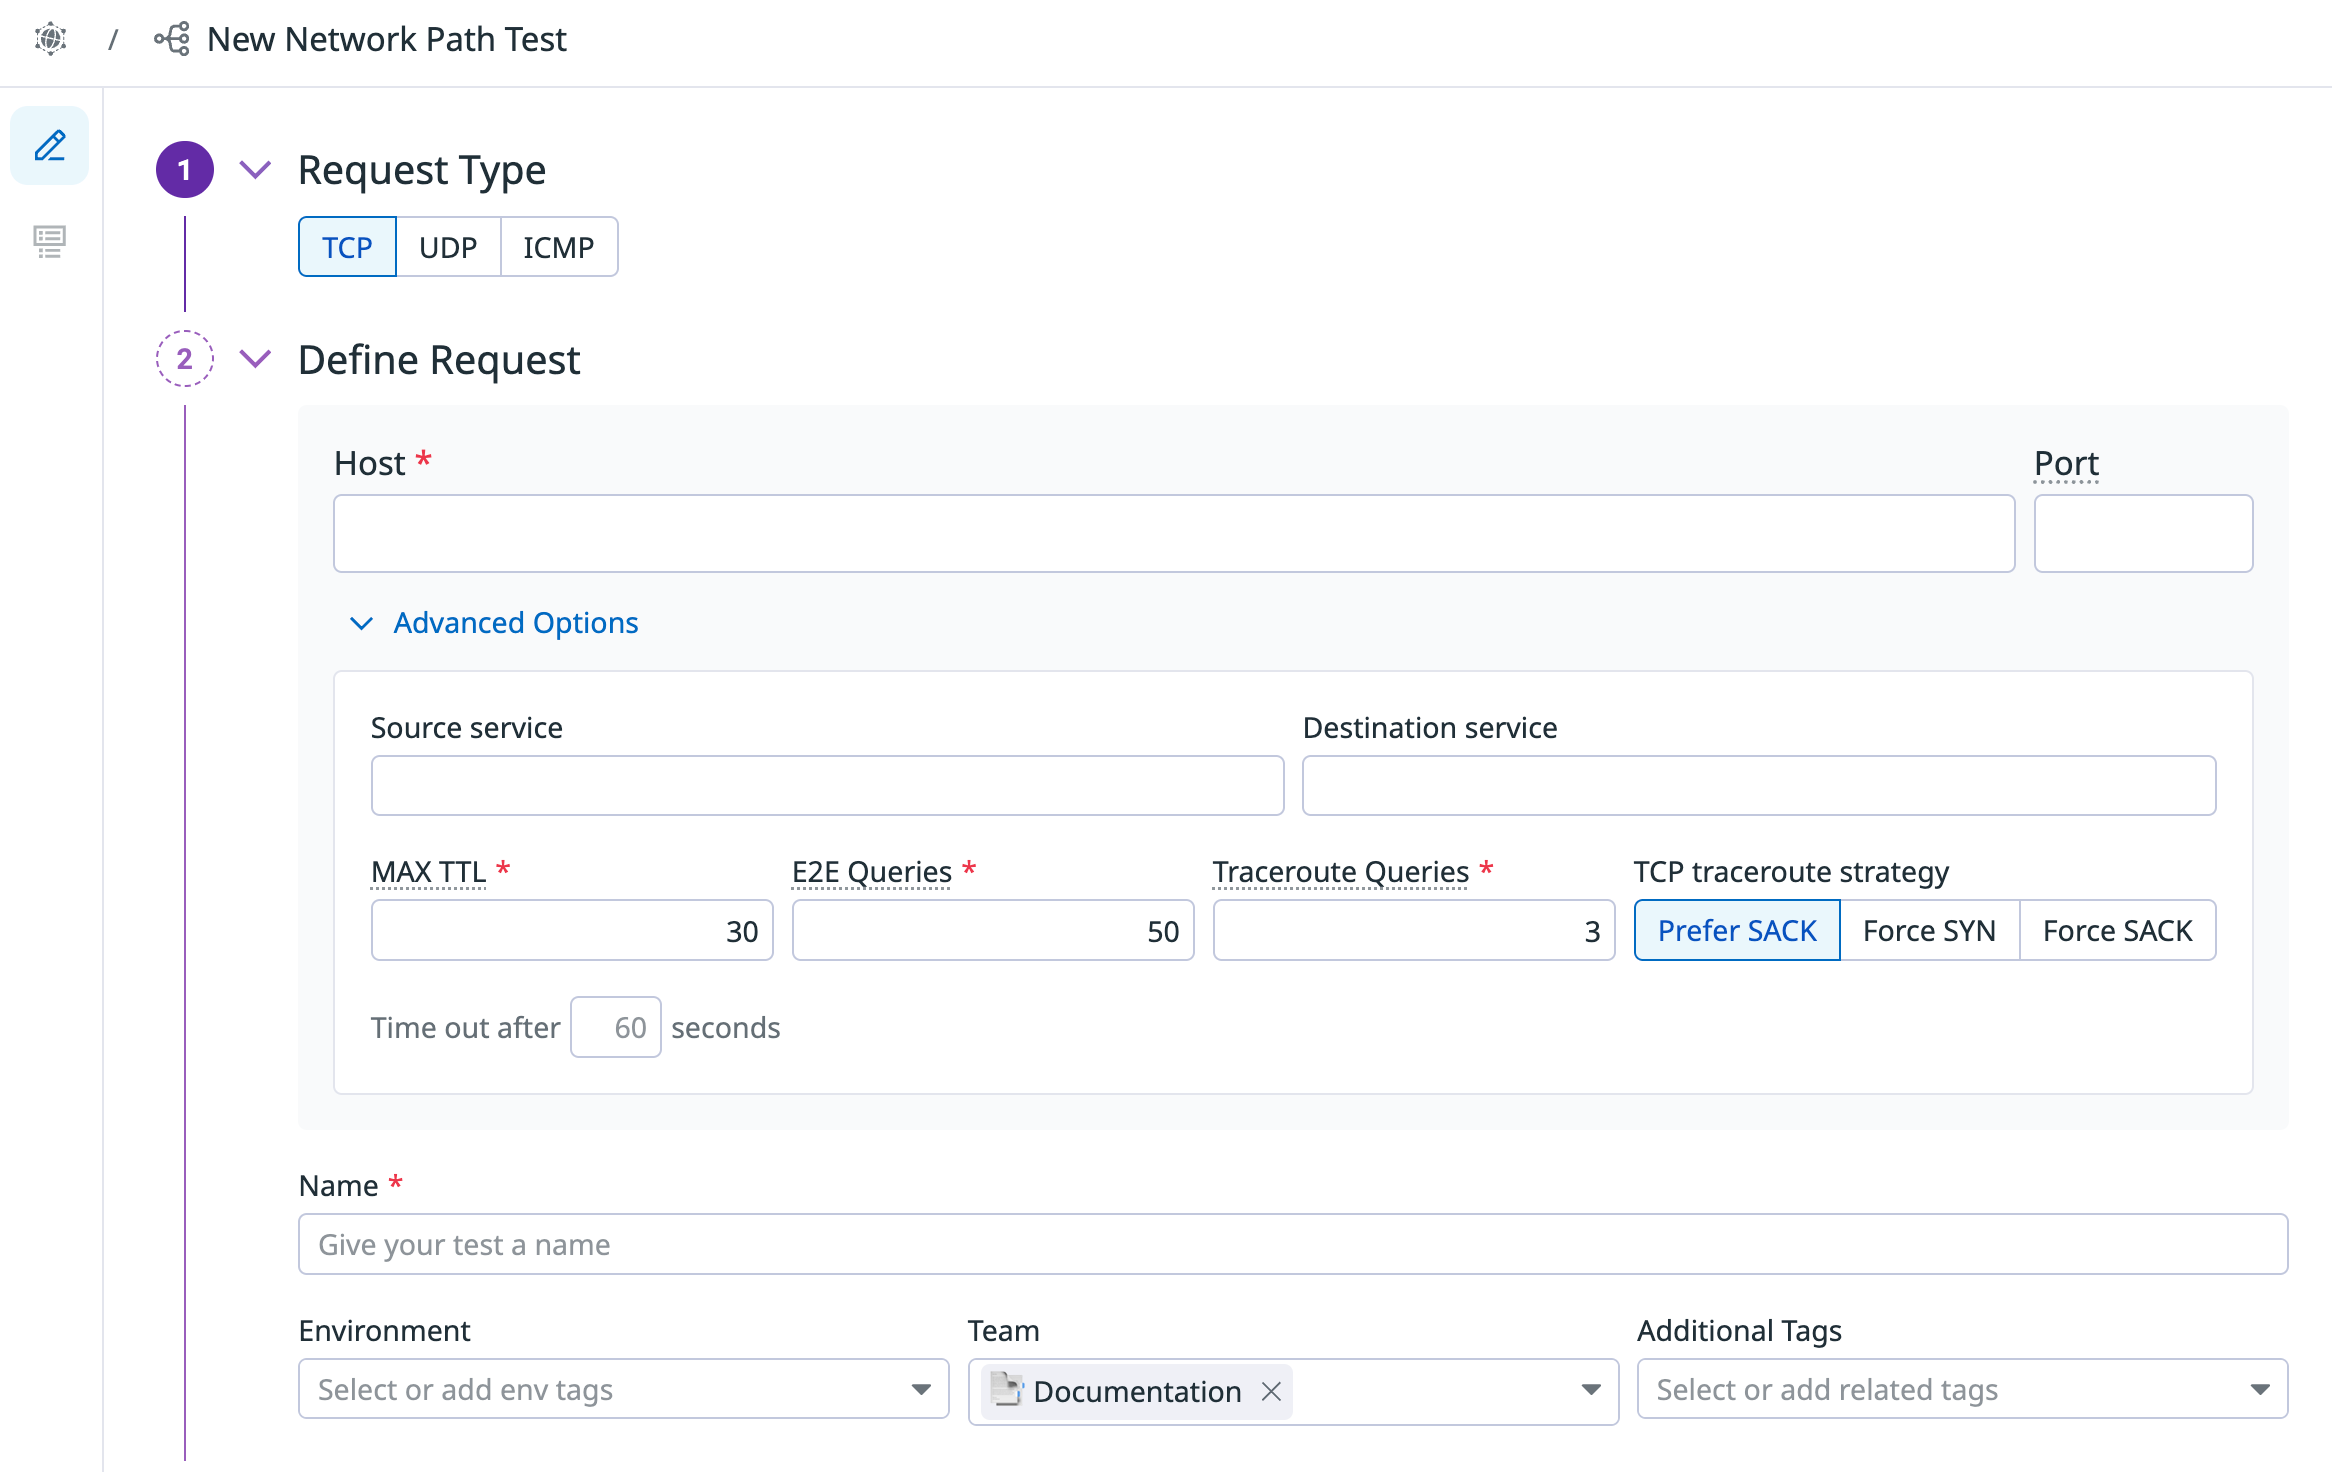
- Choose your request type (TCP, UDP, or ICMP) and specify the host or URL to query. Port information is optional for UDP and ICMP tests.
- Name your test.
- Optional: Configure advanced options:
- Source service: The label displayed for the source host in the Network Path visualization.
- Destination service: The label displayed for the destination host in the Network Path visualization.
- Max Time-to-live: The maximum number of network hops a packet can traverse before being discarded: Maximum time-to-live (maximum number of hops) for outgoing probe packets. Defaults to 30 hops.
- E2E Queries: Number of packets sent to the destination to measure The percentage of data packets that fail to reach their destination, latency, and The variation in latency between consecutive packets. Defaults to 50.
- The mechanism that Network Path uses to determine intermediate hops and latency Queries: Number of traceroute path tracings to perform. Results are aggregated in each test run details panel. Defaults to 3.
- TCP traceroute strategy (TCP tests only): Choose between A TCP option that allows receivers to acknowledge non-contiguous data blocks, improving retransmission efficiency and Synchronize (SYN) traceroute strategies. SACK and Force SACK more closely mimic modern application traffic.
- Optional: Add Tags to your test, including environment tags. Use tags to filter your Synthetic tests on the Synthetic Monitoring & Continuous Testing page.
Define assertions to determine the expected results for your test. At least one assertion is required.
Type Operator 1 Operator 2 Value type latency avg, max, min is,<,<=,>,>=int packet loss is,<,<=,>,>=int (0 to 100) jitter is,<,<=,>,>=float network The number of intermediate network devices (routers, switches) a packet passes through between source and destination avg, max, min is,<,<=,>,>=int Select the locations from which to run your test. You can run Network Path tests from managed locations to test public endpoints, or from a Datadog Agent to test private environments.
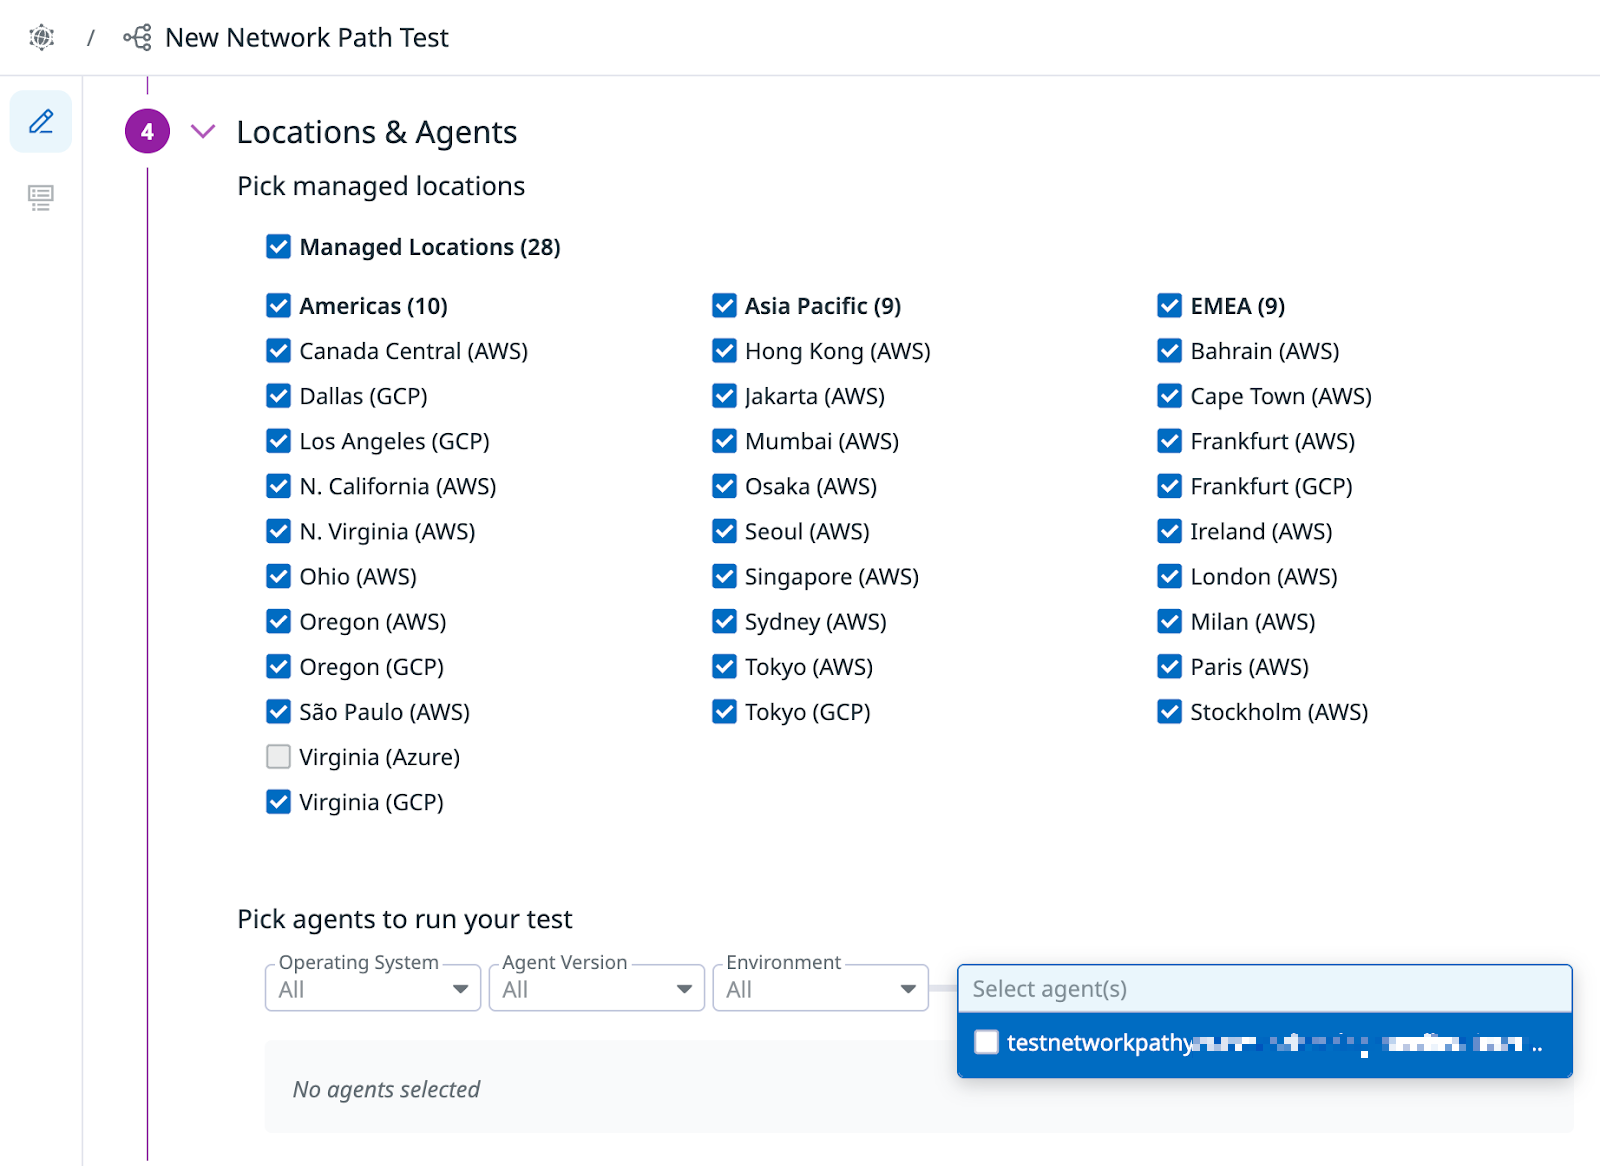
Datadog’s out-of-the-box managed locations allow you to test public-facing websites and endpoints from regions where your customers are located.
AWS:
Americas Asia Pacific EMEA Canada Central Hong Kong Bahrain Northern California Jakarta Cape Town Northern Virginia Mumbai Frankfurt Ohio Osaka Ireland Oregon Seoul London São Paulo Singapore Milan Sydney Paris Tokyo Stockholm GCP:
Americas Asia Pacific EMEA Dallas Tokyo Frankfurt Los Angeles Oregon Virginia The Datadog for Government site (US1-FED) uses the following managed location:
Region Location Americas US-West Azure region is not supported for Network Path tests.Set the test frequency to determine how often Datadog runs your Network Path test. Scheduled tests ensure your most important endpoints remain accessible to your users.
Define alert conditions and configure the test monitor for your Network Path test.
Define alert conditions
Set alert conditions to determine the circumstances under which you want a test to fail and trigger an alert.
Alerting rule
When you set the alert conditions to: An alert is triggered if any assertion fails for X minutes from any n of N locations, an alert is triggered only if these two conditions are true:
- At least one location was in failure (at least one assertion failed) during the last X minutes;
- At one moment during the last X minutes, at least n locations were in failure.
For more information on how Synthetic Monitoring notifications evaluate test results and trigger alerts, see Understanding Synthetic Monitor Alerting.
Configure the test monitor
A notification is sent by your test based on the alerting conditions previously defined. Use this section to define how and what to message your team.
Similar to how you configure monitors, select users and/or services that should receive notifications either by adding an
@notificationto the message or by searching for team members and connected integrations with the dropdown menu.Enter the notification message for your test or use pre-filled monitor messages. This field allows standard Markdown formatting and supports the following conditional variables:
| Conditional Variable | Description |
|---|---|
{{#is_alert}} | Show when the test alerts. |
{{^is_alert}} | Show unless the test alerts. |
{{#is_recovery}} | Show when the test recovers from alert. |
{{^is_recovery}} | Show unless the test recovers from alert. |
{{#is_renotify}} | Show when the monitor renotifies. |
{{^is_renotify}} | Show unless the monitor renotifies. |
{{#is_priority}} | Show when the monitor matches priority (P1 to P5). |
{{^is_priority}} | Show unless the monitor matches priority (P1 to P5). |
Notification messages include the message defined in this section and information about the failing locations. Pre-filled monitor messages are included in the message body section:
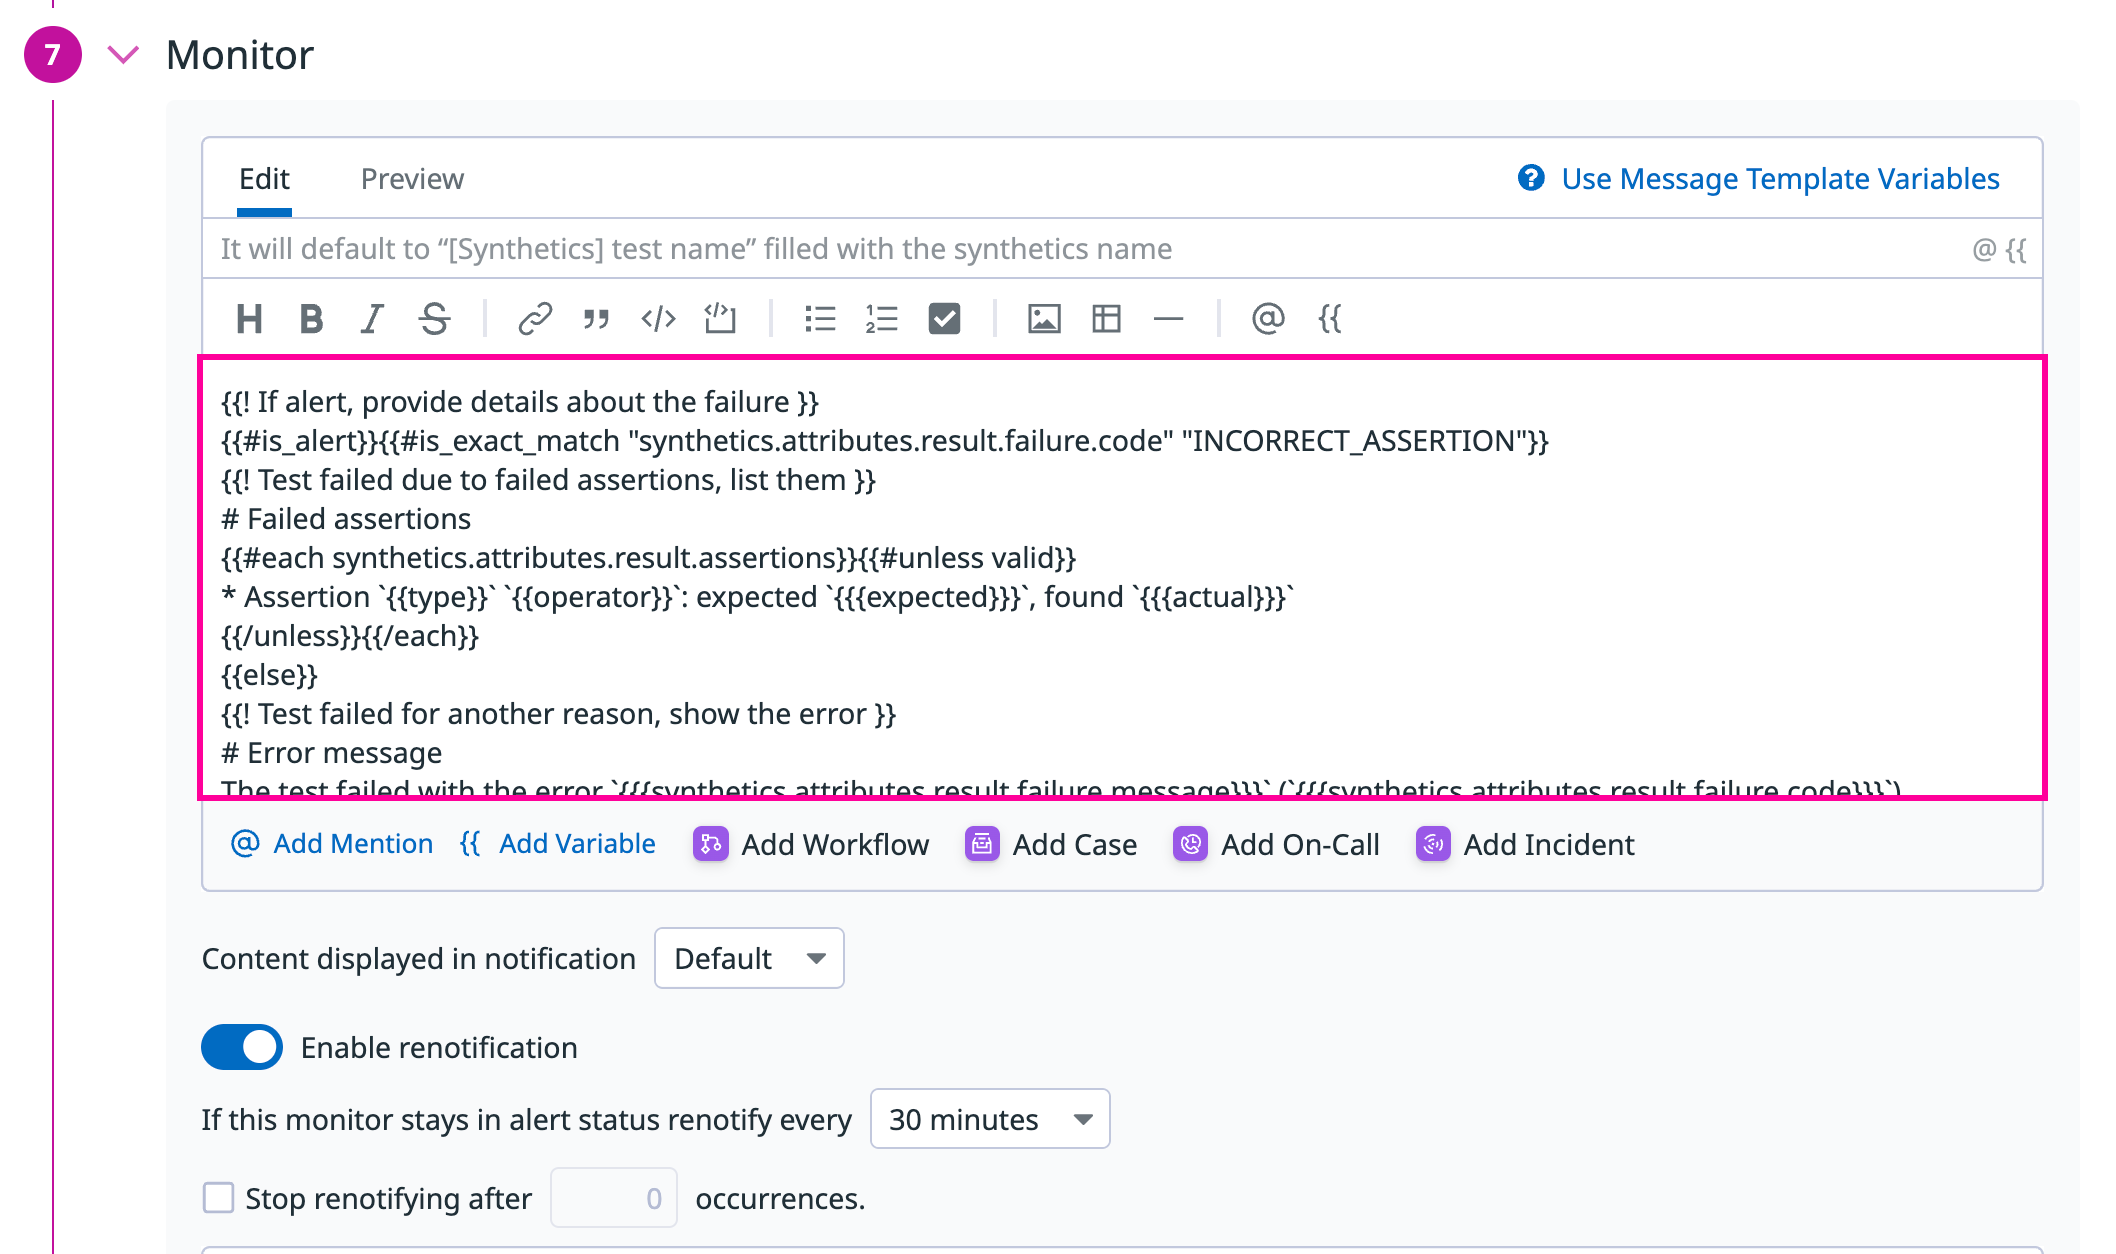
Specify how often you want your test to re-send the notification message in case of test failure. To prevent renotification on failing tests, check the option
Stop re-notifying on X occurrences.Click Save Test to save your Network Path test configuration and monitor.
For more information, see Synthetic Monitoring notifications.
Agent configuration
Network Path testing with the Datadog Agent is not supported for this Datadog site ().
Prerequisites
Requires Agent version 7.72 or higher.
Setup
Enable the system-probe traceroute module in /etc/datadog-agent/system-probe.yaml by adding the following:
traceroute:
  enabled: true
Enable the Agent Synthetics Collector in /etc/datadog-agent/datadog.yaml by adding the following:
synthetics:
  collector:
    enabled: true
Ensure the API key used for the Datadog Agent has Remote Configuration enabled. All newly created API keys have Remote Configuration enabled by default.
Restart the Agent for it to appear in the list of available test locations.
sudo systemctl restart datadog-agentNote: Network Path tests cannot be run directly from private locations. However, you can run them from any host or device where the Datadog Agent is installed, including hosts that also act as private locations for Synthetic Monitoring tests.
To test network conditions inside private environments, install the Datadog Agent on the host or device, and run Network Path tests from that Agent. For full end-to-end visibility, you can group the application tests running from private locations, and Network Path tests running from the Datadog Agent on the same host, into a single test suite. This provides a unified view of your service, feature, and application health across all layers affecting user experience.
View test results
Click on a Network Path test on the Synthetic Tests page to view the Test Details page, which displays comprehensive information about your test:
- Test properties and configuration
- Test history
- Individual test runs
- Aggregated Network Path visualizations across all test runs
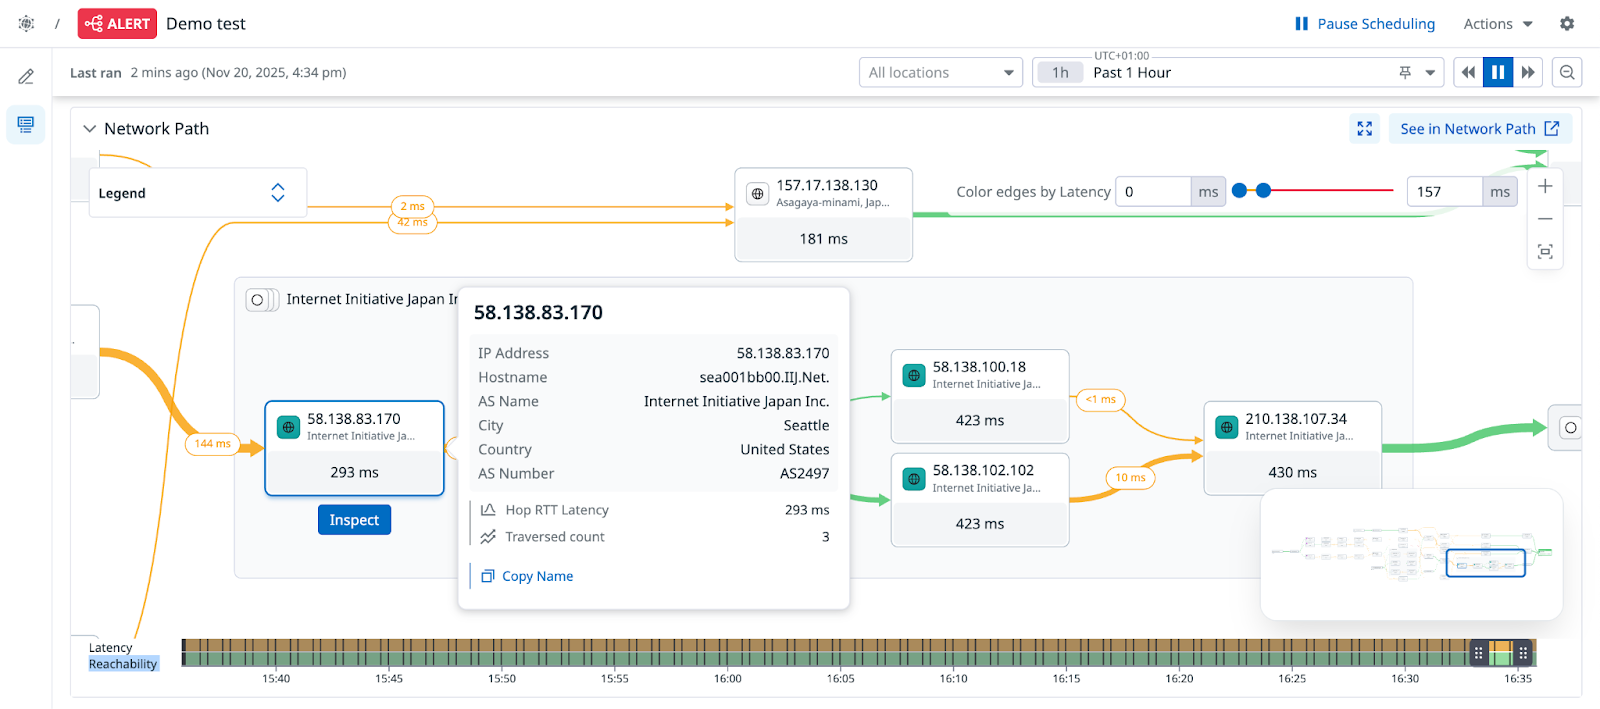
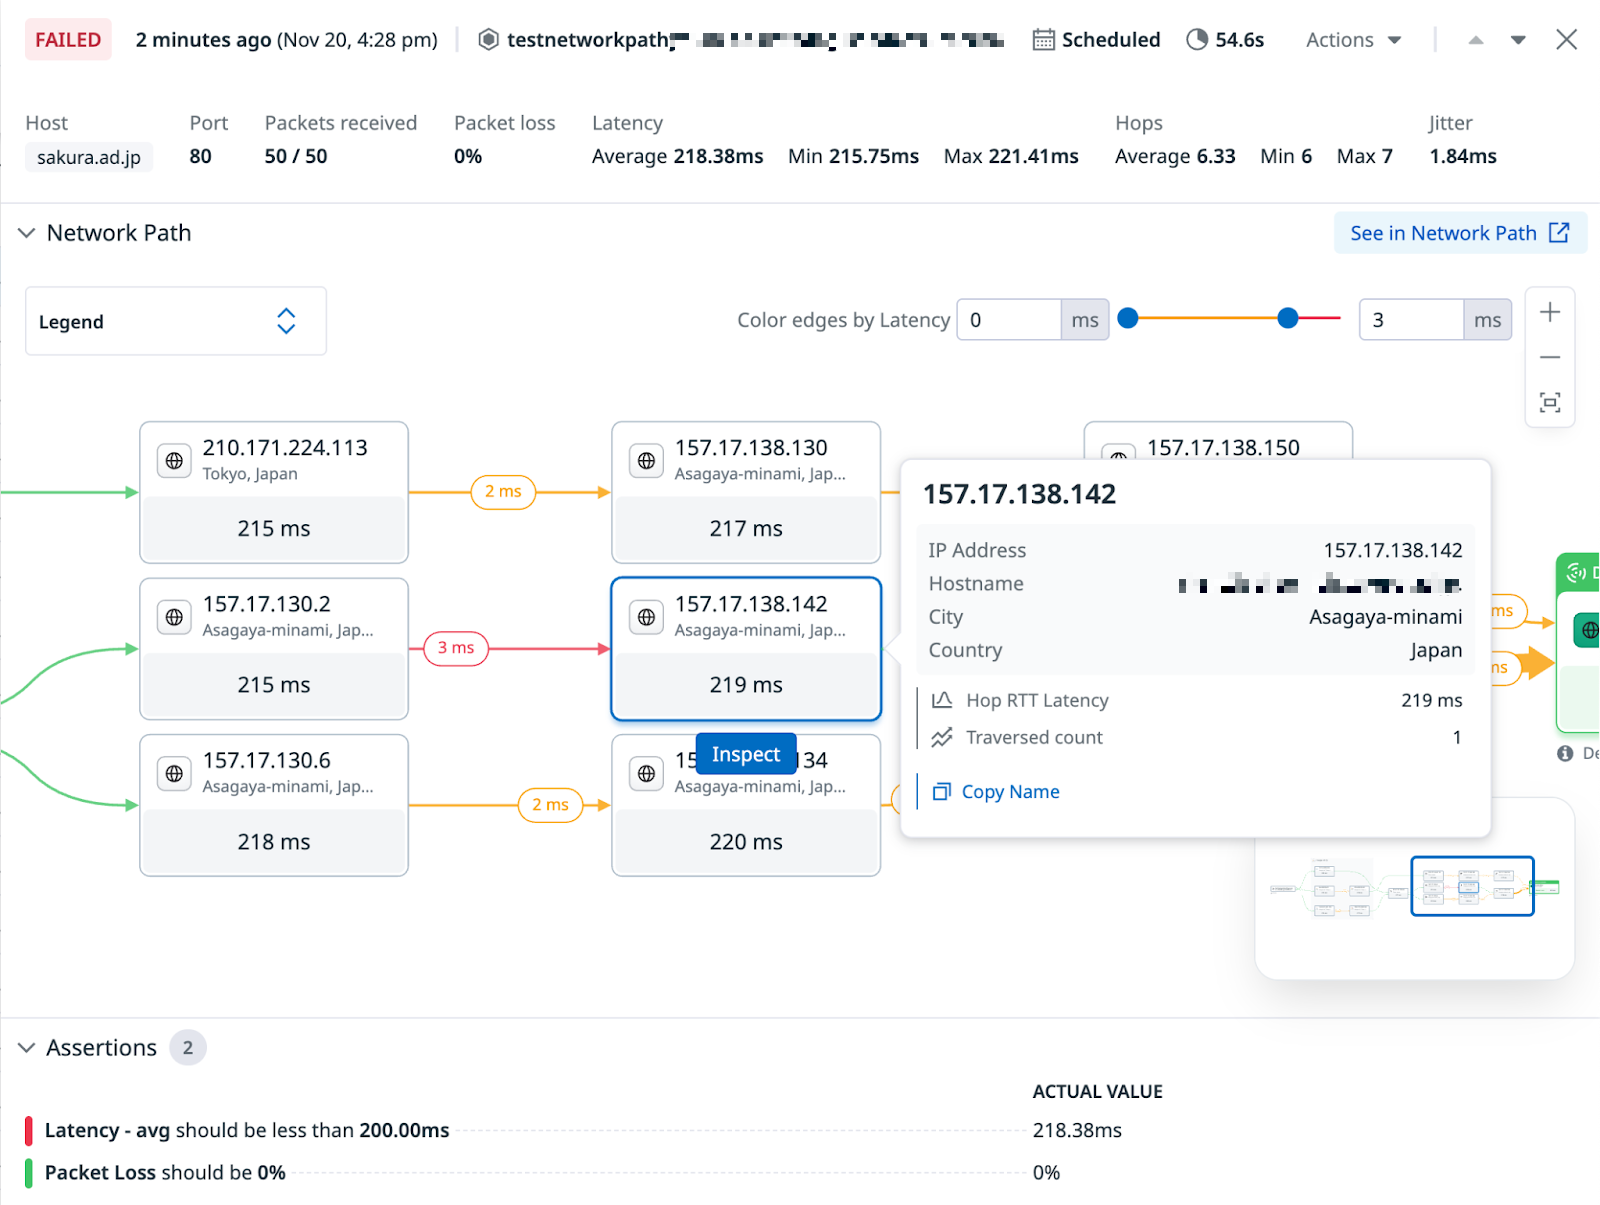
The Network Path visualization shows the routes packets take to complete queries during each test run. Drag the health bar handles to adjust the time frame and view a snapshot of end-to-end latency and packet loss for a specific time interval. For more information about how Network Path visualizations are built, see the Network Path documentation.
Changing the health bar does not affect the global time range at the top of the page.
Click on a test run in the table at the bottom of the page to view details for that specific run. The side panel displays:
Run information
Network Path visualization, aggregated across all traceroute queries (based on your tests advanced options)
Assertion results, aggregated across all end-to-end queries (based on your tests advanced options)
Retention
Network Path Testing data is retained for 30 days.
Understanding Network Path tests
Network Path tests use the same underlying functionality in both Network Path and Synthetic Monitoring, so tests created in one UI are visible in the other.
Capabilities:
- Unified test creation: You can create Network Path tests from either the Network Path UI or the Synthetic Monitoring UI. Both entry points use the same underlying functionality.
- UI-based test creation: You can create Network Path tests directly from the Synthetic Monitoring UI with additional assertions on network data such as packet loss, latency, jitter, and number of hops.
- Proactive monitoring: Group browser, API, and Network Path tests in test suites to monitor how network performance impacts application performance.
Further Reading
Documentation, liens et articles supplémentaires utiles:
