- 重要な情報
- はじめに
- 用語集
- Standard Attributes
- ガイド
- インテグレーション
- エージェント
- OpenTelemetry
- 開発者
- Administrator's Guide
- API
- Partners
- DDSQL Reference
- モバイルアプリケーション
- CoScreen
- CoTerm
- Remote Configuration
- Cloudcraft
- アプリ内
- ダッシュボード
- ノートブック
- DDSQL Editor
- Reference Tables
- Sheets
- Watchdog
- アラート設定
- メトリクス
- Bits AI
- Internal Developer Portal
- Error Tracking
- Change Tracking
- Service Management
- Actions & Remediations
- インフラストラクチャー
- Cloudcraft
- Resource Catalog
- ユニバーサル サービス モニタリング
- Hosts
- コンテナ
- Processes
- サーバーレス
- ネットワークモニタリング
- Cloud Cost
- アプリケーションパフォーマンス
- APM
- Continuous Profiler
- データベース モニタリング
- Data Streams Monitoring
- Data Jobs Monitoring
- Data Observability
- Digital Experience
- RUM & セッションリプレイ
- Synthetic モニタリング
- Continuous Testing
- Product Analytics
- Software Delivery
- CI Visibility (CI/CDの可視化)
- CD Visibility
- Deployment Gates
- Test Visibility
- Code Coverage
- Quality Gates
- DORA Metrics
- Feature Flags
- セキュリティ
- セキュリティの概要
- Cloud SIEM
- Code Security
- クラウド セキュリティ マネジメント
- Application Security Management
- Workload Protection
- Sensitive Data Scanner
- AI Observability
- ログ管理
- Observability Pipelines(観測データの制御)
- ログ管理
- CloudPrem
- 管理
Automated Analysis
このページは日本語には対応しておりません。随時翻訳に取り組んでいます。
翻訳に関してご質問やご意見ございましたら、お気軽にご連絡ください。
翻訳に関してご質問やご意見ございましたら、お気軽にご連絡ください。
Overview
Automated Analysis automatically detects performance issues in your applications using Continuous Profiler data and provides actionable insights for resolution. When an issue is detected, Automated Analysis provides:
- A high-level summary explaining the issue and why it matters
- Contextual insights from profiling data (for example, affected methods, packages, or processes)
- Recommended next steps to help you resolve the issue
This reduces the profiling expertise needed to identify and resolve performance issues in your applications that might otherwise go unnoticed.
Explore insights
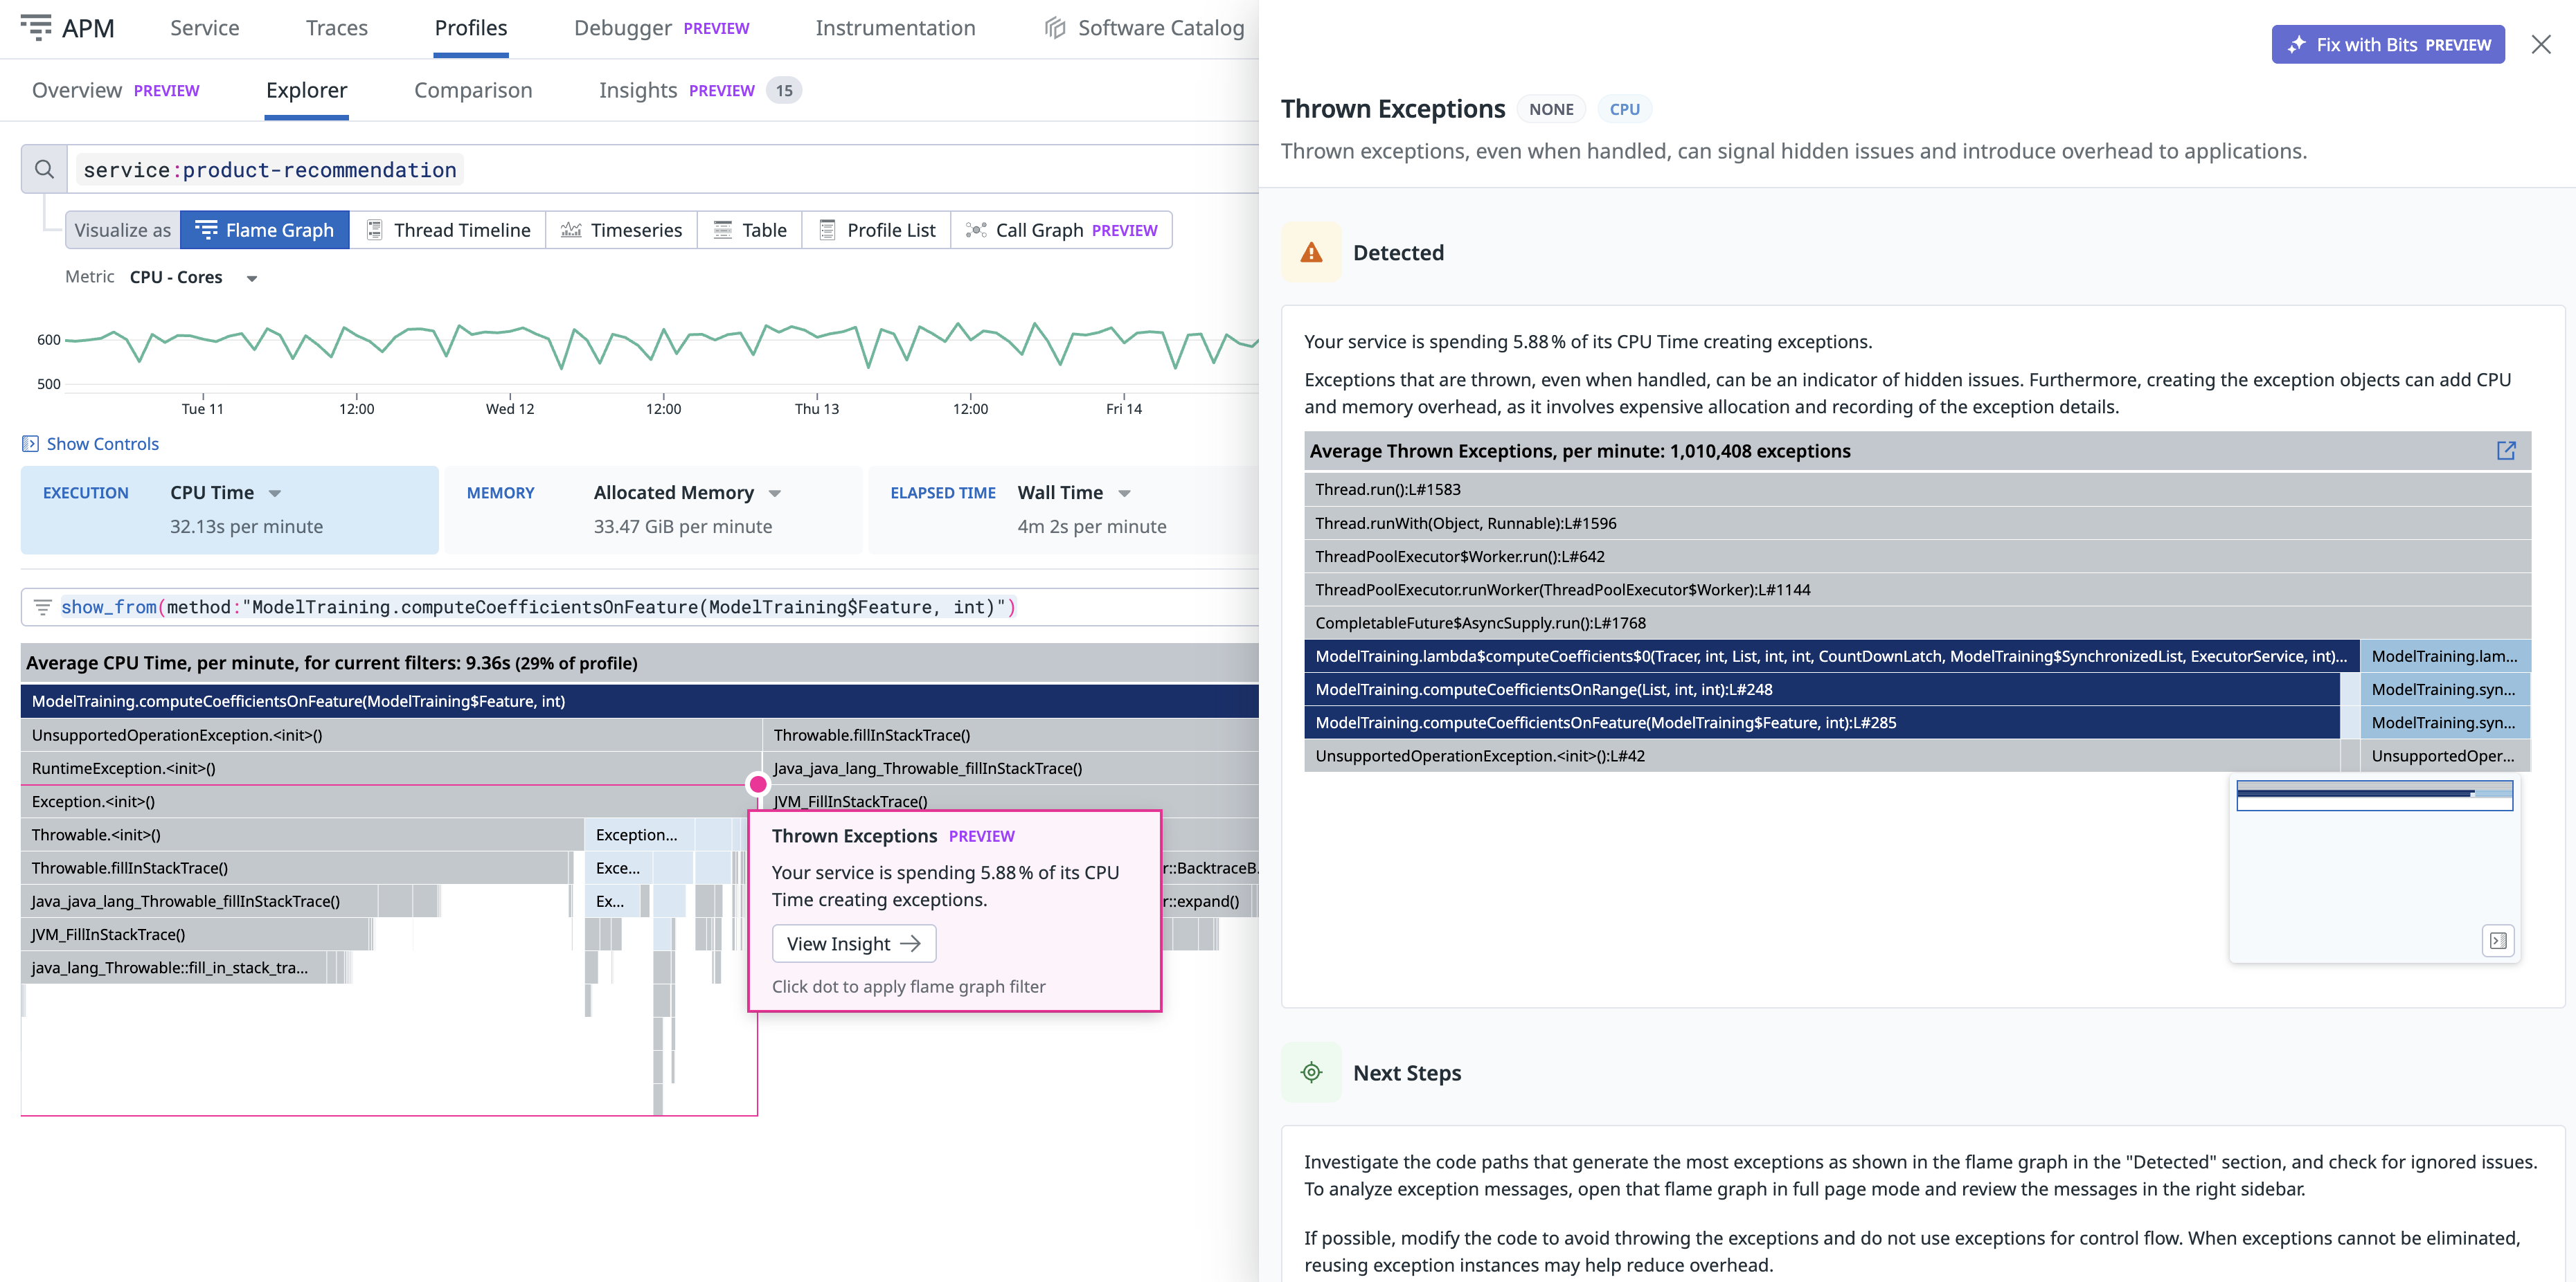
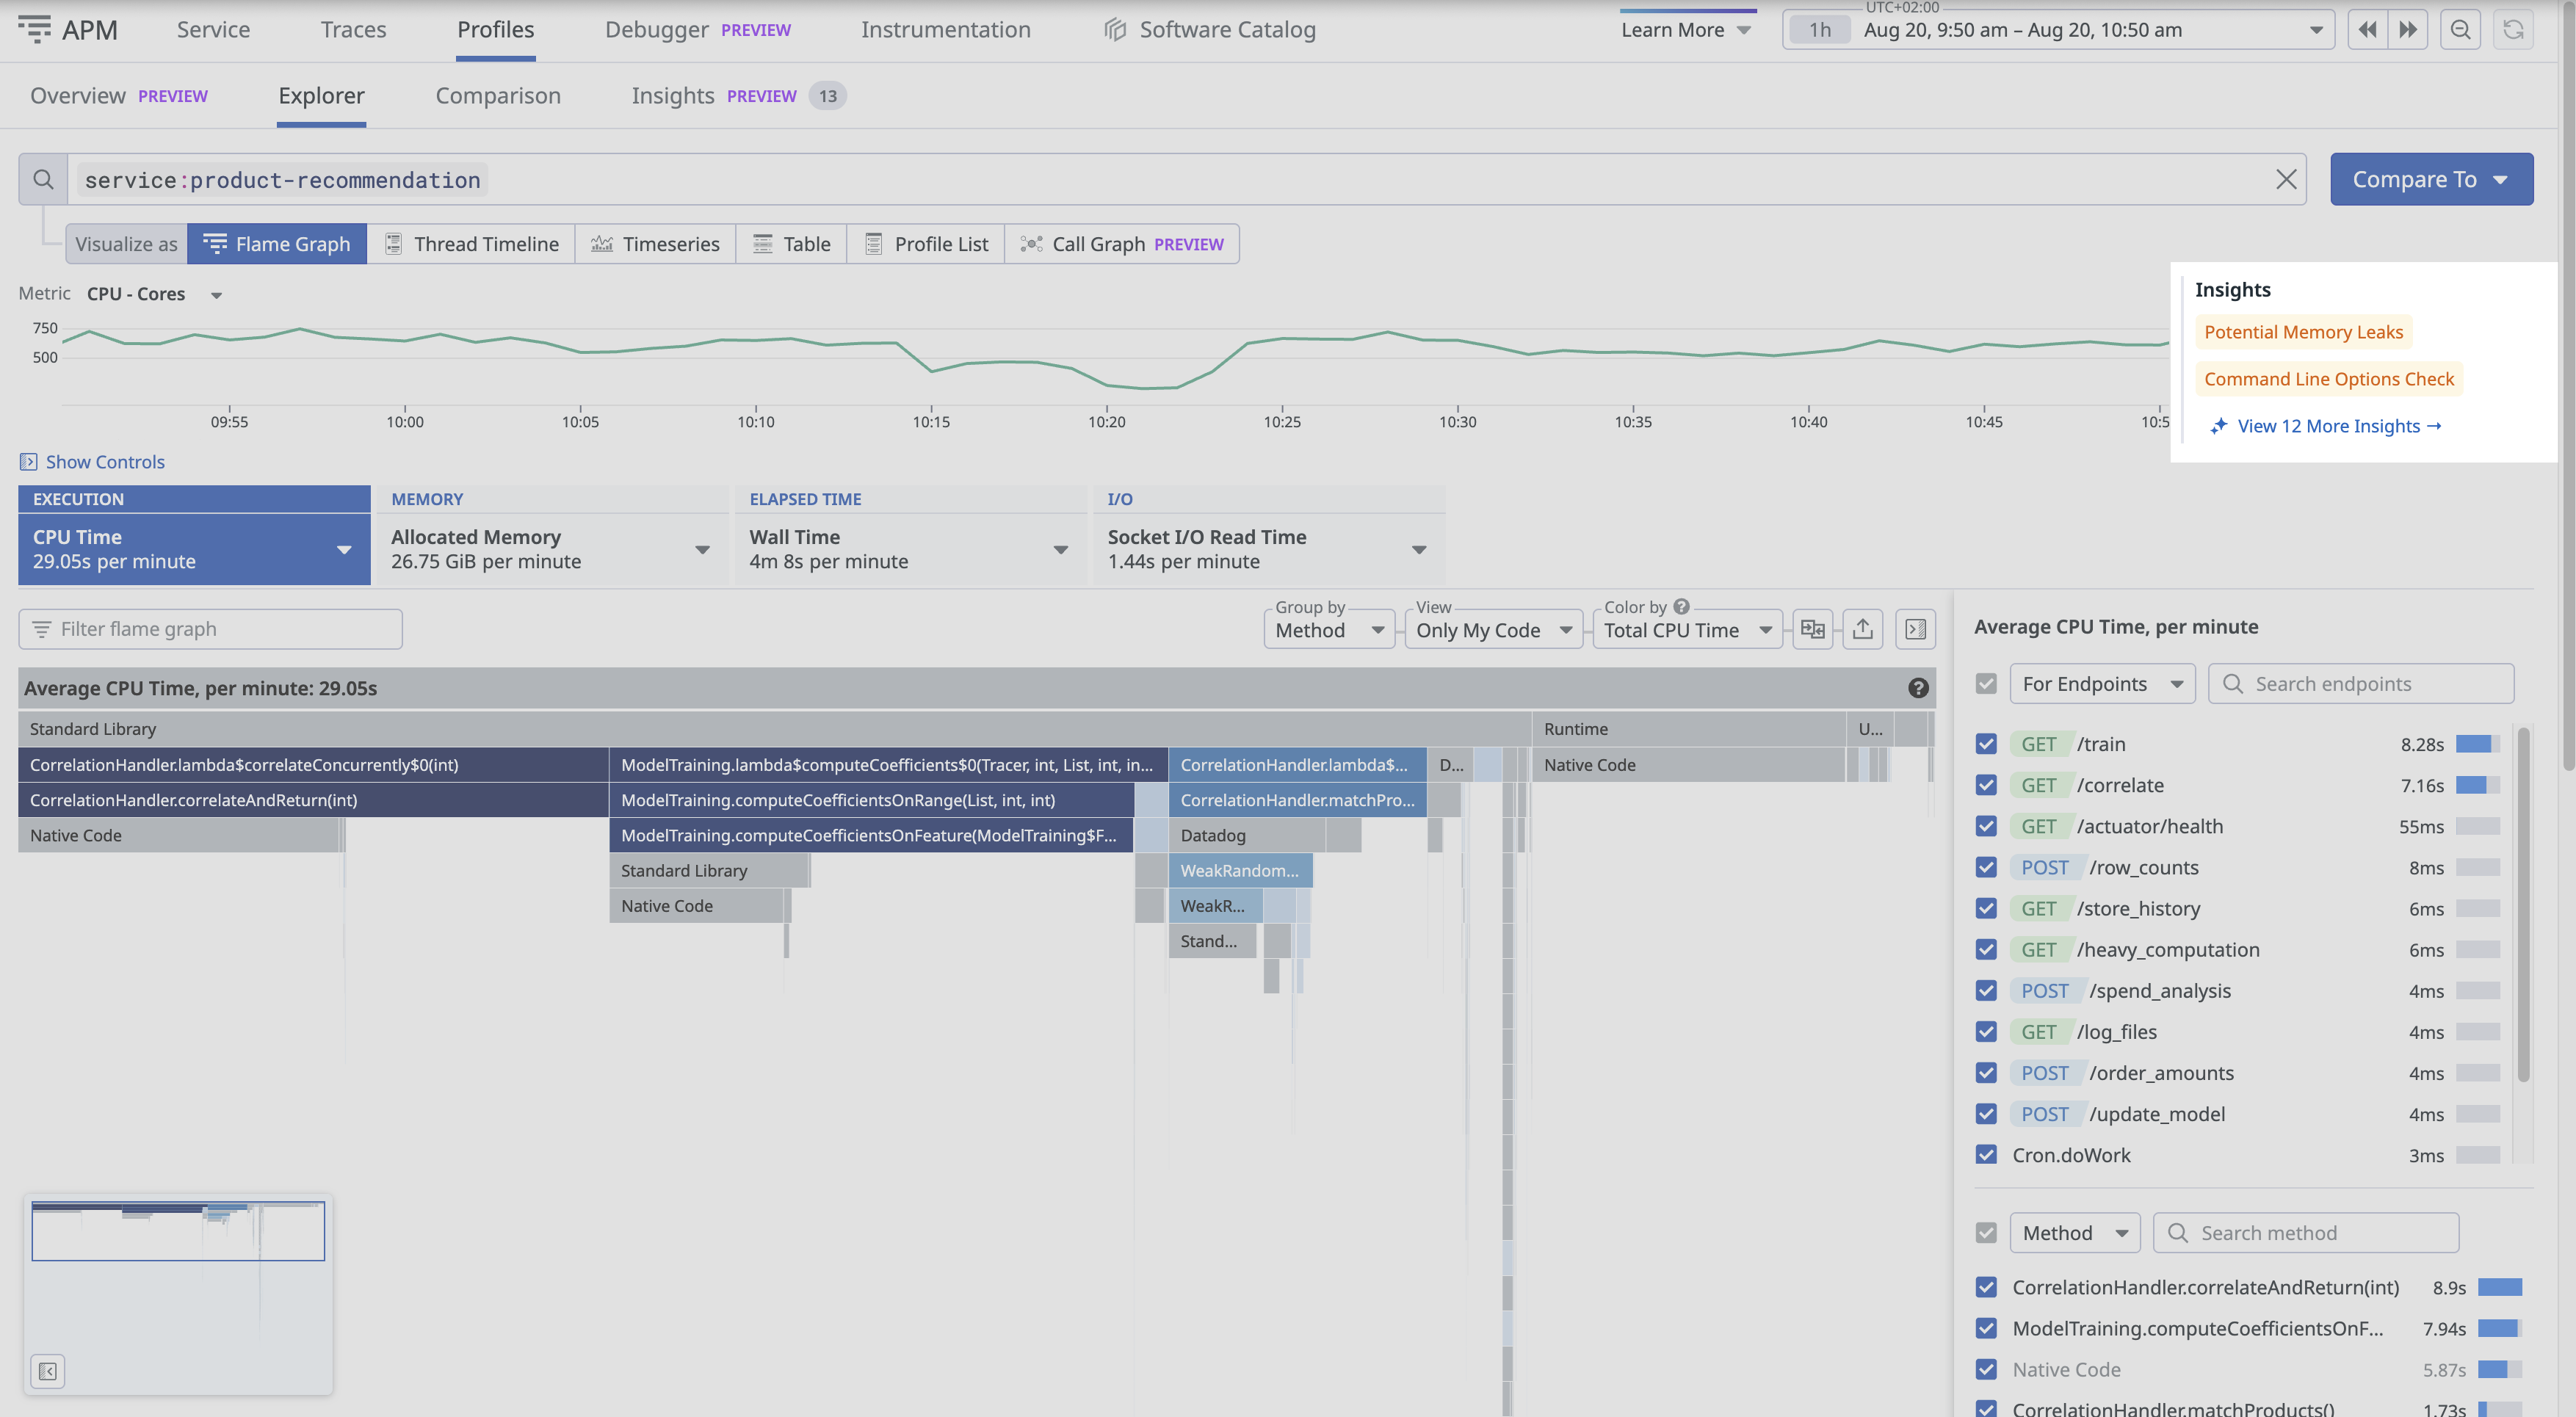
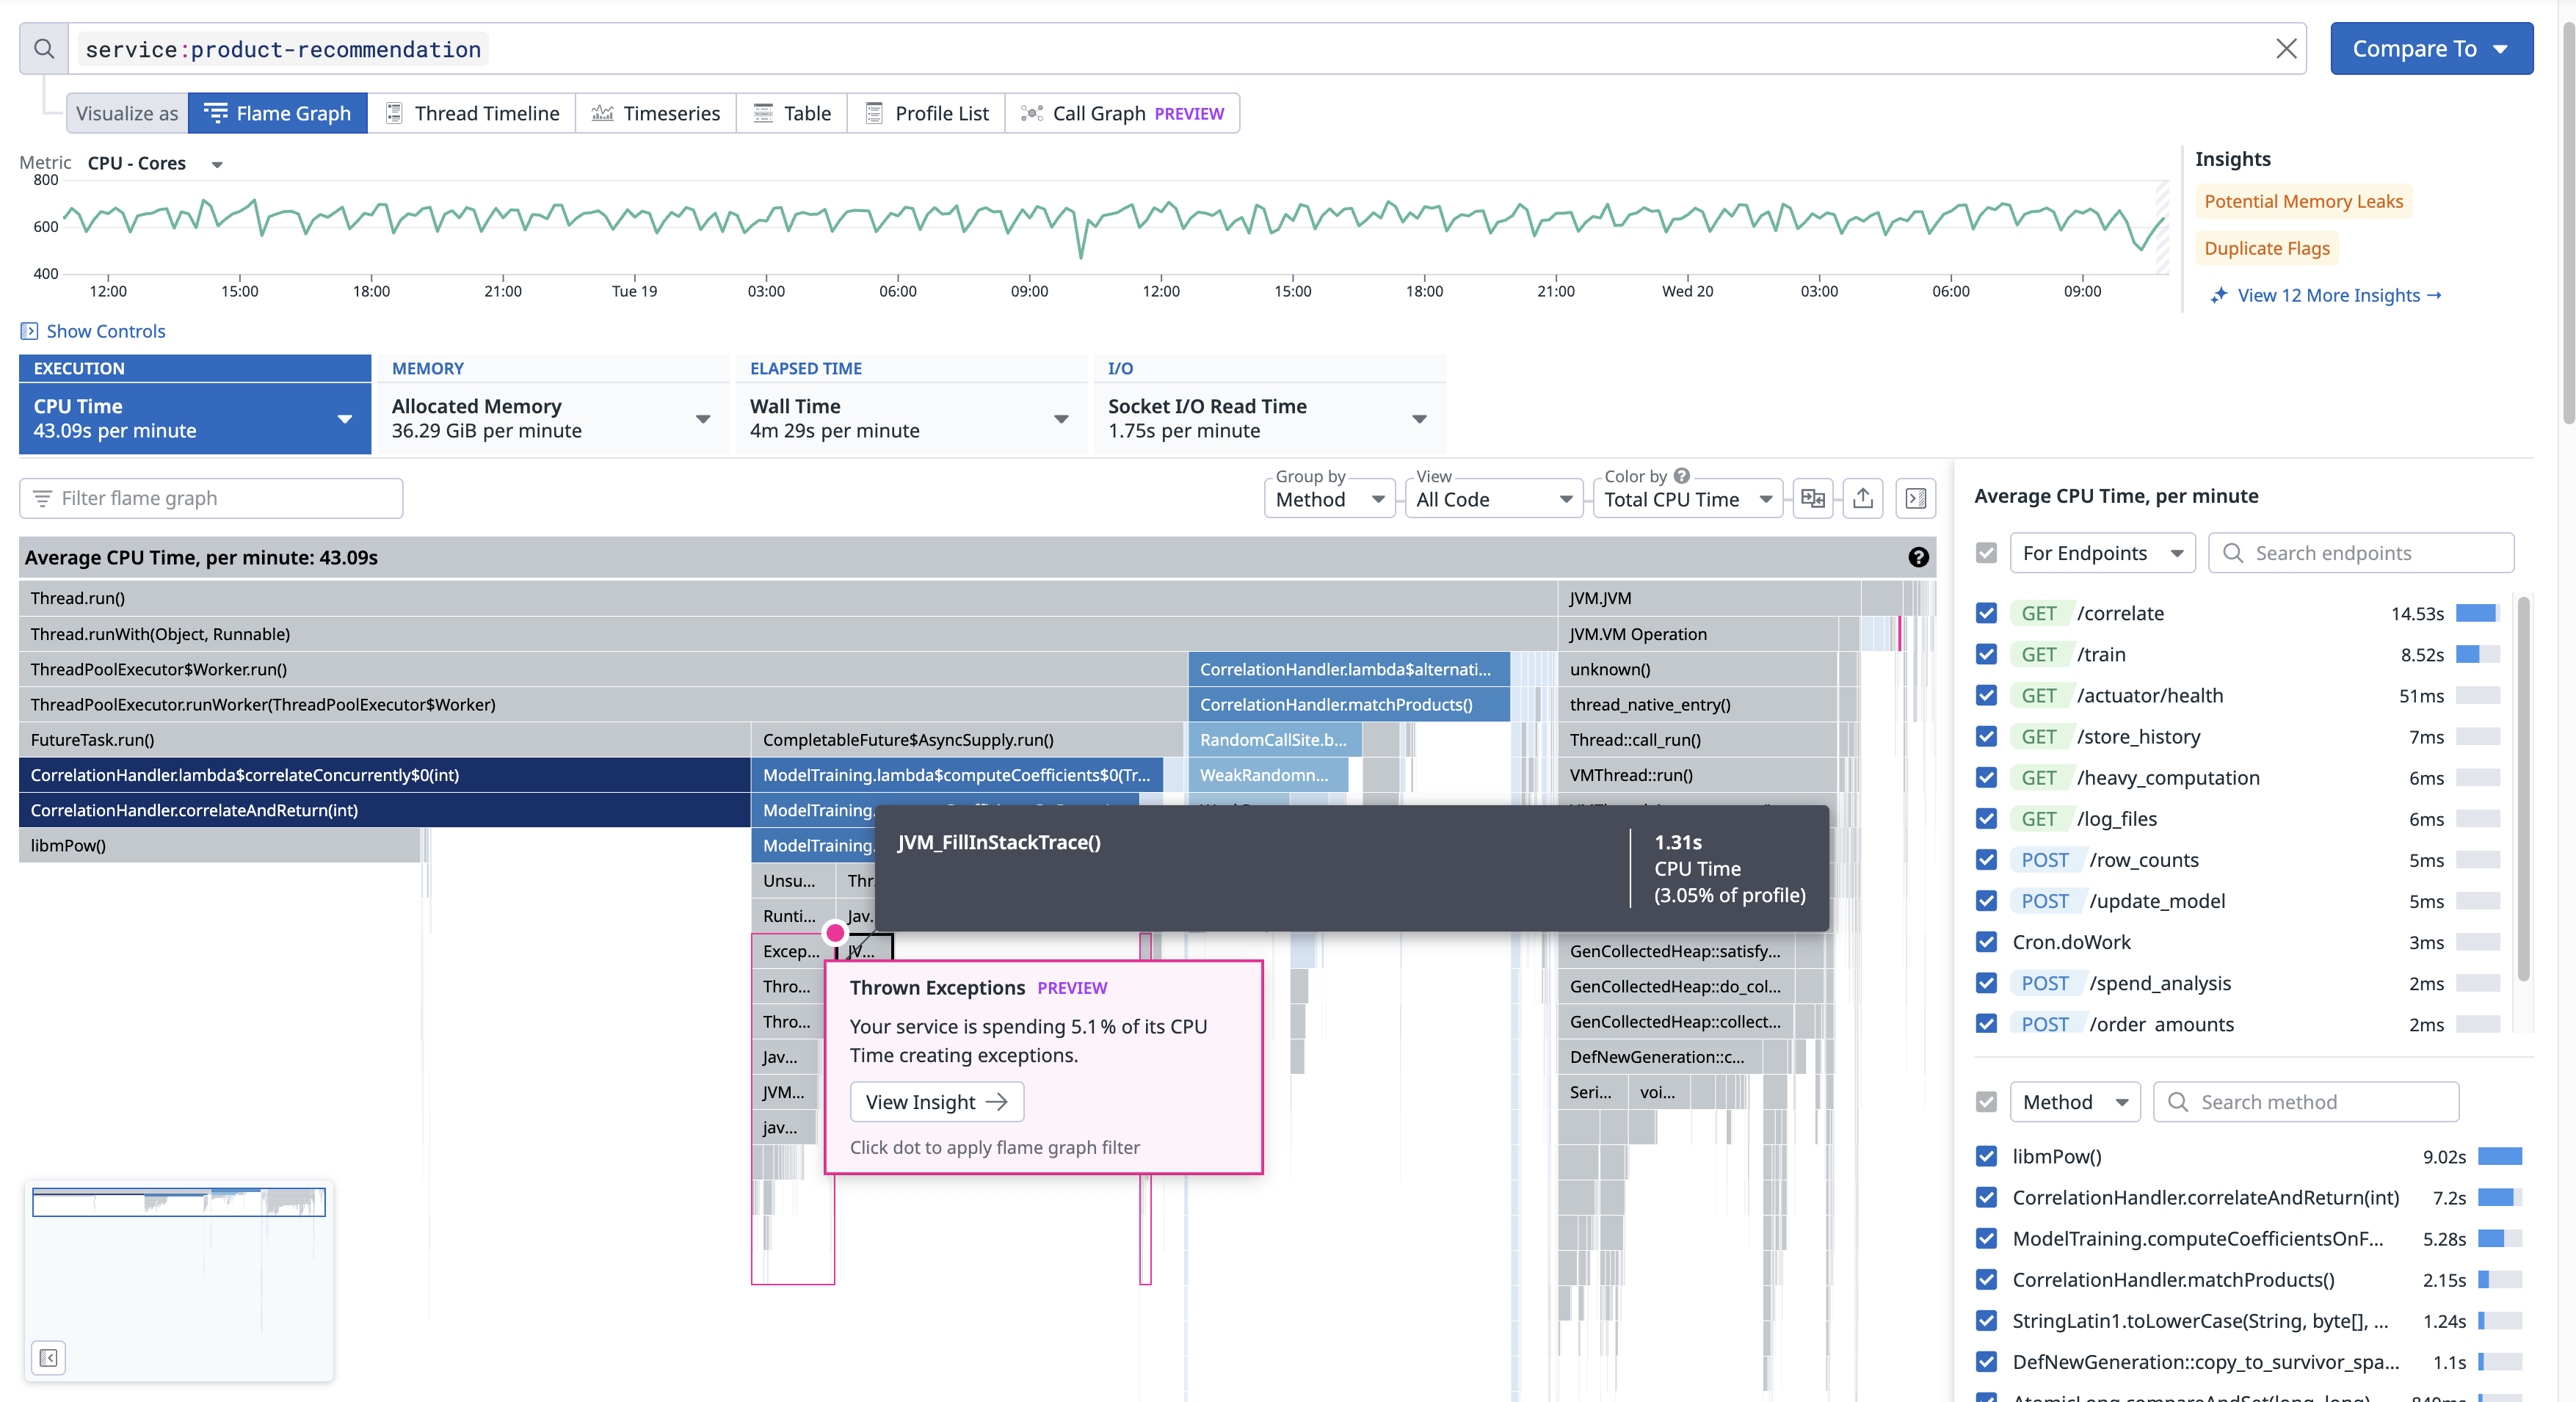
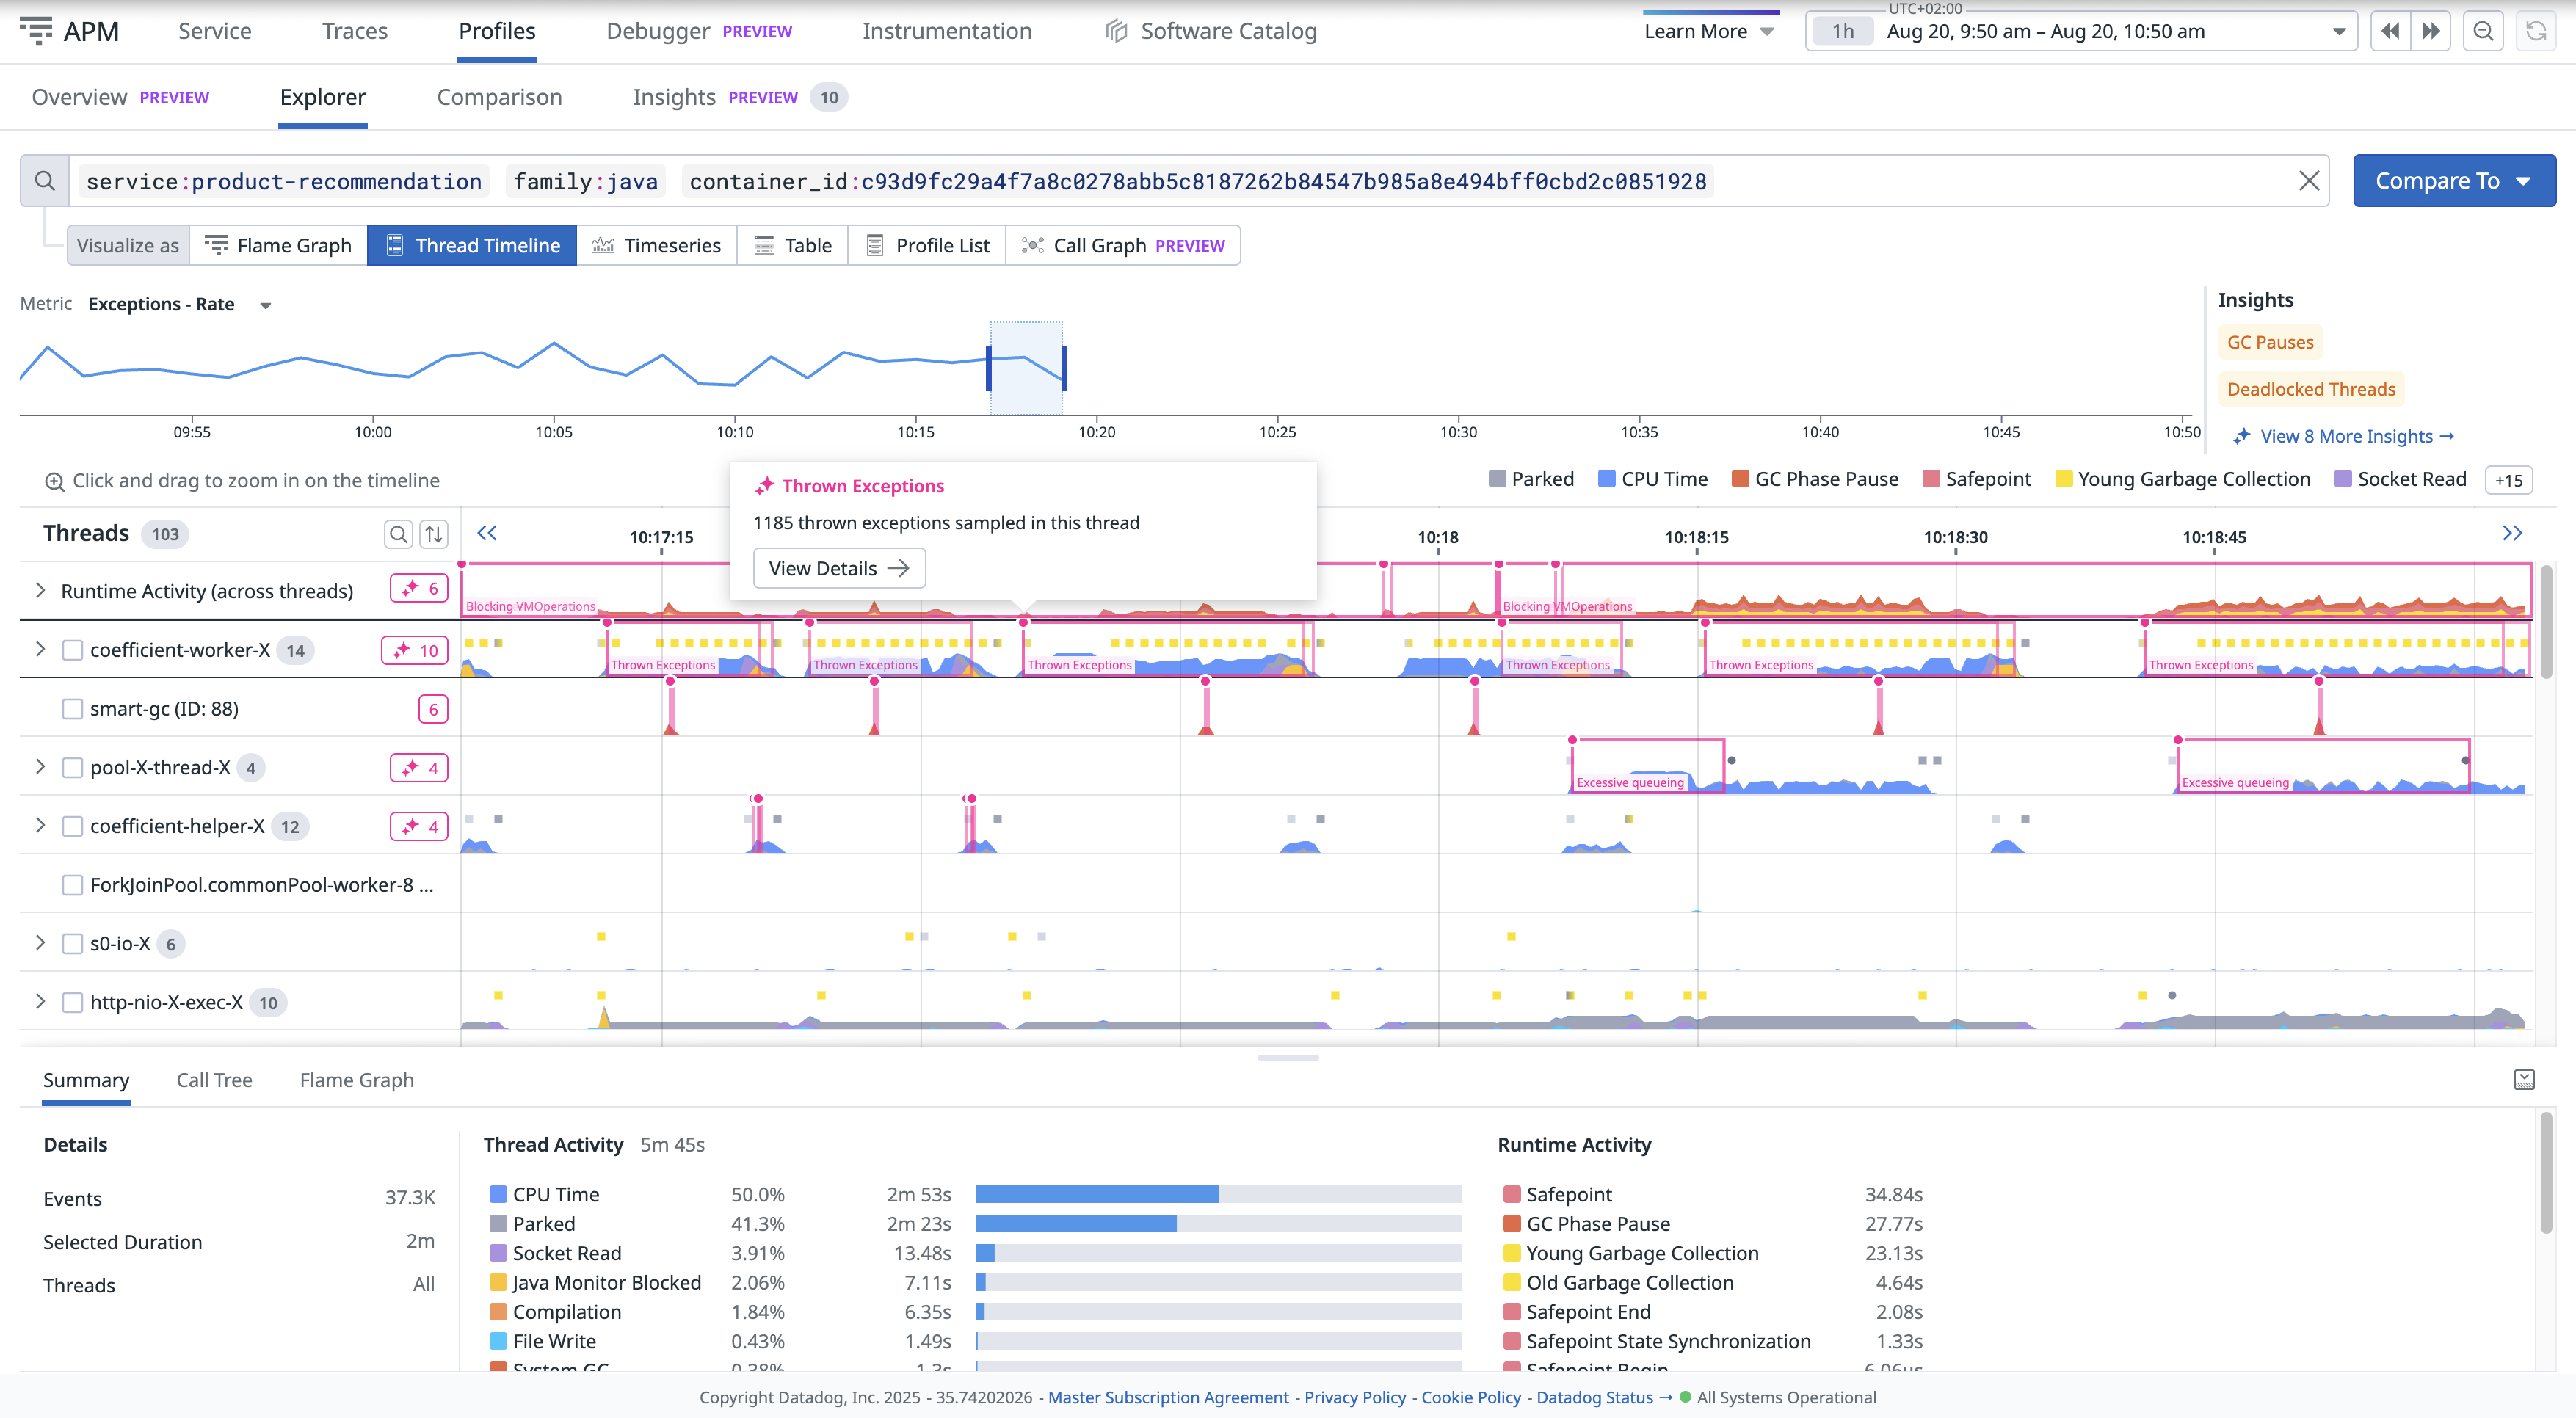
Access Automated Analysis from the Profile explorer. Insights are displayed:
In the Insights section at the top of the page
Within a flame graph view
Within a timeline view
Click an insight to see a high-level summary that explains the issue, contextual insights from profiling data, and recommended next steps.
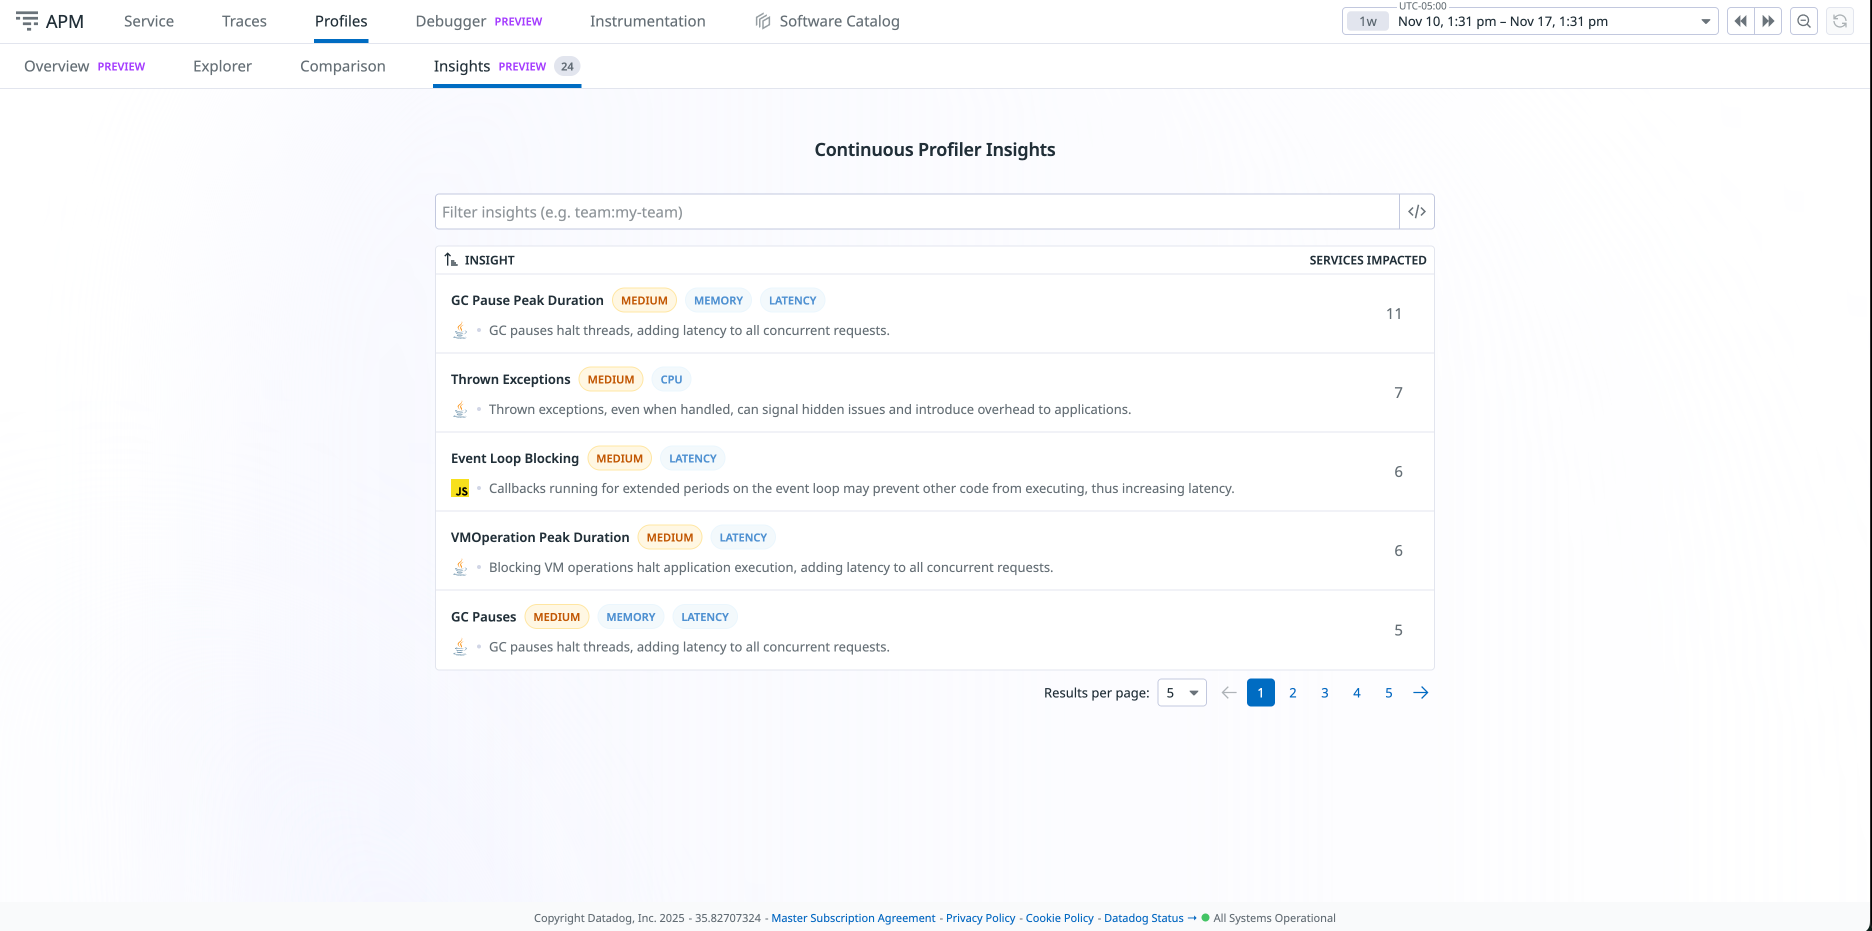
The Insights list page provides a centralized view of all detected issues across your services. It helps teams understand what’s happening in their environments, prioritize what to investigate, and track whether recurring problems are improving over time.
Each row represents an insight type, summarizing:
- Service and runtime affected
- Insight type (for example, GC Pauses or High Lock Contention)
- Priority (high, medium or low)
You can filter insights by insight name, runtime, service, or environment to narrow the list to the most important insights. Teams often use this view to identify patterns, such as multiple services affected by the same inefficiency. Clicking on an insight opens its detail panel.
Supported insights
Automated Analysis supports finding the following insights:
| Name | Priority | Description |
|---|---|---|
| Virtual Thread Pinning | High | Triggers if virtual threads were pinned to their carrier threads for a prolonged time. |
| Virtual Thread Submit Failure | High | Triggers if virtual threads could not be scheduled for execution. |
| Allocation Stall | Medium | Triggers if a thread had to be paused due to insufficient available memory. |
| Blocking VMOperations | Medium | Triggers if blocking VM operations (or combination of operations close in time) take more than 5% of a profile. |
| Code Cache Size | Medium | Triggers if the Code Cache was filled during a profile. |
| CPU Burst | Medium | Triggers if there is more than 75% CPU utilization across a 10s window. |
| CPU Burst Saturation | Medium | Triggers if there is at least 1 second where CPU utilization is at 100%. |
| Deadlocked Threads Detected | Medium | Triggers if max number of deadlocked threads over query context is greater than 0. |
| Explicit GC | Medium | Triggers if there are System.gc() calls. |
| GC Pause Peak Duration | Medium | Triggers if at least one GC pause took more than one second. |
| GC Pauses | Medium | Triggers if more than 10% of time was spent in GC pauses. |
| GC Setup | Medium | Triggers when one of the following is detected: serial GC used on a multi-core machine, parallel GC on a single-core machine, more GC threads configured than available cores, or parallel GC configured to run in one thread. |
| Stackdepth Setting | Medium | Triggers if events were found with truncated stacktraces which may make it hard to understand profiling data. |
| Thrown Exceptions | Medium | Triggers when the rate of thrown (caught and uncaught) exceptions per minute goes above a threshold (defaults to 10K). |
| VMOperation Peak Duration | Medium | Triggers if a blocking VM operation (or combination of operations close in time) takes more than two seconds. Reports details about the operation with the highest duration. |
| VMOperations Ratio | Medium | Triggers if the total amount of blocking VM operations is a significant part of a 60 second window. |
| Command Line Options Check | Low | Triggers if undocumented, deprecated, or non-recommended option flags were detected. |
| Context Switches | Low | Triggers if the rate of context switches on the underlying system is greater than 50k per second. |
| DebugNonSafepoints | Low | Triggers if a service is run with potentially less accurate settings for the profiler. |
| Duplicated Flags | Low | Triggers if duplicate flags were provided to the runtime (for example, -Xmx2g -Xmx5g). This is a problem as it may lead to changes not having the expected effect. |
| GC Overhead | Low | Triggers if more than 20% of CPU time is related to GC activities or allocation overhead. |
| Head of line blocking | Low | Triggers if a queue event gets stuck behind the given activity. |
| High Lock Contention | Low | Triggers if there is a high ratio of time waiting on locks to time spent on-CPU. |
| Primitive Value Boxing | Low | Triggers if more than 5% of CPU time was spent converting values between primitive and object values. |
| Thread Pool Size | Low | Triggers if a thread pool is CPU-bound but is set to a size larger than the number of available cores. |
| Unbalanced Parallelism | Low | Triggers if at least one peer thread is performing less than half the work of another in the same span. |
| Name | Priority | Description |
|---|---|---|
| High Lock Contention | Low | Triggers if there is a high ratio of time waiting on locks to time spent on-CPU. |
| Name | Priority | Description |
|---|---|---|
| GC Overhead | Low | Triggers if more than 20% of CPU time is related to GC activities or allocation overhead. |
| High Lock Contention | Low | Triggers if there is a high ratio of time waiting on locks to time spent on-CPU. |
| Name | Priority | Description |
|---|---|---|
| GC Overhead | Low | Triggers if more than 20% of CPU time is related to GC activities or allocation overhead. |
| Name | Priority | Description |
|---|---|---|
| CPU Burst | Medium | Triggers if there is more than 75% CPU utilization across a 10s window. |
| CPU Starvation | High | Triggers if no CPU samples were captured for at least 100ms. |
| Event Loop Blocking | Medium | Triggers if callbacks were running for an extended period of time on the Main Event Loop thread. |
| GC Overhead | Low | Triggers if more than 20% of CPU time is related to GC activities or allocation overhead. |
| Libuv Pool Overload | Low | Triggers if there were more concurrent tasks scheduled to run on the libuv thread pool than it has threads. |
| Name | Priority | Description |
|---|---|---|
| Sync-over-Async Blocking | Medium | Triggers if async functions are detected in CPU samples. |
| High Lock Contention | Low | Triggers if there is a high ratio of time waiting on locks to time spent on-CPU. |
| Exception Overhead | Medium | Triggers if an excessive amount of exceptions is thrown. |
| Excessive String Concatenation | Low | Triggers if there is a high ratio of CPU time spent concatenating strings. |
| GC Overhead | Low | Triggers if more than 20% of CPU time is related to GC activities. |
