This product is not supported for your selected
Datadog site. (
).
概要
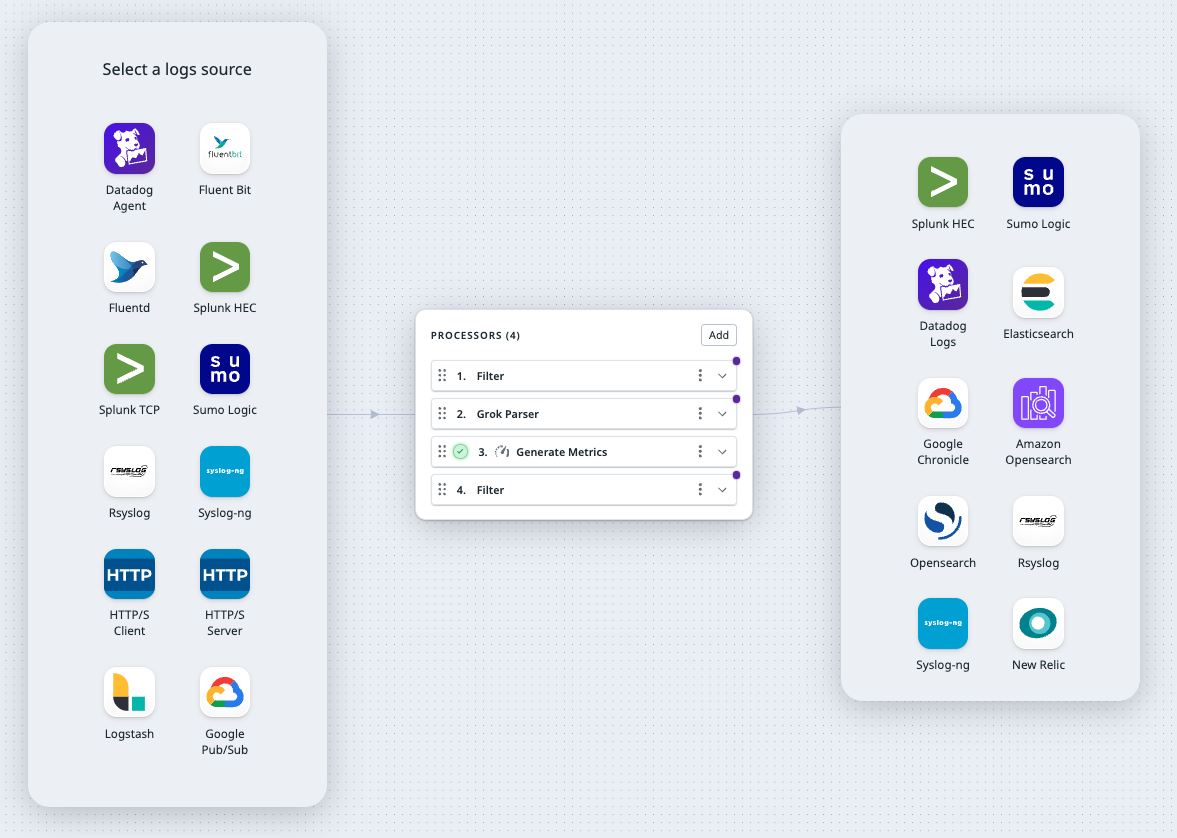
ファイアウォールやネットワークアプライアンスなど、一部のログソースは、必ずしも保存する必要のないデータを含む、大量のログイベントを生成します。多くの場合は、ログの概要を把握して過去データと比較できれば十分です。Generate Metrics テンプレートを使用することで、クエリに一致するログに対するカウントメトリクスや、リクエスト処理時間などログ内に含まれる数値データに基づく分布メトリクスを生成できます。このテンプレートには、以下のプロセッサが初期設定として含まれています。
- フィルター: 条件に基づいてログのサブセットのみを送信するためのクエリを追加します。
- Grok Parser: 対応するソース向けの grok パーシングルールやカスタムルールを追加して、ログをパースします。
- Generate metrics: ログまたはその一部に対してメトリクスを生成します。生成可能なメトリクスのタイプについては、メトリクスタイプを参照してください。
メトリクスタイプ
You can generate these types of metrics for your logs. See the Metrics Types and Distributions documentation for more details.
| Metric type | Description | Example |
|---|
| COUNT | Represents the total number of event occurrences in one time interval. This value can be reset to zero, but cannot be decreased. | You want to count the number of logs with status:error. |
| GAUGE | Represents a snapshot of events in one time interval. | You want to measure the latest CPU utilization per host for all logs in the production environment. |
| DISTRIBUTION | Represent the global statistical distribution of a set of values calculated across your entire distributed infrastructure in one time interval. | You want to measure the average time it takes for an API call to be made. |