To use Observability Pipelines’ HTTP/S Client source, you need the following information available:
The full path of the HTTP Server endpoint that the Observability Pipelines Worker collects log events from. For example, https://127.0.0.8/logs.
The HTTP authentication token or password.
The HTTP/S Client source pulls data from your upstream HTTP server. Your HTTP server must support GET requests for the HTTP Client endpoint URL that you set as an environment variable when you install the Worker.
Sensitive Data Redactions テンプレートを選択し、新しいパイプラインを作成します。
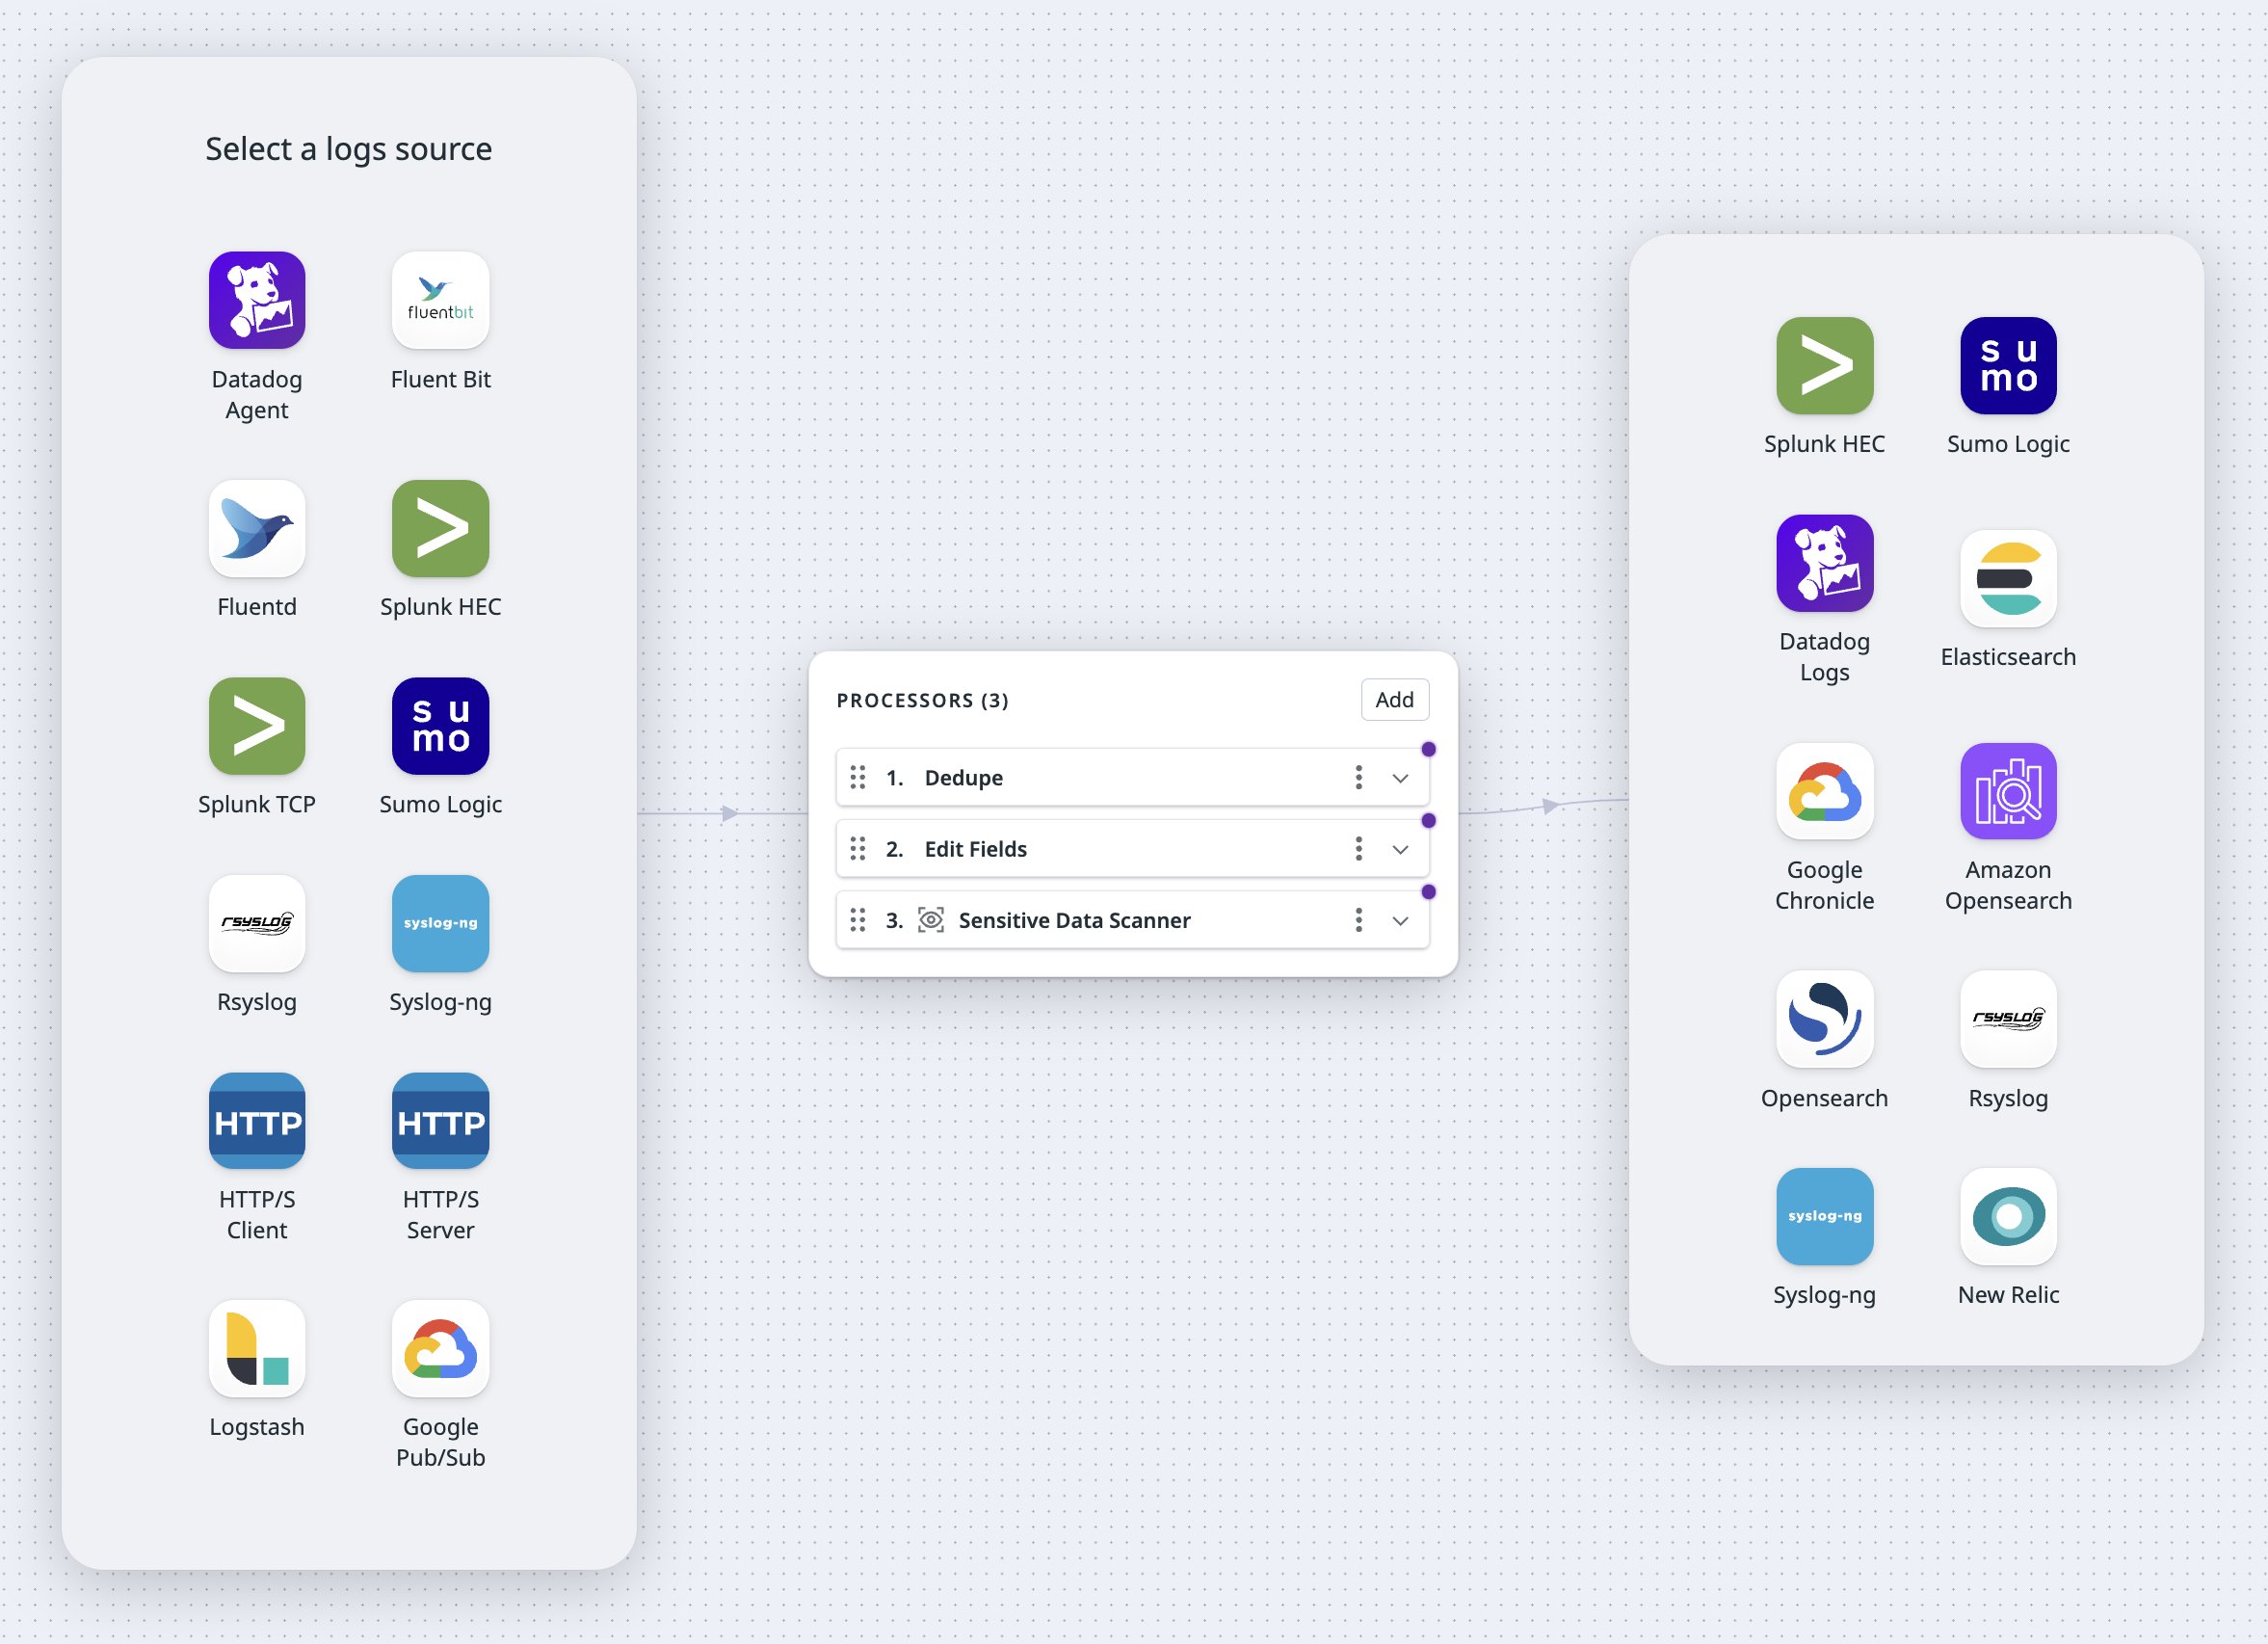
ソースとして HTTP Client を選択します。
ソースの設定
To configure your HTTP/S Client source:
Select your authorization strategy.
Select the decoder you want to use on the HTTP messages. Logs pulled from the HTTP source must be in this format.
Optionally, toggle the switch to enable TLS. If you enable TLS, the following certificate and key files are required. Note: All file paths are made relative to the configuration data directory, which is /var/lib/observability-pipelines-worker/config/ by default. See Advanced Worker Configurations for more information. The file must be owned by the observability-pipelines-worker group and observability-pipelines-worker user, or at least readable by the group or user.
Server Certificate Path: The path to the certificate file that has been signed by your Certificate Authority (CA) Root File in DER or PEM (X.509) format.
CA Certificate Path: The path to the certificate file that is your Certificate Authority (CA) Root File in DER or PEM (X.509) format.
Private Key Path: The path to the .key private key file that belongs to your Server Certificate Path in DER or PEM (PKCS#8) format.
Enter the interval between scrapes.
Your HTTP Server must be able to handle GET requests at this interval.
Since requests run concurrently, if a scrape takes longer than the interval given, a new scrape is started, which can consume extra resources. Set the timeout to a value lower than the scrape interval to prevent this from happening.
Enter the timeout for each scrape request.
宛先の設定
選択したログの送信先に応じて、以下の情報を入力します。
Optionally, toggle the switch to enable Buffering Options. Note: Buffering options is in Preview. Contact your account manager to request access.
If left disabled, the maximum size for buffering is 500 events.
If enabled:
Select the buffer type you want to set (Memory or Disk).
Enter the buffer size and select the unit.
Observability Pipelines compresses logs with the gzip (level 6) algorithm.
The following fields are optional:
Enter the name of the Splunk index you want your data in. This has to be an allowed index for your HEC. See template syntax if you want to route logs to different indexes based on specific fields in your logs.
Select whether the timestamp should be auto-extracted. If set to true, Splunk extracts the timestamp from the message with the expected format of yyyy-mm-dd hh:mm:ss.
Optionally, set the sourcetype to override Splunk’s default value, which is httpevent for HEC data. See template syntax if you want to route logs to different source types based on specific fields in your logs.
Optionally, toggle the switch to enable Buffering Options. Note: Buffering options is in Preview. Contact your account manager to request access.
If left disabled, the maximum size for buffering is 500 events.
If enabled:
Select the buffer type you want to set (Memory or Disk).
Enter the buffer size and select the unit.
The following fields are optional:
In the Encoding dropdown menu, select whether you want to encode your pipeline’s output in JSON, Logfmt, or Raw text. If no decoding is selected, the decoding defaults to JSON.
Enter a source name to override the default name value configured for your Sumo Logic collector’s source.
Enter a host name to override the default host value configured for your Sumo Logic collector’s source.
Enter a category name to override the default category value configured for your Sumo Logic collector’s source.
Click Add Header to add any custom header fields and values.
Optionally, toggle the switch to enable Buffering Options. Note: Buffering options is in Preview. Contact your account manager to request access.
If left disabled, the maximum size for buffering is 500 events.
If enabled:
Select the buffer type you want to set (Memory or Disk).
Enter the buffer size and select the unit.
The rsyslog and syslog-ng destinations support the RFC5424 format.
The rsyslog and syslog-ng destinations match these log fields to the following Syslog fields:
Log Event
SYSLOG FIELD
Default
log[“message”]
MESSAGE
NIL
log[“procid”]
PROCID
The running Worker’s process ID.
log[“appname”]
APP-NAME
observability_pipelines
log[“facility”]
FACILITY
8 (log_user)
log[“msgid”]
MSGID
NIL
log[“severity”]
SEVERITY
info
log[“host”]
HOSTNAME
NIL
log[“timestamp”]
TIMESTAMP
Current UTC time.
The following destination settings are optional:
Toggle the switch to enable TLS. If you enable TLS, the following certificate and key files are required:
Server Certificate Path: The path to the certificate file that has been signed by your Certificate Authority (CA) Root File in DER or PEM (X.509).
CA Certificate Path: The path to the certificate file that is your Certificate Authority (CA) Root File in DER or PEM (X.509).
Private Key Path: The path to the .key private key file that belongs to your Server Certificate Path in DER or PEM (PKCS#8) format.
Enter the number of seconds to wait before sending TCP keepalive probes on an idle connection.
Optionally, toggle the switch to enable Buffering Options. Note: Buffering options is in Preview. Contact your account manager to request access.
If left disabled, the maximum size for buffering is 500 events.
If enabled:
Select the buffer type you want to set (Memory or Disk).
Enter the buffer size and select the unit.
To set up the Worker’s Google SecOps destination:
Enter the customer ID for your Google SecOps instance.
If you have a credentials JSON file, enter the path to your credentials JSON file. The credentials file must be placed under DD_OP_DATA_DIR/config. Alternatively, you can use the GOOGLE_APPLICATION_CREDENTIALS environment variable to provide the credential path.
If you’re using workload identity on Google Kubernetes Engine (GKE), the GOOGLE_APPLICATION_CREDENTIALS is provided for you.
Enter the log type. See template syntax if you want to route logs to different log types based on specific fields in your logs.
Optionally, toggle the switch to enable Buffering Options. Note: Buffering options is in Preview. Contact your account manager to request access.
If left disabled, the maximum size for buffering is 500 events.
If enabled:
Select the buffer type you want to set (Memory or Disk).
Enter the buffer size and select the unit.
Note: Logs sent to the Google SecOps destination must have ingestion labels. For example, if the logs are from a A10 load balancer, it must have the ingestion label A10_LOAD_BALANCER. See Google Cloud’s Support log types with a default parser for a list of available log types and their respective ingestion labels.
The following fields are optional:
Enter the name for the Elasticsearch index. See template syntax if you want to route logs to different indexes based on specific fields in your logs.
Enter the Elasticsearch version.
Optionally, toggle the switch to enable Buffering Options. Note: Buffering options is in Preview. Contact your account manager to request access.
If left disabled, the maximum size for buffering is 500 events.
If enabled:
Select the buffer type you want to set (Memory or Disk).
Enter the buffer size and select the unit.
Optionally, enter the name of the OpenSearch index. See template syntax if you want to route logs to different indexes based on specific fields in your logs.
Optionally, toggle the switch to enable Buffering Options. Note: Buffering options is in Preview. Contact your account manager to request access.
If left disabled, the maximum size for buffering is 500 events.
If enabled:
Select the buffer type you want to set (Memory or Disk).
Enter the buffer size and select the unit.
Optionally, enter the name of the Amazon OpenSearch index. See template syntax if you want to route logs to different indexes based on specific fields in your logs.
Select an authentication strategy, Basic or AWS. For AWS, enter the AWS region.
Optionally, toggle the switch to enable Buffering Options. Note: Buffering options is in Preview. Contact your account manager to request access.
If left disabled, the maximum size for buffering is 500 events.
If enabled:
Select the buffer type you want to set (Memory or Disk).
Enter the buffer size and select the unit.
プロセッサーの設定
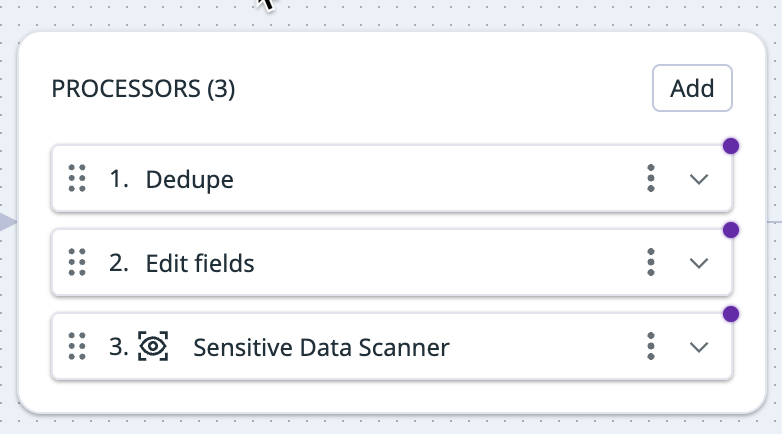
There are pre-selected processors added to your processor group out of the box. You can add additional processors or delete any existing ones based on your processing needs.
Processor groups are executed from top to bottom. The order of the processors is important because logs are checked by each processor, but only logs that match the processor’s filters are processed. To modify the order of the processors, use the drag handle on the top left corner of the processor you want to move.
Filter query syntax
Each processor has a corresponding filter query in their fields. Processors only process logs that match their filter query. And for all processors except the Filter processor, logs that do not match the query are sent to the next step of the pipeline. For the Filter processor, logs that do not match the query are dropped.
The following are logs filter query examples:
NOT (status:debug): This filters for logs that do not have the status DEBUG.
status:ok service:flask-web-app: This filters for all logs with the status OK from your flask-web-app service.
This query can also be written as: status:ok AND service:flask-web-app.
host:COMP-A9JNGYK OR host:COMP-J58KAS: This filter query only matches logs from the labeled hosts.
user.status:inactive: This filters for logs with the status inactive nested under the user attribute.
http.status:[200 TO 299] or http.status:{300 TO 399}: These two filters represent the syntax to query a range for http.status. Ranges can be used across any attribute.
Enter the information for the processors you want to use. Click the Add button to add additional processors. To delete a processor, click the kebab on the right side of the processor and select Delete.
This processor filters for logs that match the specified filter query and drops all non-matching logs. If a log is dropped at this processor, then none of the processors below this one receives that log. This processor can filter out unnecessary logs, such as debug or warning logs.
To set up the filter processor:
Define a filter query. The query you specify filters for and passes on only logs that match it, dropping all other logs.
The remap processor can add, drop, or rename fields within your individual log data. Use this processor to enrich your logs with additional context, remove low-value fields to reduce volume, and standardize naming across important attributes. Select add field, drop field, or rename field in the dropdown menu to get started.
See the Remap Reserved Attributes guide on how to use the Edit Fields processor to remap attributes.
Add field
Use add field to append a new key-value field to your log.
To set up the add field processor:
Define a filter query. Only logs that match the specified filter query are processed. All logs, regardless of whether they do or do not match the filter query, are sent to the next step in the pipeline.
Enter the field and value you want to add. To specify a nested field for your key, use the path notation: <OUTER_FIELD>.<INNER_FIELD>. All values are stored as strings.
Note: If the field you want to add already exists, the Worker throws an error and the existing field remains unchanged.
Drop field
Use drop field to drop a field from logging data that matches the filter you specify below. It can delete objects, so you can use the processor to drop nested keys.
To set up the drop field processor:
Define a filter query. Only logs that match the specified filter query are processed. All logs, regardless of whether they do or do not match the filter query, are sent to the next step in the pipeline.
Enter the key of the field you want to drop. To specify a nested field for your specified key, use the path notation: <OUTER_FIELD>.<INNER_FIELD>.
Note: If your specified key does not exist, your log will be unimpacted.
Rename field
Use rename field to rename a field within your log.
To set up the rename field processor:
Define a filter query. Only logs that match the specified filter query are processed. All logs, regardless of whether they do or do not match the filter query, are sent to the next step in the pipeline.
Enter the name of the field you want to rename in the Source field. To specify a nested field for your key, use the path notation: <OUTER_FIELD>.<INNER_FIELD>. Once renamed, your original field is deleted unless you enable the Preserve source tag checkbox described below. Note: If the source key you specify doesn’t exist, a default null value is applied to your target.
In the Target field, enter the name you want the source field to be renamed to. To specify a nested field for your specified key, use the path notation: <OUTER_FIELD>.<INNER_FIELD>. Note: If the target field you specify already exists, the Worker throws an error and does not overwrite the existing target field.
Optionally, check the Preserve source tag box if you want to retain the original source field and duplicate the information from your source key to your specified target key. If this box is not checked, the source key is dropped after it is renamed.
Use outer_key.inner_key to refer to the key with the value inner_value.
Use outer_key.inner_key.double_inner_key to refer to the key with the value double_inner_value.
This processor samples your logging traffic for a representative subset at the rate that you define, dropping the remaining logs. As an example, you can use this processor to sample 20% of logs from a noisy non-critical service.
The sampling only applies to logs that match your filter query and does not impact other logs. If a log is dropped at this processor, none of the processors below receives that log.
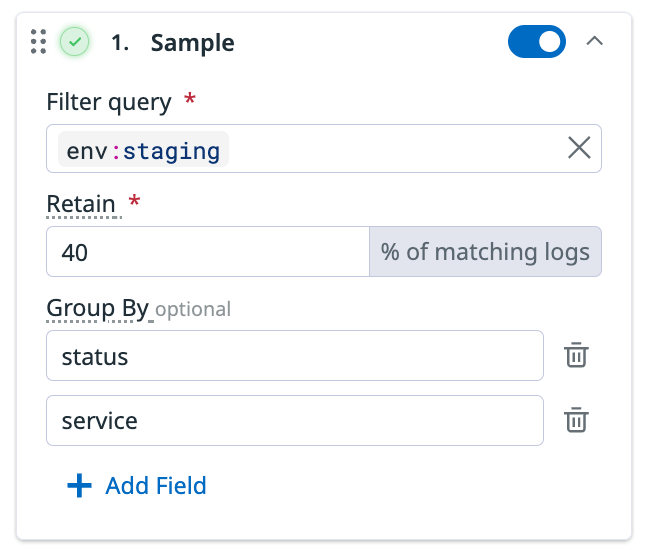
To set up the sample processor:
Define a filter query. Only logs that match the specified filter query are sampled at the specified retention rate below. The sampled logs and the logs that do not match the filter query are sent to the next step in the pipeline.
Enter your desired sampling rate in the Retain field. For example, entering 2 means 2% of logs are retained out of all the logs that match the filter query.
Optionally, enter a Group By field to create separate sampling groups for each unique value for that field. For example, status:error and status:info are two unique field values. Each bucket of events with the same field is sampled independently. Click Add Field if you want to add more fields to partition by. See the group-by example.
Group-by example
If you have the following setup for the sample processor:
Filter query: env:staging
Retain: 40% of matching logs
Group by: status and service
Then, 40% of logs for each unique combination of status and service from env:staging is retained. For example:
40% of logs with status:info and service:networks are retained.
40% of logs with status:info and service:core-web are retained.
40% of logs with status:error and service:networks are retained.
40% of logs with status:error and service:core-web are retained.
This processor parses logs using the grok parsing rules that are available for a set of sources. The rules are automatically applied to logs based on the log source. Therefore, logs must have a source field with the source name. If this field is not added when the log is sent to the Observability Pipelines Worker, you can use the Add field processor to add it.
If the source field of a log matches one of the grok parsing rule sets, the log’s message field is checked against those rules. If a rule matches, the resulting parsed data is added in the message field as a JSON object, overwriting the original message.
If there isn’t a source field on the log, or no rule matches the log message, then no changes are made to the log and it is sent to the next step in the pipeline.
Datadog’s Grok patterns differ from the standard Grok pattern, where Datadog’s Grok implementation provides:
Matchers that include options for how you define parsing rules
Filters for post-processing of extracted data
A set of built-in patterns tailored to common log formats
See Parsing for more information on Datadog’s Grok patterns.
To set up the grok parser, define a filter query. Only logs that match the specified filter query are processed. All logs, regardless of whether they match the filter query, are sent to the next step in the pipeline.
To test log samples for out-of-the-box rules:
Click the Preview Library Rules button.
Search or select a source in the dropdown menu.
Enter a log sample to test the parsing rules for that source.
To add a custom parsing rule:
Click Add Custom Rule.
If you want to clone a library rule, select Clone library rule and then the library source from the dropdown menu.
If you want to create a custom rule, select Custom and then enter the source. The parsing rules are applied to logs with that source.
Enter log samples to test the parsing rules.
Enter the rules for parsing the logs. See Parsing for more information on writing parsing rules with Datadog Grok patterns. Note: The url, useragent, and csv filters are not available.
The quota processor measures the logging traffic for logs that match the filter you specify. When the configured daily quota is met inside the 24-hour rolling window, the processor can either keep or drop additional logs, or send them to a storage bucket. For example, you can configure this processor to drop new logs or trigger an alert without dropping logs after the processor has received 10 million events from a certain service in the last 24 hours.
You can also use field-based partitioning, such as service, env, status. Each unique fields uses a separate quota bucket with its own daily quota limit. See Partition example for more information.
Note: The pipeline uses the name of the quota to identify the same quota across multiple Remote Configuration deployments of the Worker.
Limits
Each pipeline can have up to 1000 buckets. If you need to increase the bucket limit, contact support.
The quota processor is synchronized across all Workers in a Datadog organization. For the synchronization, there is a default rate limit of 50 Workers per organization. When there are more than 50 Workers for an organization:
The processor continues to run, but does not sync correctly with the other Workers, which can result in logs being sent after the quota limit has been reached.
The Worker prints Failed to sync quota state errors.
Contact support if you want to increase the default number of Workers per organization.
The quota processor periodically synchronizes counts across Workers a few times per minute. The limit set on the processor can therefore be overshot, depending on the number of Workers and the logs throughput. Datadog recommends setting a limit that is at least one order of magnitude higher than the volume of logs that the processor is expected to receive per minute. You can use a throttle processor with the quota processor to control these short bursts by limiting the number of logs allowed per minute.
To set up the quota processor:
Enter a name for the quota processor.
Define a filter query. Only logs that match the specified filter query are counted towards the daily limit.
Logs that match the quota filter and are within the daily quota are sent to the next step in the pipeline.
Logs that do not match the quota filter are sent to the next step of the pipeline.
In the Unit for quota dropdown menu, select if you want to measure the quota by the number of Events or by the Volume in bytes.
Set the daily quota limit and select the unit of magnitude for your desired quota.
Optional: Click Add Field if you want to set a quota on a specific service or region field.
Enter the field name you want to partition by. See the Partition example for more information.
Select the Ignore when missing if you want the quota applied only to events that match the partition. See the Ignore when missing example for more information.
Optional: Click Overrides if you want to set different quotas for the partitioned field.
Click Download as CSV for an example of how to structure the CSV.
Drag and drop your overrides CSV to upload it. You can also click Browse to select the file to upload it. See the Overrides example for more information.
Click Add Field if you want to add another partition.
In the When quota is met dropdown menu, select if you want to drop events, keep events, or send events to overflow destination, when the quota has been met.
If you select send events to overflow destination, an overflow destination is added with the following cloud storage options: Amazon S3, Azure Blob, and Google Cloud.
Use Partition by if you want to set a quota on a specific service or region. For example, if you want to set a quota for 10 events per day and group the events by the service field, enter service into the Partition by field.
Example for the “ignore when missing” option
Select Ignore when missing if you want the quota applied only to events that match the partition. For example, if the Worker receives the following set of events:
And the Ignore when missing is selected, then the Worker:
creates a set for logs with service:a and source:foo
creates a set for logs with service:b and source:bar
ignores the last three events
The quota is applied to the two sets of logs and not to the last three events.
If the Ignore when missing is not selected, the quota is applied to all five events.
Overrides example
If you are partitioning by service and have two services: a and b, you can use overrides to apply different quotas for them. For example, if you want service:a to have a quota limit of 5,000 bytes and service:b to have a limit of 50 events, the override rules look like this:
Service
Type
Limit
a
Bytes
5,000
b
Events
50
The reduce processor groups multiple log events into a single log, based on the fields specified and the merge strategies selected. Logs are grouped at 10-second intervals. After the interval has elapsed for the group, the reduced log for that group is sent to the next step in the pipeline.
To set up the reduce processor:
Define a filter query. Only logs that match the specified filter query are processed. Reduced logs and logs that do not match the filter query are sent to the next step in the pipeline.
In the Group By section, enter the field you want to group the logs by.
Click Add Group by Field to add additional fields.
In the Merge Strategy section:
In On Field, enter the name of the field you want to merge the logs on.
Select the merge strategy in the Apply dropdown menu. This is the strategy used to combine events. See the following Merge strategies section for descriptions of the available strategies.
Click Add Merge Strategy to add additional strategies.
Merge strategies
These are the available merge strategies for combining log events.
Name
Description
Array
Appends each value to an array.
Concat
Concatenates each string value, delimited with a space.
Concat newline
Concatenates each string value, delimited with a newline.
Concat raw
Concatenates each string value, without a delimiter.
Discard
Discards all values except the first value that was received.
Flat unique
Creates a flattened array of all unique values that were received.
Longest array
Keeps the longest array that was received.
Max
Keeps the maximum numeric value that was received.
Min
Keeps the minimum numeric value that was received.
Retain
Discards all values except the last value that was received. Works as a way to coalesce by not retaining `null`.
Shortest array
Keeps the shortest array that was received.
Sum
Sums all numeric values that were received.
The deduplicate processor removes copies of data to reduce volume and noise. It caches 5,000 messages at a time and compares your incoming logs traffic against the cached messages. For example, this processor can be used to keep only unique warning logs in the case where multiple identical warning logs are sent in succession.
To set up the deduplicate processor:
Define a filter query. Only logs that match the specified filter query are processed. Deduped logs and logs that do not match the filter query are sent to the next step in the pipeline.
In the Type of deduplication dropdown menu, select whether you want to Match on or Ignore the fields specified below.
If Match is selected, then after a log passes through, future logs that have the same values for all of the fields you specify below are removed.
If Ignore is selected, then after a log passes through, future logs that have the same values for all of their fields, except the ones you specify below, are removed.
Enter the fields you want to match on, or ignore. At least one field is required, and you can specify a maximum of three fields.
Use the path notation <OUTER_FIELD>.<INNER_FIELD> to match subfields. See the Path notation example below.
Click Add field to add additional fields you want to filter on.
Use outer_key.inner_key to refer to the key with the value inner_value.
Use outer_key.inner_key.double_inner_key to refer to the key with the value double_inner_value.
The Sensitive Data Scanner processor scans logs to detect and redact or hash sensitive information such as PII, PCI, and custom sensitive data. You can pick from Datadog’s library of predefined rules, or input custom Regex rules to scan for sensitive data.
To set up the processor:
Define a filter query. Only logs that match the specified filter query are scanned and processed. All logs are sent to the next step in the pipeline, regardless of whether they match the filter query.
Click Add Scanning Rule.
Select one of the following:
This processor adds a field with the name of the host that sent the log. For example, hostname: 613e197f3526. Note: If the hostname already exists, the Worker throws an error and does not overwrite the existing hostname.
To set up this processor:
Define a filter query. Only logs that match the specified filter query are processed. All logs, regardless of whether they do or do not match the filter query, are sent to the next step in the pipeline.
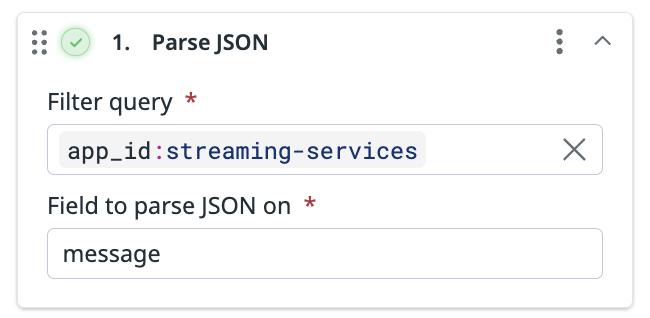
This processor parses the specified JSON field into objects. For example, if you have a message field that contains stringified JSON:
Define a filter query. Only logs that match the specified filter query are processed. All logs, regardless of whether they do or do not match the filter query, are sent to the next step in the pipeline.
Enter the name of the field you want to parse JSON on. Note: The parsed JSON overwrites what was originally contained in the field.
Use this processor to enrich your logs with information from a reference table, which could be a local file or database.
To set up the enrichment table processor:
Define a filter query. Only logs that match the specified filter query are processed. All logs, regardless of whether they do or do not match the filter query, are sent to the next step in the pipeline.
Enter the source attribute of the log. The source attribute’s value is what you want to find in the reference table.
Enter the target attribute. The target attribute’s value stores, as a JSON object, the information found in the reference table.
Select the type of reference table you want to use, File or GeoIP.
For the File type:
Enter the file path. Note: All file paths are made relative to the configuration data directory, which is /var/lib/observability-pipelines-worker/config/ by default. See Advanced Worker Configurations for more information. The file must be owned by the observability-pipelines-worker group and observability-pipelines-worker user, or at least readable by the group or user.
Enter the column name. The column name in the enrichment table is used for matching the source attribute value. See the Enrichment file example.
For the GeoIP type, enter the GeoIP path.
Enrichment file example
For this example, merchant_id is used as the source attribute and merchant_info as the target attribute.
This is the example reference table that the enrichment processor uses:
merch_id
merchant_name
city
state
803
Andy’s Ottomans
Boise
Idaho
536
Cindy’s Couches
Boulder
Colorado
235
Debra’s Benches
Las Vegas
Nevada
merch_id is set as the column name the processor uses to find the source attribute’s value. Note: The source attribute’s value does not have to match the column name.
If the enrichment processor receives a log with "merchant_id":"536":
The processor looks for the value 536 in the reference table’s merch_id column.
After it finds the value, it adds the entire row of information from the reference table to the merchant_info attribute as a JSON object:
There are no environment variables to configure for Datadog Log Management.
Enter your Splunk HEC token and the base URL of the Splunk instance. See prerequisites for more information.
The Worker passes the HEC token to the Splunk collection endpoint. After the Observability Pipelines Worker processes the logs, it sends the logs to the specified Splunk instance URL.
Note: The Splunk HEC destination forwards all logs to the /services/collector/event endpoint regardless of whether you configure your Splunk HEC destination to encode your output in JSON or raw.
Enter the Sumo Logic HTTP collector URL. See prerequisites for more information.
Enter the rsyslog or syslog-ng endpoint URL. For example, 127.0.0.1:9997. The Observability Pipelines Worker sends logs to this address and port.
Enter the Google Chronicle endpoint URL. For example, https://chronicle.googleapis.com.
Enter the Elasticsearch authentication username.
Enter the Elasticsearch authentication password.
Enter the Elasticsearch endpoint URL. For example, http://CLUSTER_ID.LOCAL_HOST_IP.ip.es.io:9200.
Enter the OpenSearch authentication username.
Enter the OpenSearch authentication password.
Enter the OpenSearch endpoint URL. For example, http://<hostname.IP>:9200.
Enter the Amazon OpenSearch authentication username.
Enter the Amazon OpenSearch authentication password.
Enter the Amazon OpenSearch endpoint URL. For example, http://<hostname.IP>:9200.
環境に合わせた手順に従い、Worker をインストールしてください。
Click Select API key to choose the Datadog API key you want to use.
Note: By default, the docker run command exposes the same port the Worker is listening on. If you want to map the Worker’s container port to a different port on the Docker host, use the -p | --publish option in the command:
-p 8282:8088 datadog/observability-pipelines-worker run
Navigate back to the Observability Pipelines installation page and click Deploy.
Note: By default, the Kubernetes Service maps incoming port <SERVICE_PORT> to the port the Worker is listening on (<TARGET_PORT>). If you want to map the Worker’s pod port to a different incoming port of the Kubernetes Service, use the following service.ports[0].port and service.ports[0].targetPort values in the command:
Note: By default, the Kubernetes Service maps incoming port <SERVICE_PORT> to the port the Worker is listening on (<TARGET_PORT>). If you want to map the Worker’s pod port to a different incoming port of the Kubernetes Service, use the following service.ports[0].port and service.ports[0].targetPort values in the command:
Note: By default, the Kubernetes Service maps incoming port <SERVICE_PORT> to the port the Worker is listening on (<TARGET_PORT>). If you want to map the Worker’s pod port to a different incoming port of the Kubernetes Service, use the following service.ports[0].port and service.ports[0].targetPort values in the command:
Click Select API key to choose the Datadog API key you want to use.
Run the one-step command provided in the UI to install the Worker.
Note: The environment variables used by the Worker in /etc/default/observability-pipelines-worker are not updated on subsequent runs of the install script. If changes are needed, update the file manually and restart the Worker.
If you prefer not to use the one-line installation script, follow these step-by-step instructions:
For RHEL and CentOS, the Observability Pipelines Worker supports versions 8.0 or later.
Click Select API key to choose the Datadog API key you want to use.
Run the one-step command provided in the UI to install the Worker.
Note: The environment variables used by the Worker in /etc/default/observability-pipelines-worker are not updated on subsequent runs of the install script. If changes are needed, update the file manually and restart the Worker.
If you prefer not to use the one-line installation script, follow these step-by-step instructions:
Set up the Datadog rpm repo on your system with the below command. Note: If you are running RHEL 8.1 or CentOS 8.1, use repo_gpgcheck=0 instead of repo_gpgcheck=1 in the configuration below.
Select one of the options in the dropdown to provide the expected log or metrics (in Preview) volume for the pipeline:
Option
Description
Unsure
Use this option if you are not able to project the data volume or you want to test the Worker. This option provisions the EC2 Auto Scaling group with a maximum of 2 general purpose t4g.large instances.
1-5 TB/day
This option provisions the EC2 Auto Scaling group with a maximum of 2 compute optimized instances c6g.large.
5-10 TB/day
This option provisions the EC2 Auto Scaling group with a minimum of 2 and a maximum of 5 compute optimized c6g.large instances.
>10 TB/day
Datadog recommends this option for large-scale production deployments. It provisions the EC2 Auto Scaling group with a minimum of 2 and a maximum of 10 compute optimized c6g.xlarge instances.
Note: All other parameters are set to reasonable defaults for a Worker deployment, but you can adjust them for your use case as needed in the AWS Console before creating the stack.
Select the AWS region you want to use to install the Worker.
Click Select API key to choose the Datadog API key you want to use.
Click Launch CloudFormation Template to navigate to the AWS Console to review the stack configuration and then launch it. Make sure the CloudFormation parameters are as expected.
Select the VPC and subnet you want to use to install the Worker.
Review and check the necessary permissions checkboxes for IAM. Click Submit to create the stack. CloudFormation handles the installation at this point; the Worker instances are launched, the necessary software is downloaded, and the Worker starts automatically.
Navigate back to the Observability Pipelines installation page and click Deploy.