This product is not supported for your selected
Datadog site. (
).
If you upgrade your OP Workers version 1.8 or below to version 2.0 or above, your existing pipelines will break. Do not upgrade your OP Workers if you want to continue using OP Workers version 1.8 or below. If you want to use OP Worker 2.0 or above, you must migrate your OP Worker 1.8 or earlier pipelines to OP Worker 2.x.
Datadog recommends that you update to OP Worker versions 2.0 or above. Upgrading to a major OP Worker version and keeping it updated is the only supported way to get the latest OP Worker functionality, fixes, and security updates.
概要
観測可能性パイプラインワーカーをインフラストラクチャーにデプロイし始めると、次のような疑問にぶつかることがあります。
- 観測可能性パイプラインワーカーは、ネットワーク内のどこにデプロイすればいいのだろうか?
- どのようにデータを収集すればよいのか?
- データはどこで処理されるべきか?
このガイドでは、観測可能性パイプラインワーカーのアーキテクチャを設計する際に考慮すべき点を、特に以下のトピックについて説明します。
ネットワーキング
観測可能性パイプラインワーカーをデプロイするための最初のステップは、観測可能性パイプラインワーカーがネットワーク内のどこに位置し、どこにデプロイされるかを理解することです。
ネットワーク境界での作業
観測可能性パイプラインワーカーはアグリゲータとしてデプロイされるため、イグレスコストを最小限に抑えるために、ネットワーク境界内にデプロイする必要があります。観測可能性パイプラインワーカーへのイングレスは、決して公衆インターネットを経由してはいけません。したがって、Datadog は、物事をシンプルに保つために、地域ごとに 1 つのアグリゲーターで始めることを推奨します。
ファイアウォールやプロキシを利用する
ファイアウォールを使用する場合、Agent とアグリゲーターの通信を制限し、アグリゲーターと構成されたソースとシンクの通信を制限してください。
HTTP プロキシを使用する場合、観測可能性パイプラインワーカーには、すべての観測可能性パイプラインワーカーの HTTP トラフィックをプロキシ経由でルーティングするグローバルプロキシオプションがあります。
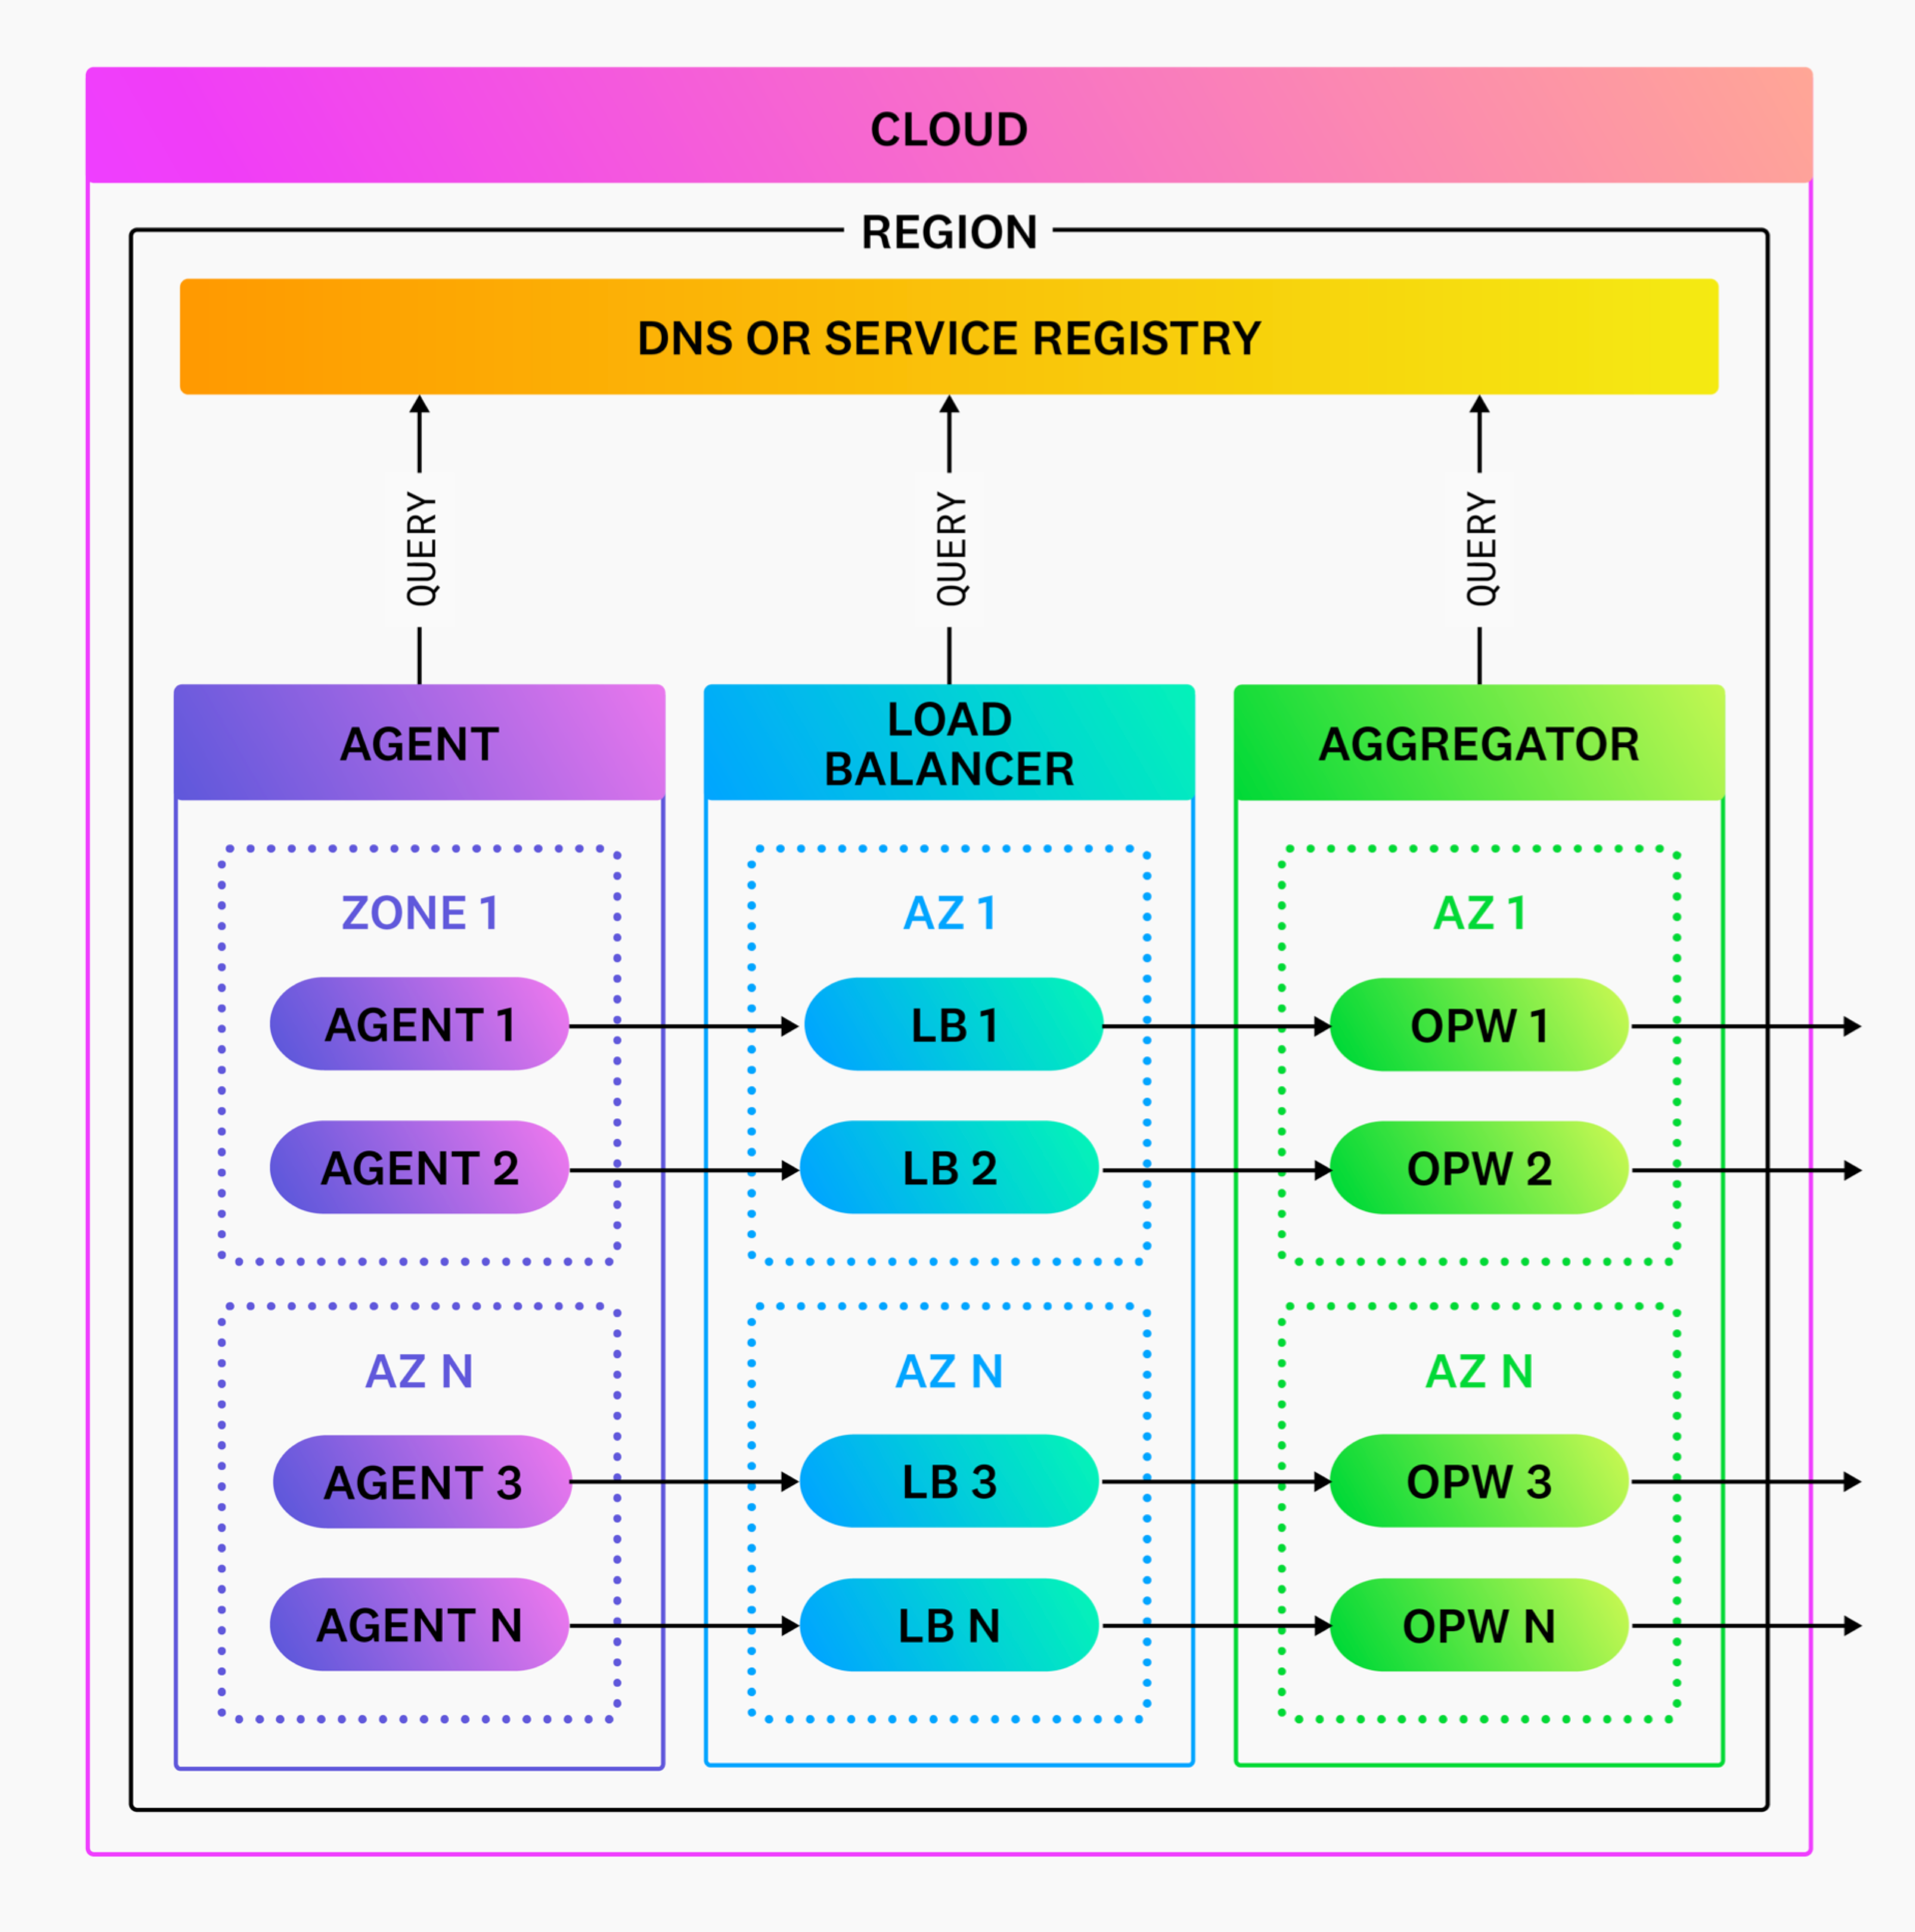
DNS とサービスディスカバリーの利用
観測可能性パイプラインワーカーのアグリゲーターとサービスの発見は、DNS またはサービス発見によって解決する必要があります。この戦略は、トラフィックのルーティングとロードバランシングを容易にし、これにより Agent とロードバランサーはアグリゲーターを発見することができます。適切な懸念の分離のために、観測可能性パイプラインワーカーは DNS クエリを解決せず、代わりにシステムレベルのリゾルバ (例えば、Linux 解決) にこれを委ねます。
プロトコルの選択
観測可能性パイプラインワーカーにデータを送信する場合、Datadog ではロードバランシングとアプリケーションレベルの配信確認が容易にできるプロトコルを選択することを推奨しています。HTTP と gRPC は、そのユビキタスな性質と、HTTP/gRPC ベースのサービスを効果的かつ効率的に運用するための利用可能なツールやドキュメントの量から、好ましい選択肢です。
プロトコルに沿ったソースを選択してください。観測可能性パイプラインワーカーのソースは、それぞれ異なるプロトコルを実装しています。例えば、観測可能性パイプラインワーカーのソースとシンクは、観測可能性パイプラインワーカー間の通信に gRPC を使用しており、HTTP ソースは HTTP でデータを受信することが可能です。それぞれのプロトコルについては、ソースを参照してください。
データの収集
パイプラインはデータ収集から始まります。サービスやシステムが生成するデータ* は、収集してダウンストリームの送信先へ送ることができます。データ収集はエージェントによって行われます。どのエージェントを使うべきかを理解することで、必要なデータを確実に収集できます。
Agent の選択
エンジニアリングチームのシステム監視能力を最適化する Agent を選択する必要があります。したがって、観測可能性パイプラインワーカーを最適な Agent とインテグレーションし、観測可能性パイプラインワーカーをアグリゲーターとして別々のノードにデプロイします。
例えば、Datadog Network Performance Monitoring は Datadog Agent をベンダー固有のシステムと統合し、ベンダー固有のデータを生成します。そのため、Datadog Agent はデータを収集し、Datadog に直接送信する必要があります。このデータは観測可能性パイプラインワーカーのデータタイプとしてサポートされていないため、Datadog Agent はデータを収集し、Datadog に直接送信する必要があります。
別の例として、Datadog Agent がサービスメトリクスを収集し、ベンダー固有の Datadog タグでリッチ化した場合を挙げます。この場合、Datadog Agent はメトリクスを直接 Datadog に送るか、観測可能性パイプラインワーカーを経由して送る必要があります。観測可能性パイプラインワーカーは、生成されるデータがベンダー固有の方法でリッチ化されているため、Datadog Agent を置き換えるべきではありません。
Agent とインテグレーションしたら、ローカルネットワーク上で Agent から直接データを受信するように観測可能性パイプラインワーカーを構成し、観測可能性パイプラインワーカーを経由してデータをルーティングしてください。Agent からデータを受信するには、datadog_agent や open_telemetry などのソースコンポーネントを使用します。
Agent リスクの低減
Agent とインテグレーションする場合、Agent を単純なデータフォワーダーとして構成し、サポートされているデータタイプを観測可能性パイプラインワーカーを介してルーティングします。これにより、Agent の責任を最小限にすることで、データ損失やサービス停止のリスクを低減します。
データの処理
観測可能性パイプラインワーカーのソースとシンクの間で効率的なパイプラインを設計したい場合、どのデータタイプをどこで処理するのかを理解することが役立ちます。
処理するデータの選択
Observability Pipelines Worker を使用して、データ* を処理することができます。しかし、連続的なプロファイリングデータのような、リアルタイムのベンダー特有データは相互運用性がなく、一般的に処理するメリットはありません。
リモート処理
リモート処理のために観測可能性パイプラインワーカーは、アグリゲーターとして別のノードにデプロイすることができます。
データ処理は、あなたのノードからリモート集計ノードに移行されます。リモート処理は、高耐久性と高可用性を必要とする環境 (ほとんどの環境) で推奨されます。また、Agent を追加する際に必要なインフラストラクチャーの再構築が必要ないため、セットアップが容易です。
詳細については、アグリゲーターアーキテクチャを参照してください。
データのバッファリング
データをどこに、どのようにバッファリングするかも、パイプラインの効率に影響します。
データをバッファリングする場所の選択
バッファリングは宛先の近くで行い、各宛先は独立したバッファを持つことで、以下のようなメリットがあります。
- 各宛先は、シンクの要求に合わせてバッファを構成することができます。詳しくは、データのバッファリング方法の選択を参照してください。
- 宛先ごとにバッファを分離することで、1 つの宛先で誤動作が発生しても、バッファが構成容量に達するまでパイプライン全体を停止させることがなくなります。
このような理由から、観測可能性パイプラインワーカーでは、バッファとシンクを結合しています。
データをバッファリングする方法の選択
観測可能性パイプラインワーカーのビルトインバッファは、操作を簡素化し、複雑な外部バッファは必要ありません。
観測可能性パイプラインワーカーのバッファタイプを選択する際には、宛先の目的に最適なタイプを選択します。例えば、記録システムでは高い耐久性のためにディスクバッファを使用し、分析システムでは低いレイテンシーのためにメモリバッファを使用すべきです。さらに、どちらのバッファも別のバッファにオーバーフローさせることで、バックプレッシャーがクライアントに伝搬するのを防ぐことができます。
データのルーティング
データを適切な宛先に送るためのルーティングは、パイプライン設計の最終段階です。アグリゲーターを使って、チームにとって最適なシステムに柔軟にデータをルーティングしてください。
記録と分析のシステムを分離する
記録システムと分析システムを分離することで、それぞれの目的に影響するトレードオフを行わずにコストを最適化することができます。例えば、記録システムは、大量のデータを長期的にバッチ処理し、圧縮することで、すべてのデータに対して高い耐久性を確保しながらコストを最小化することができます。また、分析システムは、データのサンプリングとクリーニングを行い、リアルタイム分析のためのレイテンシーを低く抑えながら、コストを削減することができます。
記録システムにルーティングする (アーカイブ)
以下のような方法で、コストを抑えながら記録システムを耐久性のために最適化することができます。
- ノードの再起動やソフトウェアの不具合によるデータ損失を減らすため、アーカイブへの書き込みはアグリゲーターロールからのみ行います。
- ディスクバッファでシンクを前面化します。
- すべてのソースでエンドツーエンドの確認応答を有効にします。
batch.max_bytes を ≥ 5MiB に、batch.timeout_secs を ≥ 5 分に設定し、圧縮を有効にします (aws_s3 シンクなどのアーカイブシンクのデフォルト)。- 未処理の生データをアーカイブすることで、データの再生が可能になり、処理中に誤ってデータが破損するリスクを低減することができます。
分析システムにルーティングする
以下のような方法で、コストを削減しながら分析システムを分析のために最適化することができます。
- メモリバッファでシンクを前面化します。
batch.timeout_sec を ≤ 5 秒に設定します (datadog_logs などの分析用シンクのデフォルト)。- 分析に使用しない属性を削除するには、
remap 変換を使用します。 - 分析に使用しないイベントをフィルターにかける
level info 以下のログをサンプリングして、その量を減らすことを検討する
* Observability Pipelines はログをサポートします。メトリクスのサポートはベータ版です。