概要
このインテグレーションは、TeamCity サーバーに接続してメトリクス、サービスチェック、イベントを送信し、TeamCity プロジェクトのビルド構成、ビルド実行、サーバーリソースなどの健全性を監視することができます。
セットアップ
インストール
TeamCity チェックは Datadog Agent パッケージに含まれています。TeamCity サーバーに追加でインストールする必要はありません。
構成
TeamCity の準備
ゲストログインを有効にするか、Basic HTTP 認証のユーザー資格情報を識別することができます。
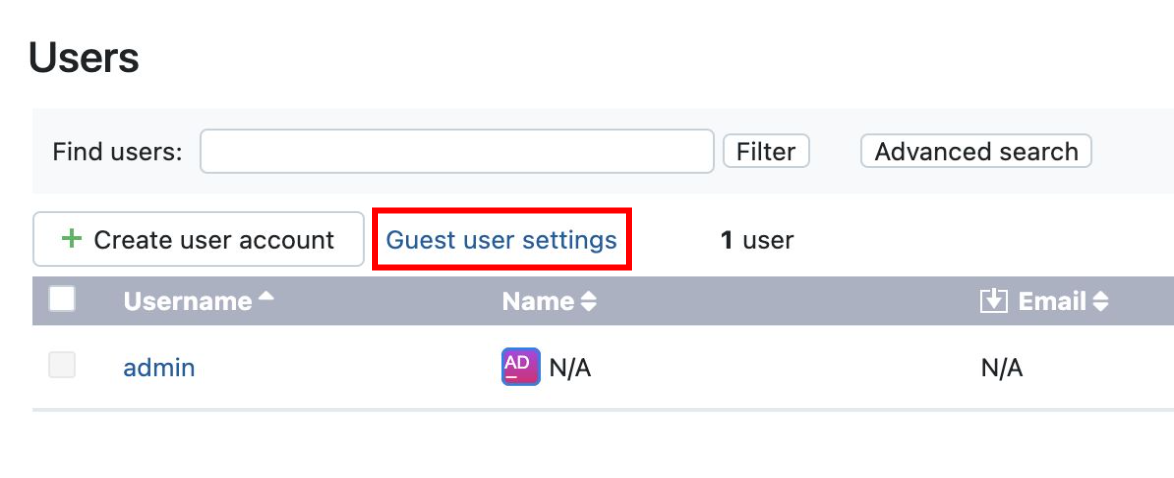
ゲストログイン
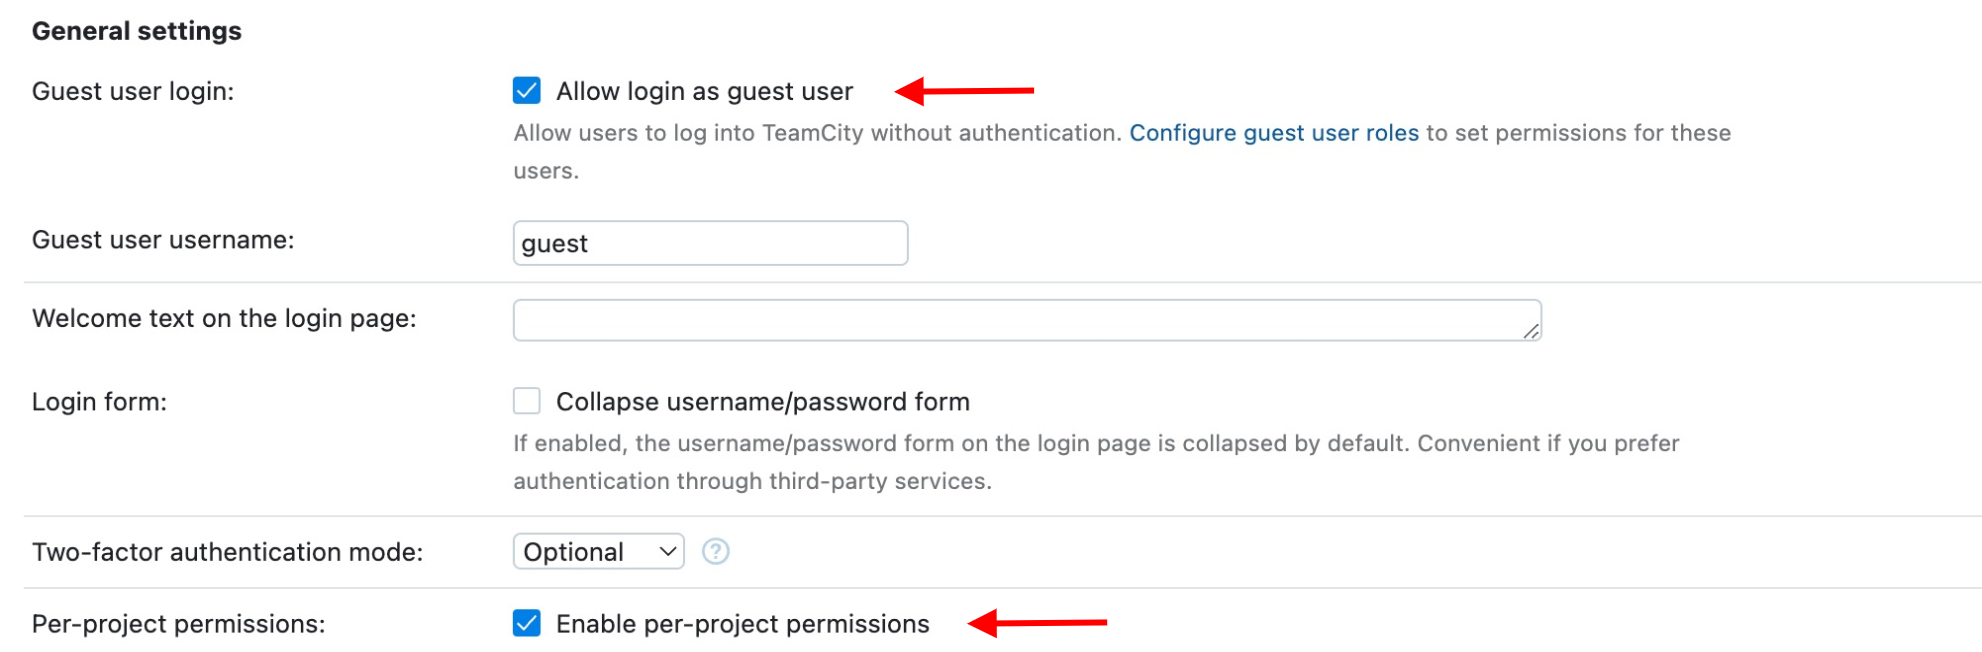
ゲストログインを有効にします。
プロジェクト単位の権限を Guest ユーザーに割り当てられるように、Per-project permissions を有効にします。認可モードの変更を参照してください。
既存のロールを使用するか、新しい読み取り専用ロールを作成し、そのロールにView Usage Statistics 権限を追加します。ロールと権限の管理を参照してください。
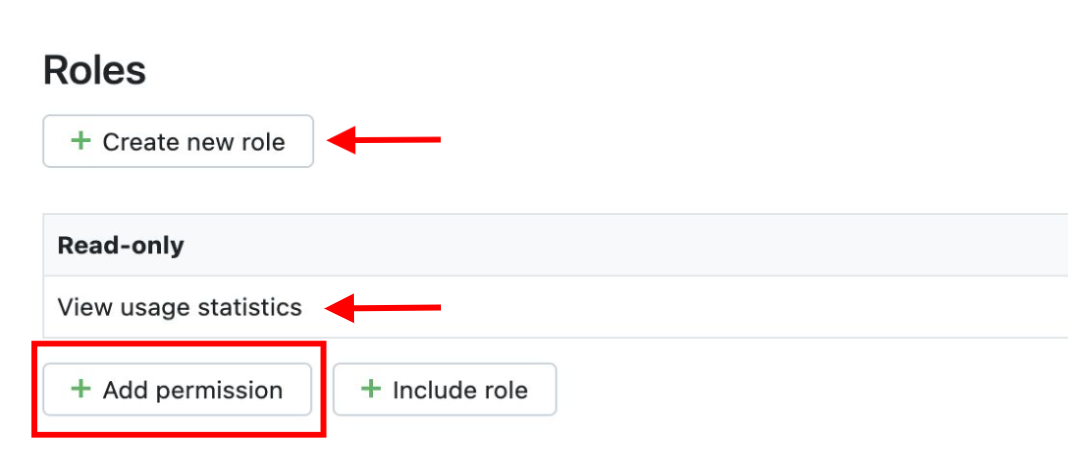
[オプション] イベント収集時にビルド構成の種類を自動的に検出するチェックを有効にするには、読み取り専用ロールに View Build Configuration Settings 権限を追加します。

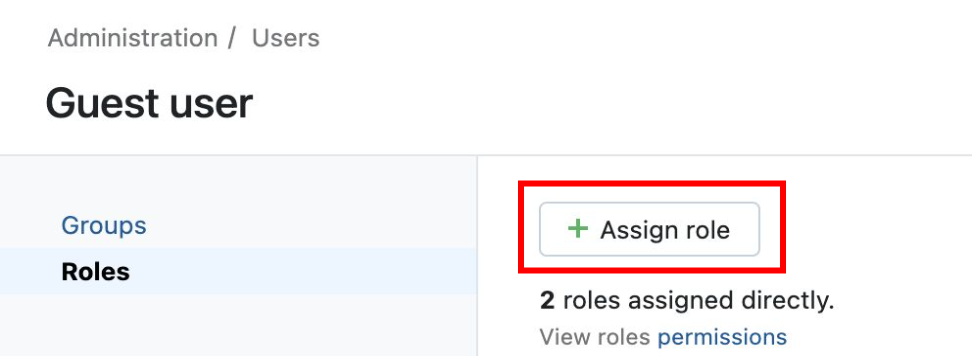
Guest ユーザーに[読み取り専用]ロールを割り当てます。ユーザーへのロールの割り当てを参照してください。
ユーザー資格情報
Basic HTTP 認証の場合
- Agent の構成ディレクトリの
conf.d/ フォルダ内の teamcity.d/conf.yaml ファイルに、識別された username と password を指定します。 Access denied. Enable guest authentication or check user permissions. (アクセスが拒否されました。ゲスト認証を有効にするか、ユーザー権限を確認してください。) というエラーが発生した場合は、ユーザーの権限が正しいことを確認してください。- プロジェクト単位および View Usage Statistics 権限が有効になっている。
- Agent Workload Statistics を収集する場合は、View Agent Details および View Agent Usage Statistics 権限も割り当てます。
ホスト
ホストで実行中の Agent に対してこのチェックを構成するには
Agent のコンフィギュレーションディレクトリのルートにある conf.d/ フォルダーの teamcity.d/conf.yaml を編集します。使用可能なすべてのコンフィギュレーションオプションの詳細については、サンプル teamcity.d/conf.yaml を参照してください。
TeamCity チェックは、データ収集の 2 つのメソッドを提供します。TeamCity 環境を最適にモニターするには、2 つの別々のインスタンスを構成して、それぞれの方法からメトリクスを収集します。
OpenMetrics メソッド (Python バージョン 3 が必要です):
TeamCity の /metrics Prometheus エンドポイントからメトリクスを収集するために use_openmetrics: true を有効化します。
init_config:

instances:
 - use_openmetrics: true

   ## @param server - string - required
   ## Specify the server name of your TeamCity instance.
   ## Enable Guest Authentication on your instance or specify `username` and `password` to
   ## enable basic HTTP authentication.
   #
   server: http://teamcity.<ACCOUNT_NAME>.com
OpenMetrics 準拠のヒストグラムとサマリーのメトリクスを収集するには (TeamCity Server 2022.10+ から利用可能)、内部プロパティである teamcity.metrics.followOpenMetricsSpec=true を追加してください。TeamCity 内部プロパティを参照してください。
TeamCity Server REST API メソッド (Python バージョン 3 が必要です):
TeamCity サーバーの REST API から追加のビルド固有のメトリクス、サービスチェック、ビルドステータスイベントを収集するために、teamcity.d/conf.yaml ファイルに別のインスタンスを構成します。projects オプションを使用して、プロジェクトとビルド構成を指定します。
init_config:

instances:
  - server: http://teamcity.<ACCOUNT_NAME>.com

    ## @param projects - mapping - optional
    ## Mapping of TeamCity projects and build configurations to
    ## collect events and metrics from the TeamCity REST API.
    #
    projects:
      <PROJECT_A>:
        include:
        - <BUILD_CONFIG_A>
        - <BUILD_CONFIG_B>
        exclude:
        - <BUILD_CONFIG_C>
      <PROJECT_B>:
        include:
        - <BUILD_CONFIG_D>
      <PROJECT_C>: {}
オプションの include と exclude フィルターを使用して、監視に含めるビルド構成 ID と監視から除外するビルド構成 ID をそれぞれ指定し、各プロジェクトのビルド構成監視をカスタマイズします。ビルド構成 ID のマッチングパターンを指定するために、include と exclude のキーで正規表現パターンがサポートされています。もし include と exclude の両方のフィルターが省略された場合、指定したプロジェクトのすべてのビルド構成が監視されます。
Python バージョン 2 の場合、build_configuration オプションを使用して、インスタンスごとに 1 つのビルド構成 ID を構成します。
init_config:

instances:
  - server: http://teamcity.<ACCOUNT_NAME>.com

    ## @param projects - マッピング - オプション
    ## TeamCity REST API からイベントとメトリクスを収集するための
    ## TeamCity プロジェクトとビルド構成のマッピング。
    #
    build_configuration: <BUILD_CONFIGURATION_ID>
Agent を再起動すると、TeamCity イベントが収集され、Datadog に送信されます。
ログ収集
TeamCity ログ設定を構成します。
デフォルトでは、Datadog のインテグレーションパイプラインは以下のログフォーマットをサポートします。
[2020-09-10 21:21:37,486] INFO - jetbrains.buildServer.STARTUP - Current stage: System is ready
別の変換パターンを定義する場合は、インテグレーションパイプラインを複製して編集してください。
Datadog Agent で、ログの収集はデフォルトで無効になっています。以下のように、datadog.yaml ファイルでこれを有効にします。
teamcity.d/conf.yaml ファイルで以下のコンフィギュレーションブロックのコメントを削除します。環境に基づいて、path パラメーターの値を変更します。使用可能なすべてのコンフィギュレーションオプションについては、teamcity.d/conf.yaml のサンプルを参照してください。
logs:
  - type: file
    path: /opt/teamcity/logs/teamcity-server.log
    source: teamcity
  - type: file
    path: /opt/teamcity/logs/teamcity-activities.log
    source: teamcity
  - type: file
    path: /opt/teamcity/logs/teamcity-vcs.log
    source: teamcity
  - type: file
    path: /opt/teamcity/logs/teamcity-cleanup.log
    source: teamcity
  - type: file
    path: /opt/teamcity/logs/teamcity-notifications.log
    source: teamcity
  - type: file
    path: /opt/teamcity/logs/teamcity-ws.log
    source: teamcity
Agent を再起動します。
コンテナ化
コンテナ環境の場合は、オートディスカバリーのインテグレーションテンプレートのガイドを参照して、次のパラメーターを適用してください。
| パラメーター | 値 |
|---|
<INTEGRATION_NAME> | teamcity |
<INIT_CONFIG> | 空白または {} |
<INSTANCE_CONFIG> | {"server": "%%host%%", "use_openmetrics": "true"} |
ログ収集
Datadog Agent で、ログの収集はデフォルトで無効になっています。有効にする方法については、Kubernetes ログ収集を参照してください。
| パラメーター | 値 |
|---|
<LOG_CONFIG> | {"source": "teamcity"} |
検証
Agent の status サブコマンドを実行し、Checks セクションで teamcity を探します。
収集データ
メトリクス
イベント
ビルドの成功と失敗を表す TeamCity イベントが Datadog に転送されます。
サービスチェック
トラブルシューティング
ご不明な点は、Datadog のサポートチームまでお問合せください。
その他の参考資料