- 重要な情報
- はじめに
- 用語集
- ガイド
- エージェント
- インテグレーション
- OpenTelemetry
- 開発者
- API
- CoScreen
- アプリ内
- Service Management
- インフラストラクチャー
- アプリケーションパフォーマンス
- 継続的インテグレーション
- ログ管理
- セキュリティ
- UX モニタリング
- 管理
Supported OS
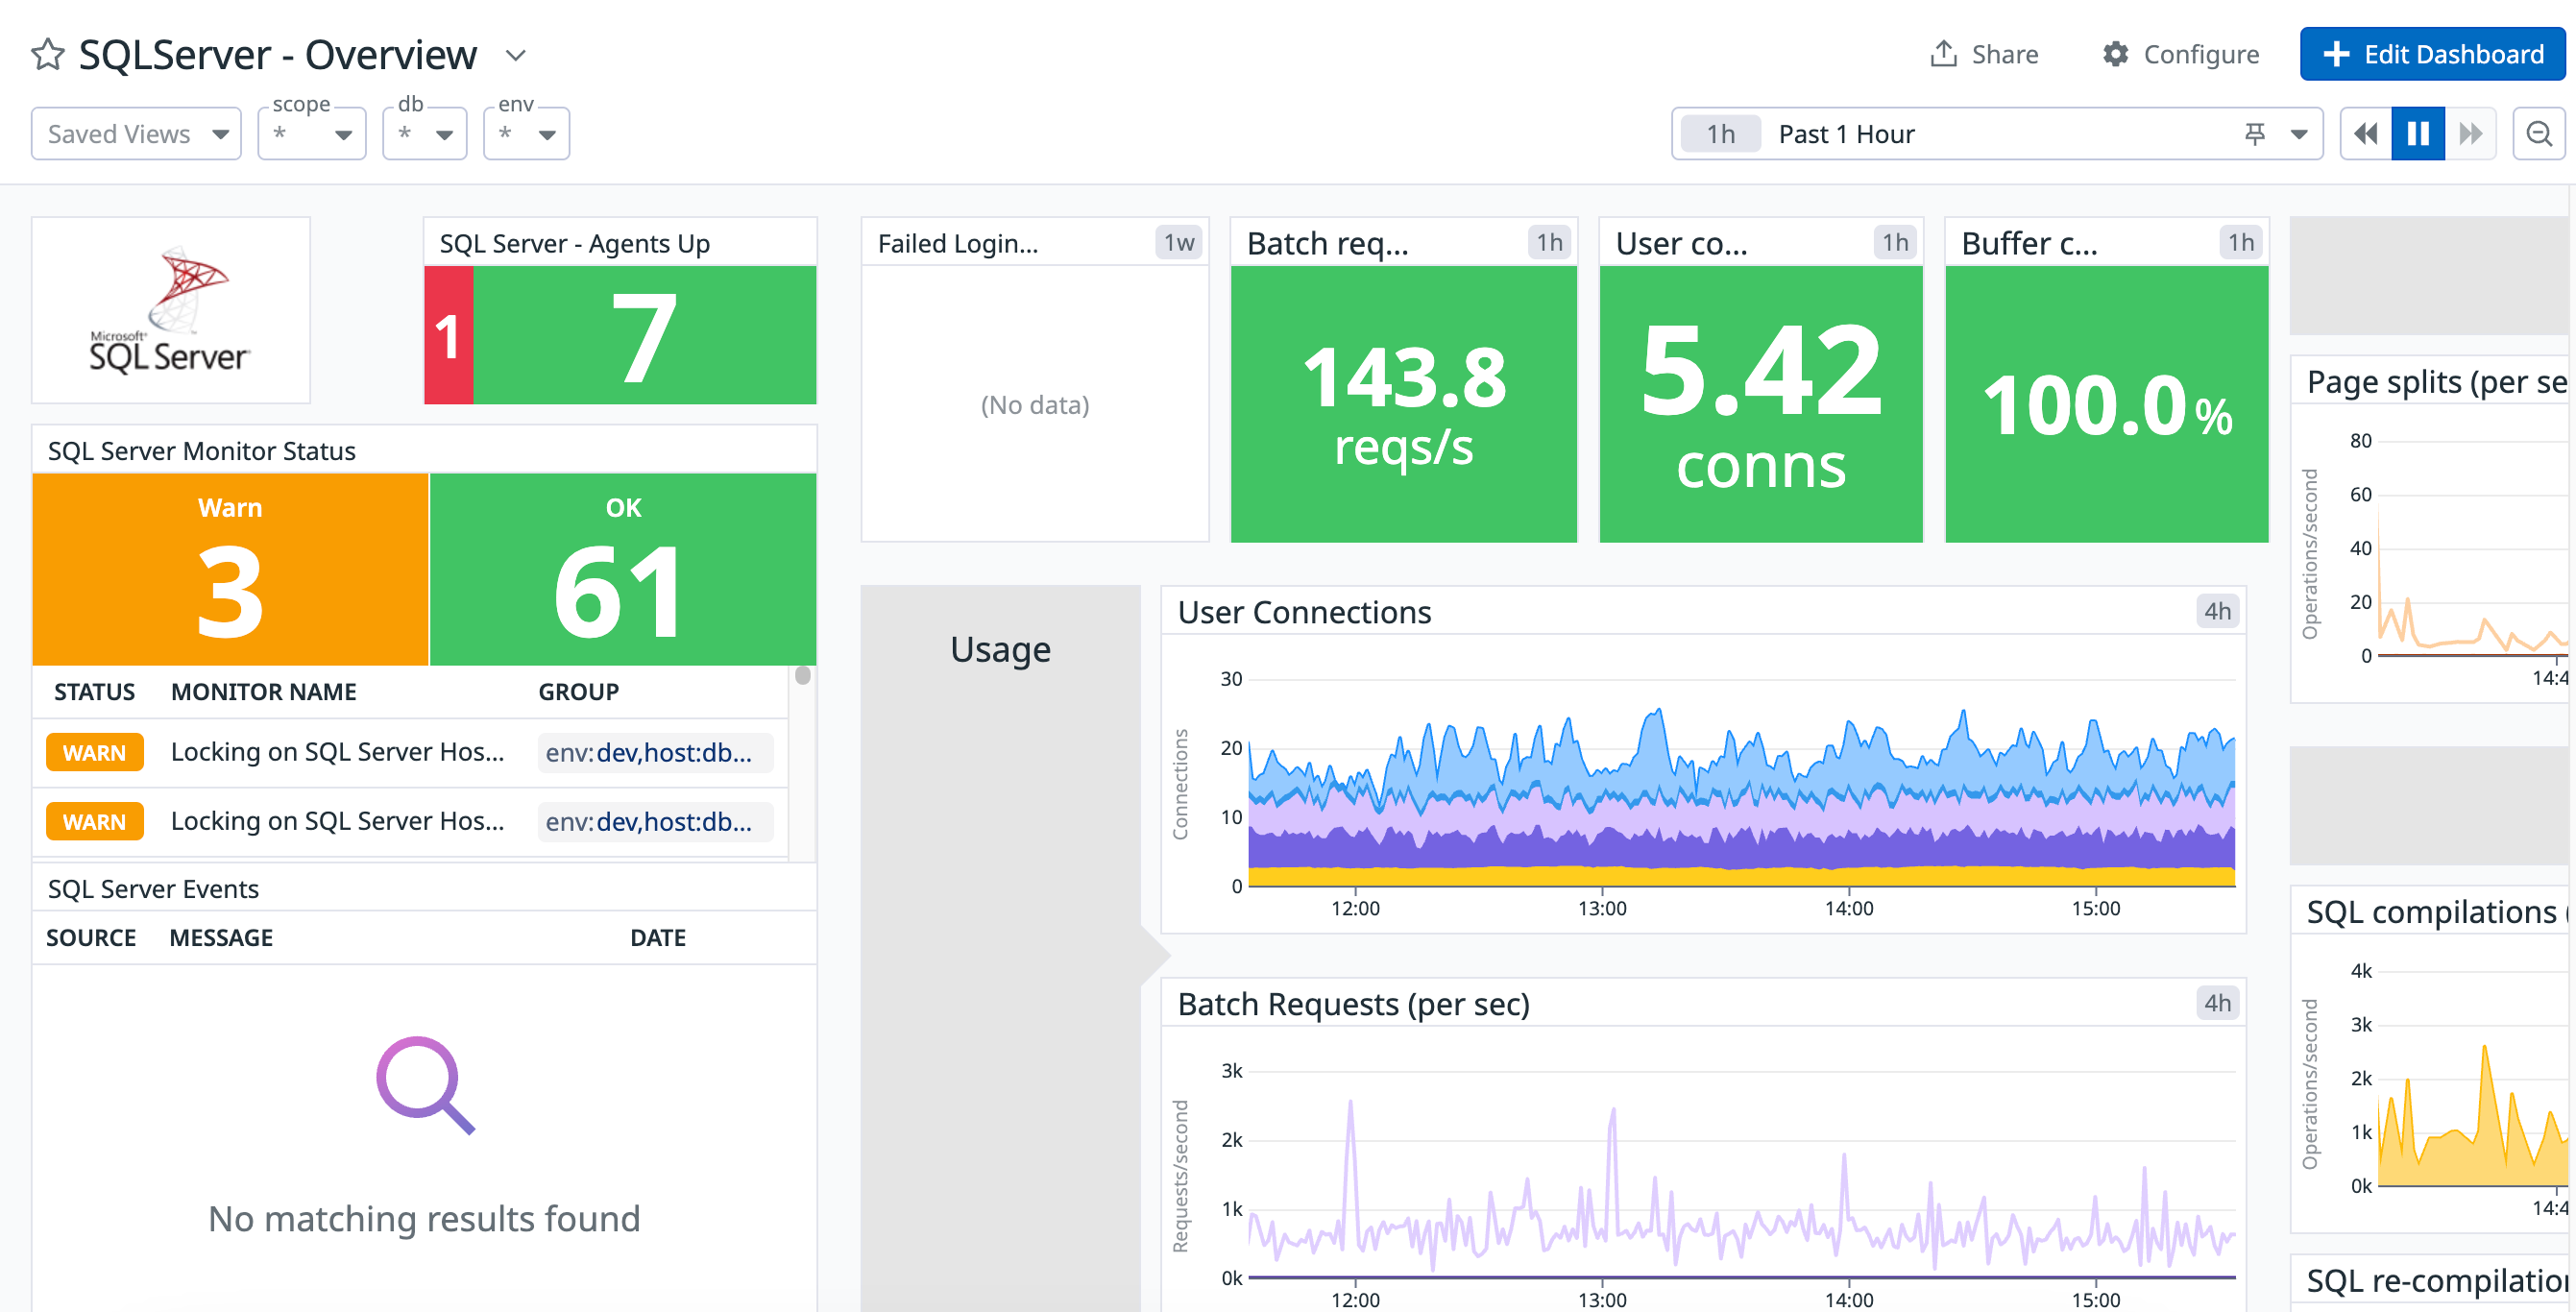
SQL Server インテグレーションを使用して、SQL Server インスタンスのパフォーマンスを追跡できます。ユーザー接続の数、SQL のコンパイル率などのメトリクスを収集できます。
データベースモニタリング (DBM) を有効にすると、クエリのパフォーマンスとデータベースの健全性について詳細なインサイトを取得できます。標準のインテグレーションに加え、Datadog DBM では、クエリレベルのメトリクス、リアルタイムおよび過去のクエリスナップショット、待機イベントの分析情報、データベースの負荷、クエリ実行計画、ブロッキングを引き起こしているクエリについてのインサイトが提供されます。
SQL Server チェックは Datadog Agent パッケージに含まれています。SQL Server インスタンスに追加でインストールする必要はありません。
サーバーのプロパティで “SQL Server and Windows Authentication mode” を有効にして、SQL Server インスタンスが SQL Server 認証をサポートするよう、次のように指定します。
Server Properties -> Security -> SQL Server and Windows Authentication mode
注: Database Monitoring for SQL Server をインストールするには、ドキュメントサイトでホスティングソリューションを選択し、手順を確認してください。
標準のインテグレーションを単体でインストールする場合のみ、このガイドの下記の手順に進んでください。
読み取り専用ログインを作成してサーバーに接続します。
CREATE LOGIN datadog WITH PASSWORD = '<PASSWORD>';
CREATE USER datadog FOR LOGIN datadog;
GRANT SELECT on sys.dm_os_performance_counters to datadog;
GRANT VIEW SERVER STATE to datadog;
データベースごとにファイルサイズのメトリクスを収集するには、以下を実行して、作成したユーザー (datadog
) にデータベースに接続権限アクセスがあることを確認します。
GRANT CONNECT ANY DATABASE to datadog;
SQL Server インスタンスが、特定の固定ポートをリッスンしていることを確認します。デフォルトでは、名前付きインスタンスおよび SQL Server Express は動的ポート用に構成されています。詳細は、Microsoft のドキュメントをご参照ください。
(AlwaysOn および sys.master_files
メトリクスの場合に必要metrics) AlwaysOn および sys.master_files
メトリクスを収集するには、以下の追加権限を付与します。
GRANT VIEW ANY DEFINITION to datadog;
ホストで実行中の Agent に対してこのチェックを構成するには:
Agent のコンフィギュレーションディレクトリのルートにある conf.d/
フォルダーの sqlserver.d/conf.yaml
ファイルを編集します。使用可能なすべてのコンフィギュレーションオプションについては、サンプル sqlserver.d/conf.yaml を参照してください。
init_config:
instances:
- host: "<SQL_HOST>,<SQL_PORT>"
username: datadog
password: "<YOUR_PASSWORD>"
connector: odbc # alternative is 'adodbapi'
driver: SQL Server
カスタムクエリを使用して独自のメトリクスを作成する方法など、すべてのオプションの詳細については、チェックコンフィギュレーションの例を参照してください。
注: (デフォルトの) プロバイダー SQLOLEDB
は、非推奨になります。新しい MSOLEDBSQL
プロバイダーを使用するには、Microsoft からこのプロバイダーをダウンロードし、sqlserver.d/conf.yaml
ファイルで adoprovider
変数を MSOLEDBSQL
に設定します。また、以下のように指定することで、Windows 認証を使用する際に、ユーザー名とパスワードの入力を求めないようにすることもできます。
connection_string: "Trusted_Connection=yes"
Linux ホスト上で SQL Server インテグレーションを実行するには、以下のような追加の構成設定が必要です。
odbc.ini
ファイルと odbcinst.ini
ファイルを /opt/datadog-agent/embedded/etc
フォルダーにコピーします。odbc
コネクターを使用し、odbcinst.ini
ファイルで指定された正しいドライバーを指定するように conf.yaml
ファイルを構成します。Agent バージョン 6.0 以降で利用可能
Datadog Agent で、ログの収集はデフォルトで無効になっています。以下のように、datadog.yaml
ファイルでこれを有効にします。
logs_enabled: true
SQL Server のログの収集を開始するには、次の構成ブロックを sqlserver.d/conf.yaml
ファイルに追加します。
logs:
- type: file
encoding: utf-16-le
path: "<LOG_FILE_PATH>"
source: sqlserver
service: "<SERVICE_NAME>"
path
パラメーターと service
パラメーターの値を環境に合わせて変更してください。使用可能なすべてのコンフィギュレーションオプションの詳細については、sqlserver.d/conf.yaml のサンプルを参照してください。
コンテナ環境の場合は、オートディスカバリーのインテグレーションテンプレートのガイドを参照して、次のパラメーターを適用してください。
パラメーター | 値 |
---|---|
<インテグレーション名> | sqlserver |
<初期コンフィギュレーション> | 空白または {} |
<インスタンスコンフィギュレーション> | {"host": "%%host%%,%%port%%", "username": "datadog", "password": "<UNIQUEPASSWORD>", "connector": "odbc", "driver": "FreeTDS"} |
<UNIQUEPASSWORD>
をラベルではなく環境変数として渡す方法について、詳細はオートディスカバリーテンプレート変数を参照してください。
Agent バージョン 6.0 以降で利用可能
Datadog Agent で、ログの収集はデフォルトで無効になっています。有効にする方法については、Kubernetes ログ収集を参照してください。
パラメーター | 値 |
---|---|
<LOG_CONFIG> | {"source": "sqlserver", "service": "sqlserver"} |
Agent の status サブコマンドを実行し、Checks セクションの sqlserver
を探します。
sqlserver.access.page_splits (gauge) | The number of page splits per second. Shown as operation |
sqlserver.access.full_scans (gauge) | Number of unrestricted full scans per second. These can be either base-table or full-index scans. Shown as operation |
sqlserver.access.range_scans (gauge) | Number of qualified range scans through indexes per second. Shown as operation |
sqlserver.access.probe_scans (gauge) | Number of probe scans per second that are used to find at most one single qualified row in an index or base table directly. Shown as operation |
sqlserver.access.index_searches (gauge) | Number of index searches per second. These are used to start a range scan Shown as operation |
sqlserver.ao.is_primary_replica (gauge) | Denotes if a replica is a primary(1) or secondary(0). Tags: availability_group , availability_group_name , replica_server_name , failover_mode , availability_mode , database_name , replica_id , database_id , database_state , synchronization_state , failover_cluster , replica_role |
sqlserver.ao.ag_sync_health (gauge) | Availability group synchronization health: 0 = Not healthy, 1 = Partially healthy, 2 = Healthy. Tags: availability_group , availability_group_name , synchronization_health_desc |
sqlserver.ao.replica_status (gauge) | Denotes an Availability Group replica's status. Tags: availability_group , availability_group_name , replica_server_name , failover_mode , availability_mode , database_name , replica_id , database_id , database_state , synchronization_state , failover_cluster , replica_role |
sqlserver.ao.replica_sync_state (gauge) | Replica synchronization state: 0 = Not synchronizing, 1 = Synchronizing, 2 = Synchronized, 3 = Reverting, 4 = Initializing. Tags: availability_group , availability_group_name , synchronization_health_desc |
sqlserver.ao.log_send_queue_size (gauge) | Amount of log records of the primary database that has not been sent to the secondary databases. Tags: availability_group , availability_group_name , replica_server_name , failover_mode , availability_mode , database_name , replica_id , database_id , database_state , synchronization_state , failover_cluster , replica_role Shown as byte |
sqlserver.ao.log_send_rate (gauge) | Average rate at which primary replica instance sent data during last active period. Tags: availability_group , availability_group_name , replica_server_name , failover_mode , availability_mode , database_name , replica_id , database_id , database_state , synchronization_state , failover_cluster , replica_role Shown as byte |
sqlserver.ao.redo_queue_size (gauge) | Amount of log records in the log files of the secondary replica that has not yet been redone. Tags: availability_group , availability_group_name , replica_server_name , failover_mode , availability_mode , database_name , replica_id , database_id , database_state , synchronization_state , failover_cluster , replica_role Shown as byte |
sqlserver.ao.redo_rate (gauge) | Average rate at which the log records are being redone on a given secondary database. Tags: availability_group , availability_group_name , replica_server_name , failover_mode , availability_mode , database_name , replica_id , database_id , database_state , synchronization_state , failover_cluster , replica_role Shown as byte |
sqlserver.ao.low_water_mark_for_ghosts (gauge) | A monotonically increasing number for the database indicating a low water mark used by ghost cleanup on the primary database. Tags: availability_group , availability_group_name , replica_server_name , failover_mode , availability_mode , database_name , replica_id , database_id , database_state , synchronization_state , failover_cluster , replica_role |
sqlserver.ao.filestream_send_rate (gauge) | The rate at which the FILESTREAM files are shipped to the secondary replica. Tags: availability_group , availability_group_name , replica_server_name , failover_mode , availability_mode , database_name , replica_id , database_id , database_state , synchronization_state , failover_cluster , replica_role Shown as byte |
sqlserver.ao.secondary_lag_seconds (gauge) | The number of seconds that the secondary replica is behind the primary replica during synchronization. Tags: availability_group , availability_group_name , replica_server_name , failover_mode , availability_mode , database_name , replica_id , database_id , database_state , synchronization_state , failover_cluster , replica_role Shown as second |
sqlserver.ao.replica_failover_mode (gauge) | Replica failover mode: 0 = Automatic failover, 1 = Manual failover. Tags: replica_server_name , availability_group , availability_group_name , failover_mode_desc |
sqlserver.ao.replica_failover_readiness (gauge) | Replica failover readiness: 0 = Not ready for failover, 1 = Ready for failover. Tags: replica_server_name , availability_group , availability_group_name , failover_mode_desc |
sqlserver.ao.primary_replica_health (gauge) | Recovery health of primary replica: 0 = In progress, 1 = Online. The metric is not emitted if on a secondary replica. Tags: availability_group , availability_group_name , synchronization_health_desc |
sqlserver.ao.secondary_replica_health (gauge) | Recovery health of secondary replica: 0 = In progress, 1 = Online. The metric is not emitted if on a primary replica. Tags: availability_group , availability_group_name , synchronization_health_desc |
sqlserver.ao.quorum_type (gauge) | Type of quorum used by the WSFC cluster. Tags: quorum_type , quorum_state , failover_cluster |
sqlserver.ao.quorum_state (gauge) | State of the WSFC quorum. Tags: quorum_type , quorum_state , failover_cluster |
sqlserver.ao.member.type (gauge) | The type of member that's a part of the WSFC quorum. Tags: member_name , member_type , member_state , failover_cluster |
sqlserver.ao.member.state (gauge) | The state of a member that's a part of the WSFC quorum. Tags: member_name , member_type , member_state , failover_cluster |
sqlserver.ao.member.number_of_quorum_votes (gauge) | Number of quorum votes possessed by this quorum member. Tags: member_name , member_type , member_state , failover_cluster |
sqlserver.fci.status (gauge) | Status of the node in a SQL Server failover cluster instance. Tags: node_name , status , failover_cluster |
sqlserver.fci.is_current_owner (gauge) | Whether or not this node is the current owner of the SQL Server FCI. Tags: node_name , status , failover_cluster |
sqlserver.buffer.cache_hit_ratio (gauge) | The ratio of data pages found and read from the buffer cache over all data page requests. Shown as fraction |
sqlserver.buffer.checkpoint_pages (gauge) | The number of pages flushed to disk per second by a checkpoint or other operation that require all dirty pages to be flushed. Shown as page |
sqlserver.buffer.page_life_expectancy (gauge) | Duration that a page resides in the buffer pool. Shown as second |
sqlserver.buffer.page_reads (gauge) | Indicates the number of physical database page reads that are issued per second. This statistic displays the total number of physical page reads across all databases. Shown as page |
sqlserver.buffer.page_writes (gauge) | Indicates the number of physical database page writes that are issued per second. Shown as page |
sqlserver.stats.batch_requests (gauge) | The number of batch requests per second. Shown as request |
sqlserver.stats.sql_compilations (gauge) | The number of SQL compilations per second. Shown as operation |
sqlserver.stats.sql_recompilations (gauge) | The number of SQL re-compilations per second. Shown as operation |
sqlserver.stats.connections (gauge) | The number of user connections. If DBM is enabled, this metric is tagged with status, db, and user. Shown as connection |
sqlserver.stats.lock_waits (gauge) | The number of times per second that SQL Server is unable to retain a lock right away for a resource. Shown as lock |
sqlserver.latches.latch_waits (gauge) | Number of latch requests that could not be granted immediately. Shown as requests |
sqlserver.latches.latch_wait_time (gauge) | Average latch wait time (in milliseconds) for latch requests that had to wait. Shown as millisecond |
sqlserver.locks.deadlocks (gauge) | Number of lock requests per second that resulted in a deadlock. Shown as requests |
sqlserver.stats.procs_blocked (gauge) | The number of processes blocked. Shown as process |
sqlserver.stats.auto_param_attempts (gauge) | Number of auto-parameterization attempts per second. Shown as attempt |
sqlserver.stats.failed_auto_param_attempts (gauge) | Number of failed auto-parameterization attempts per second. Shown as attempt |
sqlserver.stats.safe_auto_param_attempts (gauge) | Number of safe auto-parameterization attempts per second. Shown as attempt |
sqlserver.transactions.version_store_size (gauge) | The size of the version store in tempdb. Shown as kibibyte |
sqlserver.transactions.version_cleanup_rate (gauge) | The cleanup rate of the version store in tempdb. Shown as kibibyte |
sqlserver.transactions.version_generation_rate (gauge) | The generation rate of the version store in tempdb. Shown as kibibyte |
sqlserver.transactions.longest_transaction_running_time (gauge) | The time (in seconds) that the oldest active transaction has been running. Only works if database is under read committed snapshot isolation level. Shown as second |
sqlserver.cache.object_counts (gauge) | Number of cache objects in the cache. Shown as object |
sqlserver.cache.pages (gauge) | Number of 8-kilobyte (KB) pages used by cache objects. Shown as object |
sqlserver.database.backup_restore_throughput (gauge) | Read/write throughput for backup and restore operations of a database per second. |
sqlserver.database.log_bytes_flushed (gauge) | Total number of log bytes flushed. Shown as byte |
sqlserver.database.log_flushes (gauge) | Number of log flushes per second. Shown as flush |
sqlserver.database.log_flush_wait (gauge) | Total wait time (in milliseconds) to flush the log. On an Always On secondary database, this value indicates the wait time for log records to be hardened to disk. Shown as millisecond |
sqlserver.database.transactions (gauge) | Number of transactions started for the SQL Server instance per second. Shown as transaction |
sqlserver.database.write_transactions (gauge) | Number of transactions that wrote to all databases on the SQL Server instance and committed, in the last second. Shown as transaction |
sqlserver.database.state (gauge) | Database state: 0 = Online, 1 = Restoring, 2 = Recovering, 3 = RecoveryPending, 4 = Suspect, 5 = Emergency, 6 = Offline, 7 = Copying, 10 = OfflineSecondary |
sqlserver.database.files.size (gauge) | Current size of the database file Shown as kibibyte |
sqlserver.database.files.state (gauge) | Database file state: 0 = Online, 1 = Restoring, 2 = Recovering, 3 = Recovery_Pending, 4 = Suspect, 5 = Unknown, 6 = Offline, 7 = Defunct |
sqlserver.database.master_files.size (gauge) | Current size of the database file. For a database snapshot, size reflects the maximum space that the snapshot can ever use for the file. Note: Use sqlserver.database.files.size for the actual size of FILESTREAM containers.Shown as kibibyte |
sqlserver.database.master_files.state (gauge) | Database file state: 0 = Online, 1 = Restoring, 2 = Recovering, 3 = Recovery_Pending, 4 = Suspect, 5 = Unknown, 6 = Offline, 7 = Defunct |
sqlserver.database.active_transactions (gauge) | Number of active transactions across all databases on the SQL Server instance. Shown as transaction |
sqlserver.database.avg_fragment_size_in_pages (gauge) | The average number of pages in one fragment on the leaf level of an INROWDATA allocation unit. |
sqlserver.database.index_page_count (gauge) | Total number of index or data pages. |
sqlserver.database.avg_fragmentation_in_percent (gauge) | Logical fragmentation for indexes, or extent fragmentation for heaps in the INROWDATA allocation unit. |
sqlserver.database.backup_count (gauge) | The total count of successful backups made for a database. |
sqlserver.database.fragment_count (gauge) | The number of fragments in the leaf level of an INROWDATA allocation unit. |
sqlserver.database.is_sync_with_backup (gauge) | Whether or not the database is marked for replication synchronization with backup. 0 = Not marked for replication sync, 1 = Marked for replication sync. |
sqlserver.tempdb.file_space_usage.free_space (gauge) | The amount of free space in the tempdb database file Shown as mebibyte |
sqlserver.tempdb.file_space_usage.version_store_space (gauge) | The amount of space used by the version store in the tempdb database file Shown as mebibyte |
sqlserver.tempdb.file_space_usage.internal_object_space (gauge) | The amount of space used by internal objects in the tempdb database file Shown as mebibyte |
sqlserver.tempdb.file_space_usage.user_object_space (gauge) | The amount of space used by user objects in the tempdb database file Shown as mebibyte |
sqlserver.tempdb.file_space_usage.mixed_extent_space (gauge) | The amount of space used by mixed extents in the tempdb database file Shown as mebibyte |
sqlserver.files.reads (count) | Number of reads issued on the file. Tags: logical_name , file_location , db , state Shown as read |
sqlserver.files.read_bytes (count) | Bytes read from the file. Tags: logical_name , file_location , db , state Shown as byte |
sqlserver.files.read_io_stall (count) | Total time that users waited for reads on the file. Tags: logical_name , file_location , db , state Shown as millisecond |
sqlserver.files.read_io_stall_queued (count) | Total latency from IO governance pools for reads on the file. Tags: logical_name , file_location , db , state Shown as millisecond |
sqlserver.files.writes (count) | Number of writes issued on the file. Tags: logical_name , file_location , db , state Shown as write |
sqlserver.files.written_bytes (count) | Bytes written to the file. Tags: logical_name , file_location , db , state Shown as byte |
sqlserver.files.write_io_stall (count) | Total time that users waited for writes on the file. Tags: logical_name , file_location , db , state Shown as millisecond |
sqlserver.files.write_io_stall_queued (count) | Total latency from IO governance pools for writes on the file. Tags: logical_name , file_location , db , state Shown as millisecond |
sqlserver.files.io_stall (count) | Total time that users waited for I/O to complete on the file. Tags: logical_name , file_location , db , state Shown as millisecond |
sqlserver.files.size_on_disk (gauge) | Number of bytes used on the disk for this file. Tags: logical_name , file_location , db , state Shown as byte |
sqlserver.memory.sql_cache (gauge) | Specifies the total amount of dynamic memory the server is using for the dynamic SQL cache. Shown as kibibyte |
sqlserver.memory.memory_grants_pending (gauge) | Specifies the total number of processes waiting for a workspace memory grant |
sqlserver.memory.grants_outstanding (gauge) | Specifies the total number of processes that have successfully acquired a workspace memory grant. |
sqlserver.memory.database_cache (gauge) | Specifies the amount of memory the server is currently using for the database pages cache. Shown as kibibyte |
sqlserver.memory.connection (gauge) | Specifies the total amount of dynamic memory the server is using for maintaining connections. Shown as kibibyte |
sqlserver.memory.optimizer (gauge) | Specifies the total amount of dynamic memory the server is using for query optimization. Shown as kibibyte |
sqlserver.memory.granted_workspace (gauge) | Specifies the total amount of memory currently granted to executing processes Shown as kibibyte |
sqlserver.memory.lock (gauge) | Specifies the total amount of dynamic memory the server is using for locks. Shown as kibibyte |
sqlserver.memory.log_pool_memory (gauge) | Total amount of dynamic memory the server is using for Log Pool. Shown as kibibyte |
sqlserver.memory.total_server_memory (gauge) | Specifies the amount of memory the server has committed using the memory manager. Shown as kibibyte |
sqlserver.scheduler.current_tasks_count (gauge) | Number of current tasks that are associated with this scheduler. Shown as task |
sqlserver.scheduler.current_workers_count (gauge) | Number of workers that are associated with this scheduler. Shown as worker |
sqlserver.scheduler.active_workers_count (gauge) | Number of workers that are active. An active worker is never preemptive, must have an associated task, and is either running, runnable, or suspended. Shown as worker |
sqlserver.scheduler.runnable_tasks_count (gauge) | Number of workers, with tasks assigned to them, that are waiting to be scheduled on the runnable queue. Shown as task |
sqlserver.scheduler.work_queue_count (gauge) | Number of tasks in the pending queue. These tasks are waiting for a worker to pick them up. Shown as unit |
sqlserver.server.uptime (gauge) | Total time elapsed since the last computer restart. Shown as second |
sqlserver.server.cpu_count (gauge) | The number of logical CPUs or vCPUs on the server. Shown as byte |
sqlserver.server.committed_memory (gauge) | The amount of memory committed to the memory manager Shown as byte |
sqlserver.server.physical_memory (gauge) | Total physical memory on the machine Shown as byte |
sqlserver.server.virtual_memory (gauge) | Amount of virtual memory available to the process in user mode. Shown as byte |
sqlserver.server.target_memory (gauge) | Amount of memory that can be consumed by the memory manager. When this value is larger than the committed memory, then the memory manager will try to obtain more memory. When it is smaller, the memory manager will try to shrink the amount of memory committed. Shown as byte |
sqlserver.task.context_switches_count (gauge) | Number of scheduler context switches that this task has completed. Shown as unit |
sqlserver.task.pending_io_count (gauge) | Number of physical I/Os that are performed by this task. Shown as unit |
sqlserver.task.pending_io_byte_count (gauge) | Total byte count of I/Os that are performed by this task. Shown as byte |
sqlserver.task.pending_io_byte_average (gauge) | Average byte count of I/Os that are performed by this task. Shown as byte |
sqlserver.replica.transaction_delay (gauge) | Total delay in waiting for unterminated commit acknowledgment for all the current transactions Shown as millisecond |
sqlserver.replica.flow_control_sec (gauge) | Number of times flow-control initiated in the last second. Flow Control Time (ms/sec) divided by Flow Control/sec is the average time per wait. |
sqlserver.queries.count (count) | Total count of executed queries per query (DBM only) Shown as query |
sqlserver.queries.time (count) | Total elapsed time for executed queries per query (DBM only) Shown as nanosecond |
sqlserver.queries.clr_time (count) | Total time consumed inside Microsoft .NET Framework common language runtime (CLR) objects for executed queries per query (DBM only) Shown as nanosecond |
sqlserver.queries.worker_time (count) | Total CPU time consumed by executed queries per query (DBM only) Shown as nanosecond |
sqlserver.queries.rows (count) | Total number of rows returned by executed queries per query (DBM only) Shown as row |
sqlserver.queries.physical_reads (count) | Total number of physical reads performed by executed queries per query (DBM only) Shown as read |
sqlserver.queries.logical_reads (count) | Total number of logical reads performed by executed queries per query (DBM only) Shown as read |
sqlserver.queries.logical_writes (count) | Total number of logical writes performed by executed queries per query (DBM only) Shown as write |
sqlserver.queries.columnstore_segment_reads (count) | Total columnstore segments read by executed queries per query (DBM only) Shown as segment |
sqlserver.queries.columnstore_segment_skips (count) | Total columnstore segments skipped by executed queries per query (DBM only) Shown as segment |
sqlserver.queries.memory_grant (count) | The total amount of reserved memory received by executions of this query per query. It will always be 0 for querying a memory-optimized table (DBM only). Shown as byte |
sqlserver.queries.used_memory_grant (count) | The total amount of reserved memory used by executions of this query per query. It will always be 0 for querying a memory-optimized table (DBM only). Shown as byte |
sqlserver.queries.ideal_memory_grant (count) | The total amount of ideal memory grant estimated by executions of this query per query (DBM only) Shown as byte |
sqlserver.queries.reserved_threads (count) | The total sum of reserved parallel threads used by executions of this query per query (DBM only) Shown as thread |
sqlserver.queries.used_threads (count) | The total sum of used parallel threads used by executions of this query per query (DBM only) Shown as thread |
sqlserver.queries.dop (count) | The total sum of degree of parallelism used by executions of this query per query (DBM only) |
sqlserver.queries.spills (count) | The total number of pages spilled by execution of this query per query (DBM only) |
sqlserver.queries.duration.max (gauge) | The age of the longest running query per user, db, and app. (DBM only) Shown as nanosecond |
sqlserver.queries.duration.sum (gauge) | The sum of the age of all running queries per user, db, and app. (DBM only) Shown as nanosecond |
これらのメトリクスのほとんどは、SQL Server の sys.dm_os_performance_counters
テーブルにあります。
SQL Server チェックには、イベントは含まれません。
sqlserver.can_connect
Returns CRITICAL
if the Agent is unable to connect to the monitored SQL Server instance. Returns OK
otherwise.
Statuses: ok, critical
sqlserver.database.can_connect
Returns CRITICAL
if the Agent is unable to connect to the autodiscovered SQL Server Database. Returns OK
otherwise.
Statuses: ok, critical
ご不明な点は、Datadog のサポートチームまでお問合せください。