Supported OS Linux Windows Mac OS

インテグレーションバージョン1.12.1

Solr グラフ

概要

Solr チェックは、Solr クラスターの状態とパフォーマンスを追跡します。インデックス化されたドキュメント数、キャッシュのヒット数、エビクション数、平均リクエスト時間、毎秒の平均リクエスト数などのメトリクスを収集します。

セットアップ

インストール

Solr チェックは Datadog Agent パッケージに含まれています。Solr ノードに追加でインストールする必要はありません。

このチェックは JMX ベースなので、Solr サーバーで JMX リモートを有効にする必要があります。詳細については、JMX チェックに関するドキュメントを参照してください。

コンフィギュレーション

ホスト

ホストで実行中の Agent に対してこのチェックを構成するには:

  1. Agent のコンフィギュレーションディレクトリのルートにある conf.d/ フォルダーの solr.d/conf.yaml ファイルを編集します。使用可能な全コンフィギュレーションオプションの詳細については、サンプル solr.d/conf.yaml を参照してください。

    init_config:
    
      ## @param is_jmx - boolean - required
      ## Whether or not this file is a configuration for a JMX integration.
      #
      is_jmx: true
    
      ## @param collect_default_metrics - boolean - required
      ## Whether or not the check should collect all default metrics.
      #
      collect_default_metrics: true
    
    instances:
      ## @param host - string - required
      ## Solr host to connect to.
      - host: localhost
    
        ## @param port - integer - required
        ## Solr port to connect to.
        port: 9999
    
  2. Agent を再起動します

メトリクスのリスト

conf パラメーターは、インテグレーションによって収集されるメトリクスのリストです。次の 2 つのキーのみが許可されます。

  • include (必須): フィルターの辞書。これらのフィルターに一致する属性は、exclude フィルターにも一致している場合を除き、収集されます (以下を参照)。
  • exclude (オプション): フィルターの辞書。これらのフィルターに一致する属性は収集されません。

特定の Bean に対して、メトリクスは次のようにタグ付けされます。

mydomain:attr0=val0,attr1=val1

この例では、メトリクスは mydomain (Bean 内の属性によっては多少異なる) になり、タグ attr0:val0attr1:val1domain:mydomain が付きます。

include キー内の指定したエイリアスが_キャメルケース_として書式設定されている場合、_スネークケース_に変換されます。たとえば MyMetricName は、Datadog では my_metric_name と表示されます。

属性フィルター

attribute フィルターは、次の 2 種類の値を受け入れます。

  • キーが属性名の辞書(以下を参照)。この場合、メトリクスのエイリアスを指定でき、それが Datadog でメトリクス名になります。ゲージまたはカウンターとしてメトリクスタイプを指定することもできます。カウンターを選択した場合は、メトリクスの秒あたりの速度が計算されます。

    conf:
      - include:
        attribute:
          maxThreads:
            alias: tomcat.threads.max
            metric_type: gauge
          currentThreadCount:
            alias: tomcat.threads.count
            metric_type: gauge
          bytesReceived:
            alias: tomcat.bytes_rcvd
            metric_type: counter
    
  • 属性名のリスト(以下を参照)。この場合、メトリクスタイプはゲージで、メトリクス名は jmx.\[ドメイン名].\[属性名] です。

    conf:
      - include:
        domain: org.apache.cassandra.db
        attribute:
          - BloomFilterDiskSpaceUsed
          - BloomFilterFalsePositives
          - BloomFilterFalseRatio
          - Capacity
          - CompressionRatio
          - CompletedTasks
          - ExceptionCount
          - Hits
          - RecentHitRate
    

以前のバージョン

フィルターのリストは、5.3.0 よりも新しい Datadog Agent でのみサポートされます。以前のバージョンを使用している場合は、代わりにシングルトンと複数の include ステートメントを使用します。

# Datadog Agent > 5.3.0
  conf:
    - include:
      domain: domain_name
      bean:
        - first_bean_name
        - second_bean_name
# Older Datadog Agent versions
  conf:
    - include:
      domain: domain_name
      bean: first_bean_name
    - include:
      domain: domain_name
      bean: second_bean_name

コンテナ化

コンテナ環境の場合は、JMX を使用したオートディスカバリーのガイドを参照してください。

ログの収集
  1. Datadog Agent で、ログの収集はデフォルトで無効になっています。以下のように、datadog.yaml ファイルでこれを有効にします。

     logs_enabled: true
    
  2. Solr はデフォルトで log4j ロガーを使用します。ログ出力のフォーマットをカスタマイズするには、server/resources/log4j2.xml ファイルを編集します。デフォルトでは、Datadog のインテグレーションパイプラインが以下のコンバージョンパターンをサポートします。

    %maxLen{%d{yyyy-MM-dd HH:mm:ss.SSS} %-5p (%t) [%X{collection} %X{shard} %X{replica} %X{core}] %c{1.} %m%notEmpty{ =>%ex{short}}}{10240}%n
    

    フォーマットが異なる場合は、インテグレーションパイプラインを複製して編集してください。

  3. solr.d/conf.yaml ファイルのコメントを解除して、ログコンフィギュレーションブロックを編集します。環境に基づいて、 typepathservice パラメーターの値を変更してください。使用可能なすべての構成オプションの詳細については、サンプル solr.d/solr.yaml を参照してください。

     logs:
       - type: file
         path: /var/solr/logs/solr.log
         source: solr
         # To handle multi line that starts with yyyy-mm-dd use the following pattern
         # log_processing_rules:
         #   - type: multi_line
         #     pattern: \d{4}\-(0?[1-9]|1[012])\-(0?[1-9]|[12][0-9]|3[01])
         #     name: new_log_start_with_date
    
  4. Agent を再起動します

Kubernetes 環境のログを有効にするには、Kubernetes ログ収集を参照してください。

検証

Agent の status サブコマンドを実行し、Checks セクションで solr を探します。

収集データ

メトリクス

solr.document_cache.evictions
(gauge)
The total number of cache evictions per second.
Shown as eviction
solr.document_cache.hits
(gauge)
The number of cache hits per second.
Shown as hit
solr.document_cache.inserts
(gauge)
The total number of cache inserts per second.
Shown as set
solr.document_cache.lookups
(gauge)
The total number of cache lookups per second.
Shown as get
solr.filter_cache.evictions
(gauge)
The total number of cache evictions per second.
Shown as eviction
solr.filter_cache.hits
(gauge)
The number of cache hits per second.
Shown as hit
solr.filter_cache.inserts
(gauge)
The total number of cache inserts per second.
Shown as set
solr.filter_cache.lookups
(gauge)
The total number of cache lookups per second.
Shown as get
solr.query_result_cache.evictions
(gauge)
The total number of cache evictions per second.
Shown as eviction
solr.query_result_cache.hits
(gauge)
The number of cache hits per second.
Shown as hit
solr.query_result_cache.inserts
(gauge)
The total number of cache inserts per second.
Shown as set
solr.query_result_cache.lookups
(gauge)
The total number of cache lookups per second.
Shown as get
solr.search_handler.errors
(gauge)
Number of errors per second encountered by the handler.
Shown as error
solr.search_handler.request_times.50percentile
(gauge)
Request processing time in milliseconds (50percentile).
Shown as millisecond
solr.search_handler.request_times.75percentile
(gauge)
Request processing time in milliseconds (75percentile).
Shown as millisecond
solr.search_handler.request_times.95percentile
(gauge)
Request processing time in milliseconds (95percentile).
Shown as millisecond
solr.search_handler.request_times.98percentile
(gauge)
Request processing time in milliseconds (98percentile).
Shown as millisecond
solr.search_handler.request_times.999percentile
(gauge)
Request processing time in milliseconds (999percentile).
Shown as millisecond
solr.search_handler.request_times.99percentile
(gauge)
Request processing time in milliseconds (99percentile).
Shown as millisecond
solr.search_handler.request_times.mean
(gauge)
The average time per request.
Shown as millisecond
solr.search_handler.request_times.mean_rate
(gauge)
Average number of requests received per second since the Solr core was first created.
Shown as request
solr.search_handler.request_times.one_minute_rate
(gauge)
Requests per second received over the past minutes.
Shown as request
solr.search_handler.requests
(gauge)
Number of requests per second processed by the handler.
Shown as request
solr.search_handler.time
(gauge)
The sum of all request processing times (in milliseconds) per second.
solr.search_handler.timeouts
(gauge)
Number of responses per second received with partial results.
Shown as timeout
solr.searcher.maxdocs
(gauge)
One greater than the largest possible document number.
Shown as document
solr.searcher.numdocs
(gauge)
The total number of indexed documents.
Shown as document
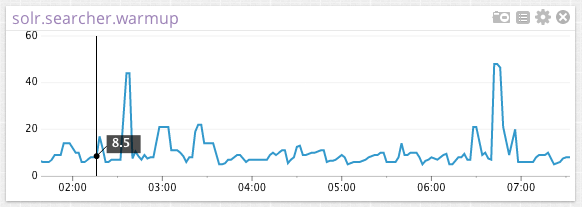
solr.searcher.warmup
(gauge)
The time spent warming up.
Shown as millisecond

イベント

Solr チェックには、イベントは含まれません。

サービスのチェック

solr.can_connect
Agent が監視対象の SolR インスタンスに接続できず、メトリクスを収集できない場合は、CRITICAL を返します。それ以外の場合は、OK を返します。
Statuses: ok, クリティカル

トラブルシューティング

使用可能なメトリクスを表示するコマンド

バージョン 4.1.0 で datadog-agent jmx コマンドが追加されました。

  • 1 つ以上のインスタンス構成に一致する属性をリストする: sudo datadog-agent jmx list matching
  • インスタンス構成の 1 つに一致するが、収集可能なメトリクス数を超えるために収集されない属性をリストする: sudo datadog-agent jmx list limited
  • 現在のインスタンス構成によって収集されると予想される属性をリストします。 sudo datadog-agent jmx list collected
  • どのインスタンス構成にも一致しない属性をリストする: sudo datadog-agent jmx list not-matching
  • JMXFetch でサポートされているタイプのすべての使用可能な属性をリストする: sudo datadog-agent jmx list everything
  • 現在の構成に基づいてメトリクスの収集を開始し、コンソールに表示する: sudo datadog-agent jmx collect

その他の参考資料

文字列値を数値にパースする

jmxfetch が falsetrue といった文字列値のみを返す場合は、それを Datadog のゲージメトリクスに変換して使用できます。たとえば、jmxfetch で次のような値を返すとします。

"myJmxfetch:false" = myJmxfetch:0
"myJmxfetch:true" = myJmxfetch:1

次のように attribute フィルターを使用します。

# ...
attribute:
  myJmxfetch:
    alias: your_metric_name
    metric_type: gauge
    values:
      "false": 0
      "true": 1