このページは日本語には対応しておりません。随時翻訳に取り組んでいます。
翻訳に関してご質問やご意見ございましたら、
お気軽にご連絡ください。
Overview
IDE Shepherd is a real-time security monitoring and protection tool for IDE environments. It monitors extension and workspace task activities in VS Code and Cursor, actively blocking malicious behaviors to protect developer endpoints from supply chain attacks and compromised extensions. IDE Shepherd provides observability into security and extension lifecycle events (installation, updates, and uninstallation), enabling security teams to detect and respond to threats in real-time.
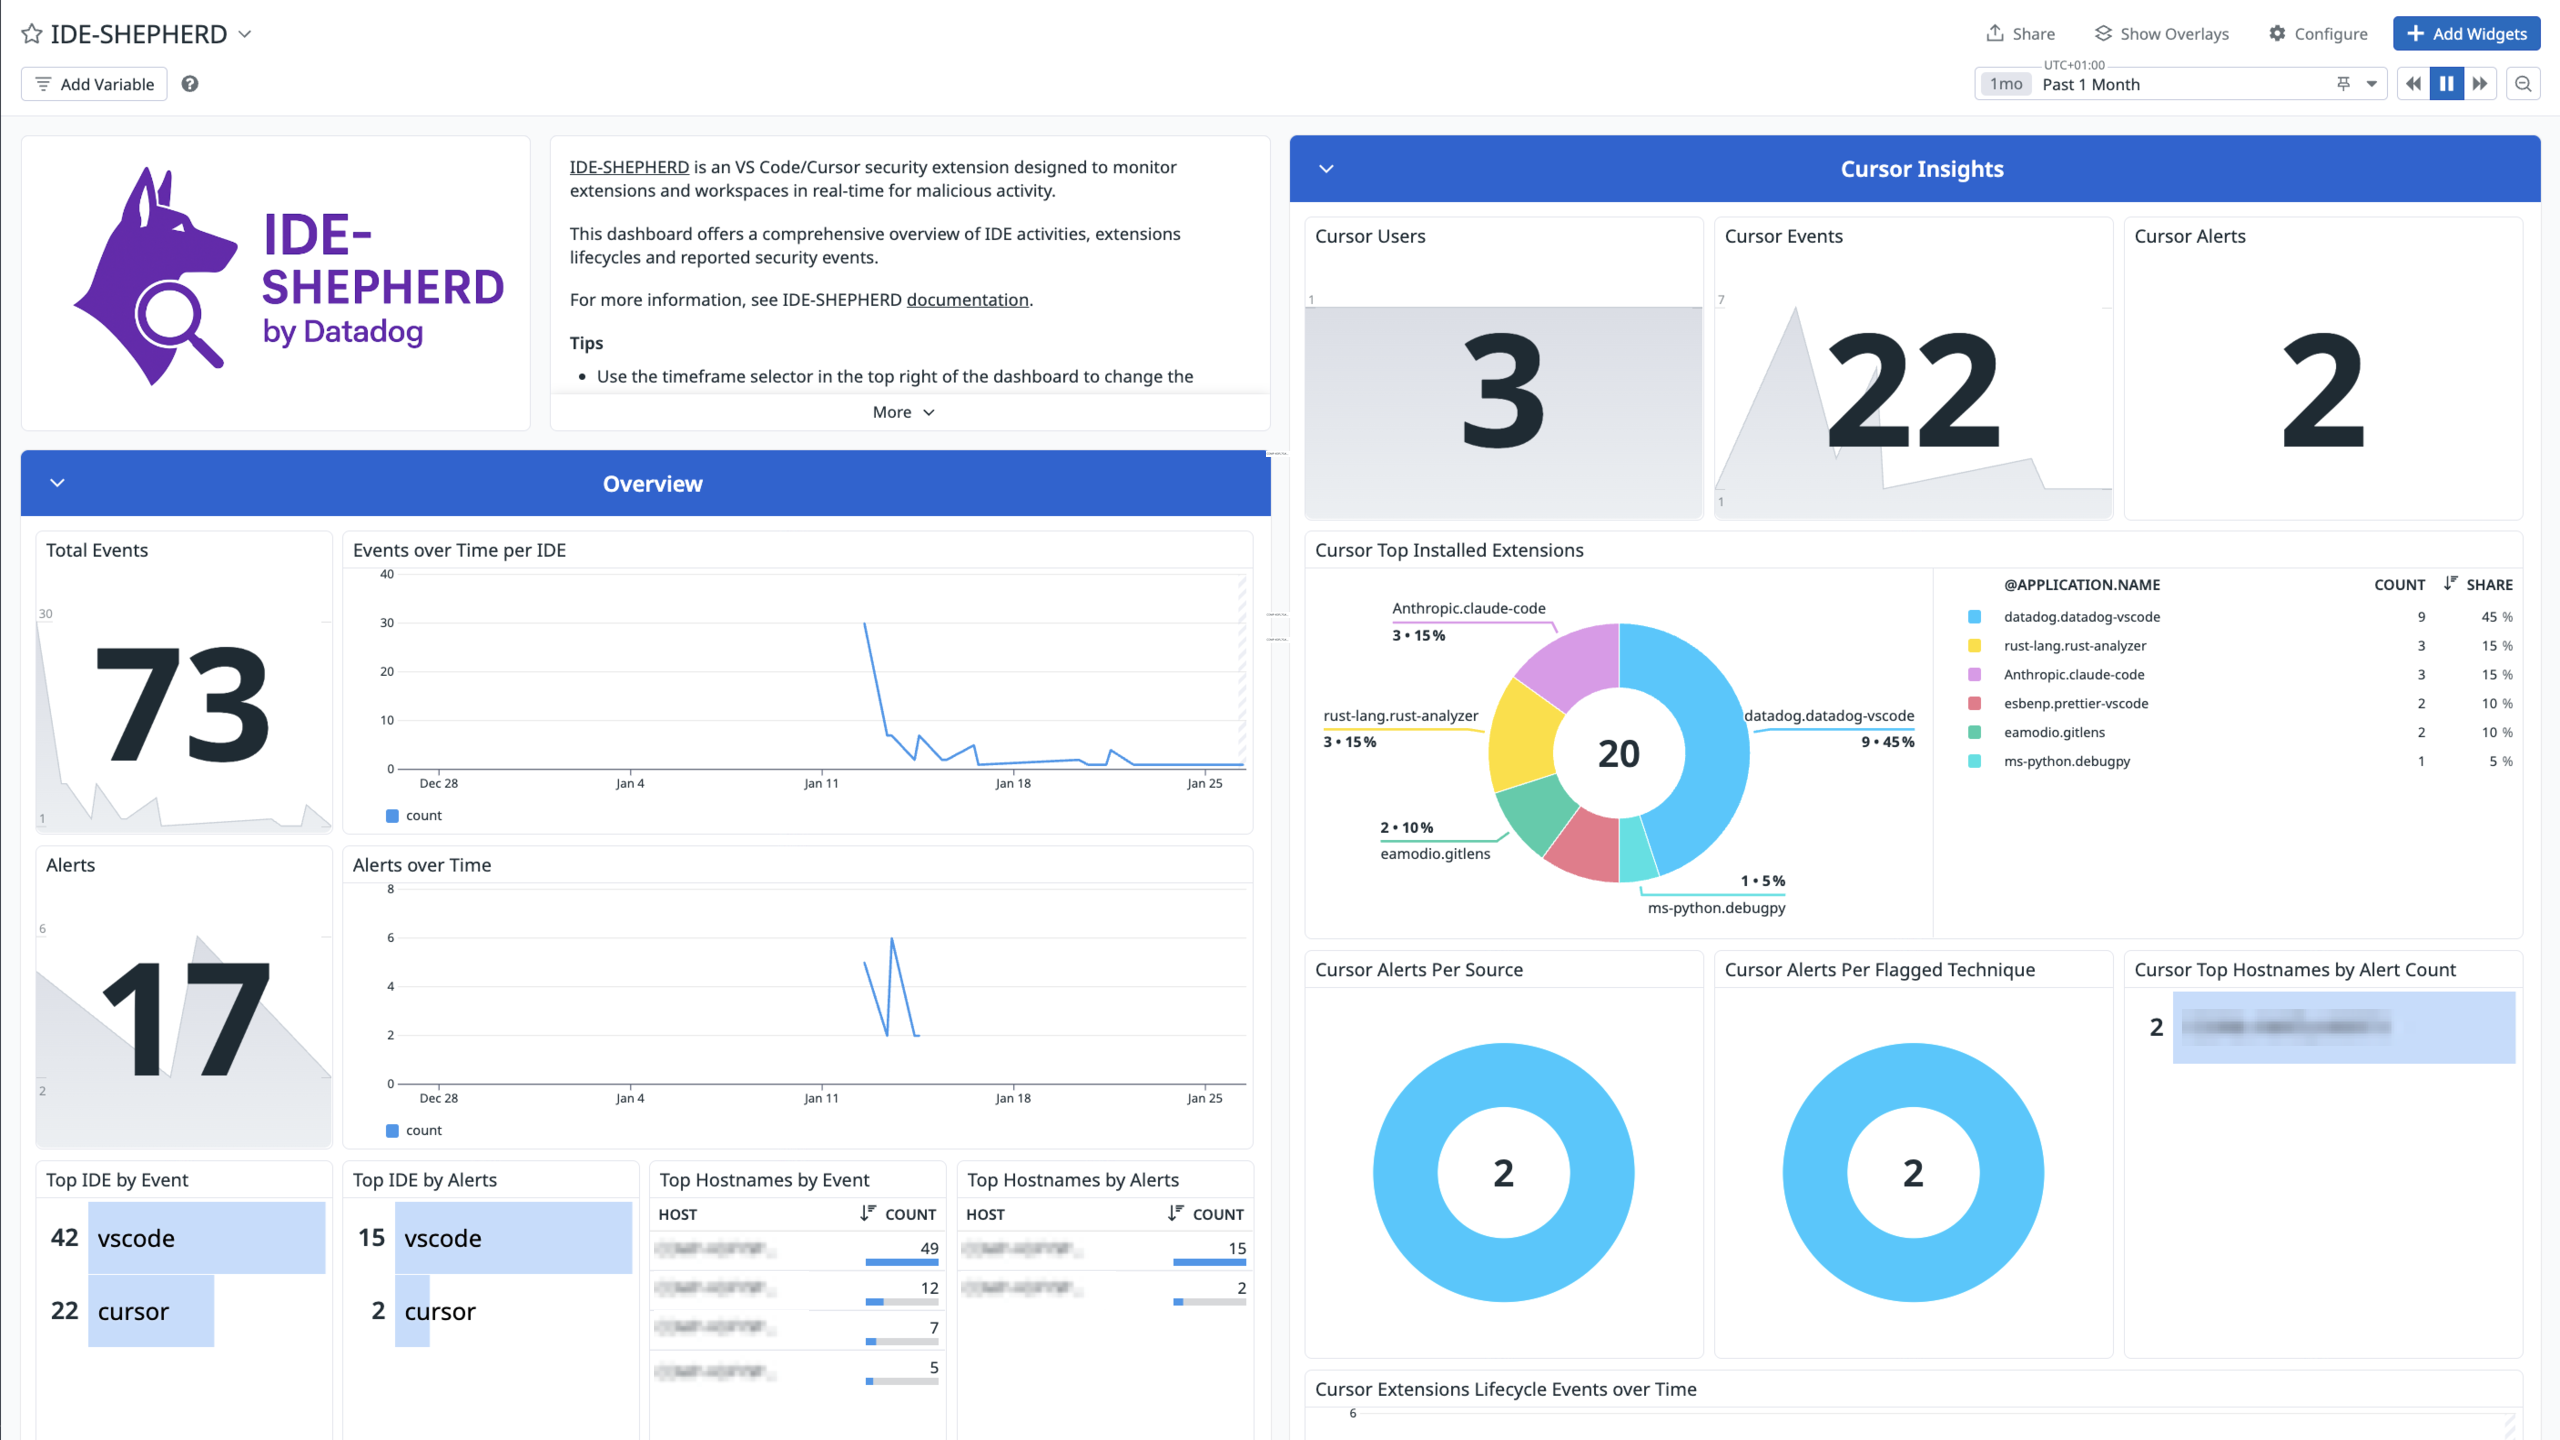
Integrate IDE Shepherd with Datadog’s pre-built dashboard visualizations for insight into security alerts, extension activities, and workspace task monitoring. With Datadog’s built-in log pipelines, you can parse and enrich these logs to facilitate search and detailed insights. The integration includes ready-to-use dashboards for monitoring security events, extension lifecycle, and activity patterns by IDE type and host.
Setup
Configuration
1. Install and start Datadog Agent
First, verify the Datadog Agent is installed and running on your system with your organization API key configured. See Datadog Agent Installation Guide for installation instructions.
2. Install IDE Shepherd extension
Install the IDE Shepherd extension in VS Code or Cursor. See the IDE Shepherd repository for installation instructions.
3. Enable telemetry in IDE Shepherd
IDE Shepherd automatically configures the Datadog Agent when you enable telemetry for the first time:
- Open the IDE Shepherd sidebar in VS Code or Cursor.
- Navigate to Settings > Datadog Telemetry.
- Click on Telemetry: Disabled to enable it.
IDE Shepherd automatically:
- Creates the configuration directory:
/opt/datadog-agent/etc/conf.d/ide-shepherd.d/ - Writes the configuration file:
conf.yaml with the appropriate settings - Configures the agent to listen on the default port
Note: Keep the default port configuration. The extension handles all setup automatically.
4. Restart Datadog Agent
After the automatic configuration, IDE Shepherd requests permission to restart the Datadog Agent. If it fails, restart it manually:
# Linux
sudo systemctl restart datadog-agent

# macOS
launchctl stop com.datadoghq.agent
launchctl start com.datadoghq.agent
See Datadog Agent Commands for more details.
5. Verify Telemetry Status
Telemetry is sent automatically in real-time:
- Extension installed, updated, or uninstalled: OCSF event sent immediately
- Security threat detected: OCSF event sent immediately
You can verify the connection from the IDE Shepherd sidebar:
- Agent Status: Shows if the Datadog Agent is up and running
- Agent Port: Shows the port on which the Agent is listening
Validation
Run the Agent’s status subcommand and look for ide-shepherd under the Logs Agent section. You can also verify in the IDE Shepherd sidebar that the Agent Status shows as connected.
To view your logs in Datadog:
- Go to the Log Explorer
- Filter by
source:ide-shepherd service:ide-shepherd-telemetry - Explore security events, extension lifecycle events, and workspace task activities.
Data Collected
Logs
The IDE Shepherd integration collects and forwards IDE security and activity logs to Datadog, including:
- Security events: Real-time alerts for malicious extension activities and blocked threats
- Extension lifecycle events: Installation, update, and uninstallation events
- Extension Metadata: Name, version, publisher information along with a risk estimate based on predefined heuristics.
- OCSF (Open Cybersecurity Schema Framework) classified events: Standardized security event formats
The logs are automatically enriched with:
- OCSF class UIDs (Application Security Posture Finding, Detection Finding)
- IDE type (VS Code or Cursor) and its version
- Host information
- Security technique information for flagged behaviors
- Observable threat indicators
Metrics
The IDE Shepherd integration does not include any metrics.
Events
The IDE Shepherd integration does not include any events.
Troubleshooting
Need help? Contact Datadog support.