- 重要な情報
- はじめに
- 用語集
- Standard Attributes
- ガイド
- インテグレーション
- エージェント
- OpenTelemetry
- 開発者
- Administrator's Guide
- API
- Partners
- DDSQL Reference
- モバイルアプリケーション
- CoScreen
- CoTerm
- Remote Configuration
- Cloudcraft
- アプリ内
- ダッシュボード
- ノートブック
- DDSQL Editor
- Reference Tables
- Sheets
- Watchdog
- アラート設定
- メトリクス
- Bits AI
- Internal Developer Portal
- Error Tracking
- Change Tracking
- Service Management
- Actions & Remediations
- インフラストラクチャー
- Cloudcraft
- Resource Catalog
- ユニバーサル サービス モニタリング
- Hosts
- コンテナ
- Processes
- サーバーレス
- ネットワークモニタリング
- Cloud Cost
- アプリケーションパフォーマンス
- APM
- Continuous Profiler
- データベース モニタリング
- Data Streams Monitoring
- Data Jobs Monitoring
- Data Observability
- Digital Experience
- RUM & セッションリプレイ
- Synthetic モニタリング
- Continuous Testing
- Product Analytics
- Software Delivery
- CI Visibility (CI/CDの可視化)
- CD Visibility
- Deployment Gates
- Test Visibility
- Code Coverage
- Quality Gates
- DORA Metrics
- Feature Flags
- セキュリティ
- セキュリティの概要
- Cloud SIEM
- Code Security
- クラウド セキュリティ マネジメント
- Application Security Management
- Workload Protection
- Sensitive Data Scanner
- AI Observability
- ログ管理
- Observability Pipelines(観測データの制御)
- ログ管理
- CloudPrem
- 管理
Datadog Cluster Monitoring for VMware Tanzu
このページは日本語には対応しておりません。随時翻訳に取り組んでいます。
翻訳に関してご質問やご意見ございましたら、お気軽にご連絡ください。
翻訳に関してご質問やご意見ございましたら、お気軽にご連絡ください。
Overview
Datadog Cluster Monitoring for VMware Tanzu combines the Datadog Firehose Nozzle with the Datadog Agent, and enables VMware Tanzu users and administrators to monitor the health and performance of their VMware Tanzu clusters. It consists of the following three components:
- The Datadog Firehose Nozzle
- The Datadog Agent
- The Datadog Cluster Agent
The Datadog Firehose Nozzle is a Cloud Foundry component which forwards metrics from the Loggregator Firehose to the Datadog monitoring platform. Any Cloud Foundry deployment can send metrics and events to Datadog. The data helps you track the health and availability of all nodes in your deployment, monitor the jobs they run, collect metrics from the Loggregator Firehose, and more.
Prerequisites
Datadog Cluster Monitoring for VMware Tanzu has the following requirements:
- You must have or create a Datadog account before configuring the tile.
- You must generate a Datadog API key.
Key features
Datadog Cluster Monitoring for VMware Tanzu includes the following key features:
- Visualization of all cluster-level operational metrics and KPIs.
- Alerting on VMware Tanzu cluster and component health.
- Monitoring of jobs.
- Tracking and reporting of BOSH events.
- Autodiscovery of integrations.
Installation
Download the Datadog Cluster Monitoring for VMware Tanzu product file from Pivotal Network.
Go to the Tanzu Ops Manager installation dashboard and click Import a Product to upload the product file.
Click Import a Product to upload the product file.
Select the product file downloaded in step 1. This adds the tile to your staging area.
Click the newly added Datadog Cluster Monitoring for VMware Tanzu tile.
Enter your Datadog API key in the Datadog Config section. Leave the Datadog API URL unchanged, unless directed otherwise by Datadog Support.
Create a UAA client account for Datadog using the UAA CLI. The Firehose Nozzle requires access to the Loggregator Firehose.
$ uaac client add datadog-firehose-nozzle \
     --name datadog-firehose-nozzle \
     --scope doppler.firehose,cloud_controller.admin_read_only,oauth.login \
     --authorities doppler.firehose,cloud_controller.admin_read_only,openid,oauth.approvals \
     --authorized_grant_types client_credentials,refresh_token \
     --access_token_validity 1209600 \
     -s $CLIENT_SECRET
In the Cloud Foundry Settings section, specify a UAA Client and UAA Secret from the previous step.
If Ops Manager requires you to upload a stemcell, download a stemcell from the 621 line of releases. Upload it to Ops Manager with the Import Stemcell button.
The Datadog Firehose Nozzle Config section contains optional configurations for the Nozzle, and the Datadog Agent Config section contains optional configurations for the Agent. You do not need to configure anything in either section.
Note: If you are using a single Datadog account to monitor multiple foundations, you must check the Use UUID Hostname checkbox.
The Datadog Cluster Agent Settings section contains configurations for the Datadog Cluster Agent that provides autodiscovery of integrations and application container features. Enter an Authentication token in the Datadog Cluster Agent Settings, a string of 32 or more characters. This token is shared by both the Cluster Agent and the Datadog Agents to secure communication.
Return to the Tanzu Ops Manager Installation dashboard.
Select all the tiles on which you wish to install the Agent.
Click Apply Changes to install Datadog Cluster Monitoring for the VMware Tanzu tile.
View metrics and dashboards
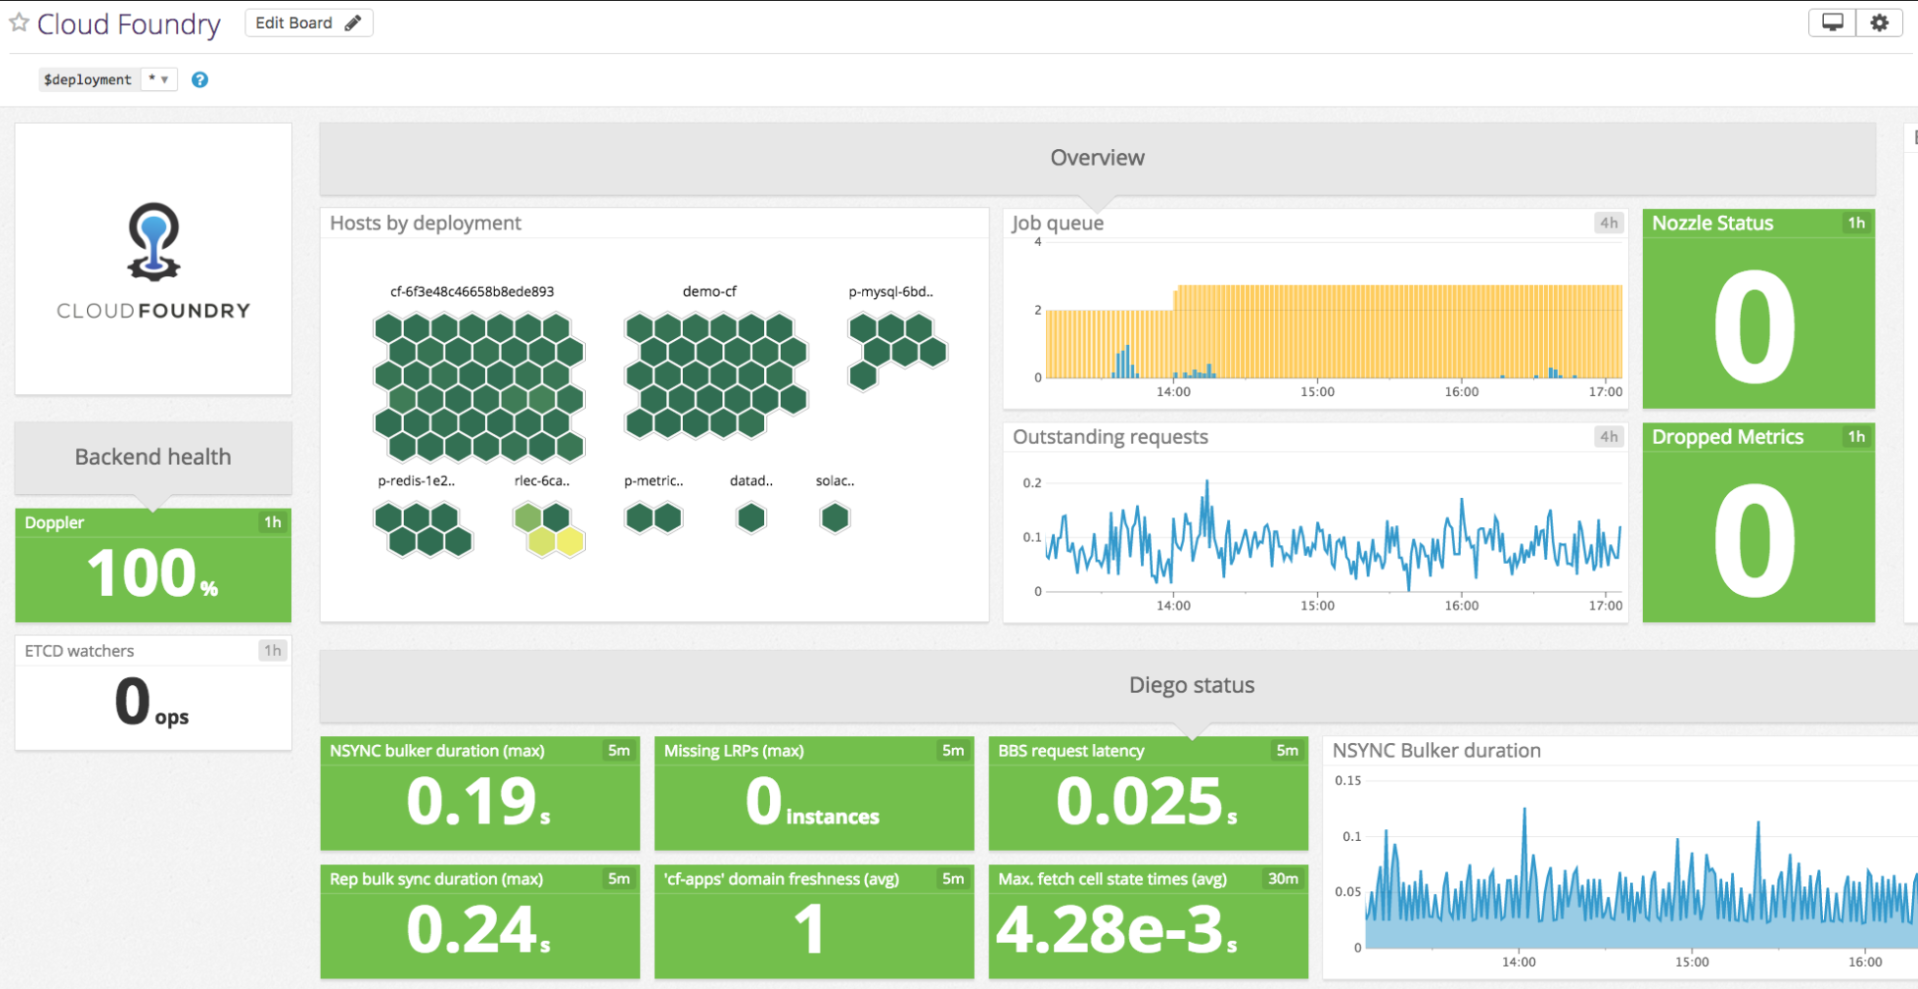
- Review the Cloud Foundry Overview Dashboard.
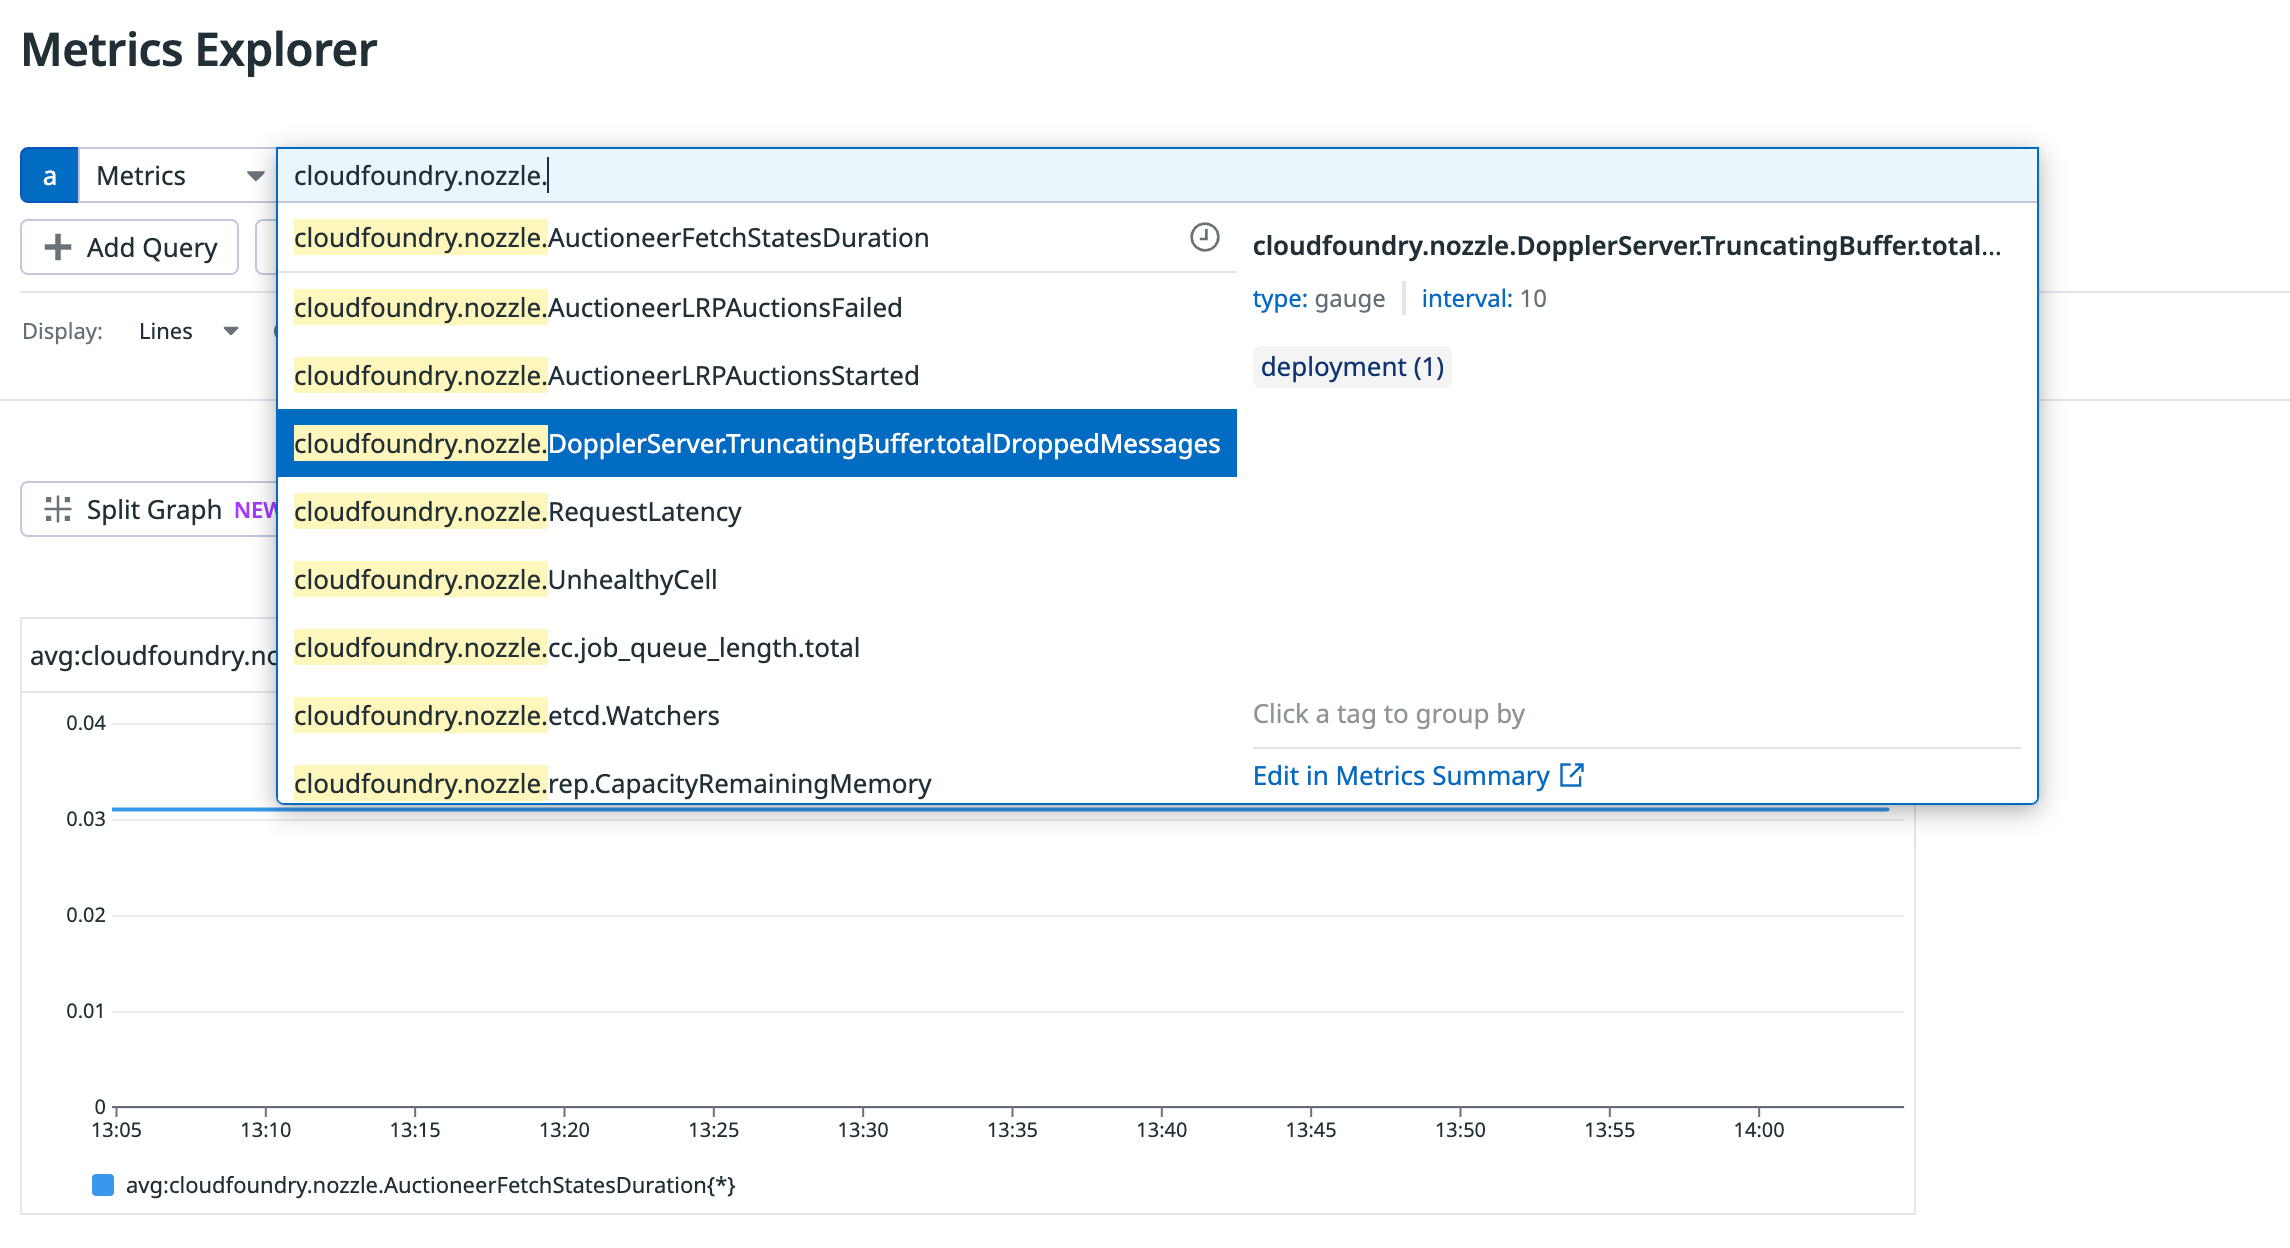
- Explore individual metrics on the Metrics explorer page, search for metrics beginning with
cloudfoundry.nozzle:
- Create alerts for your Cloud Foundry metrics.
- See the Datadog Cloud Foundry Integration for troubleshooting steps.


