- 重要な情報
- はじめに
- 用語集
- ガイド
- エージェント
- インテグレーション
- OpenTelemetry
- 開発者
- API
- CoScreen
- アプリ内
- Service Management
- インフラストラクチャー
- アプリケーションパフォーマンス
- 継続的インテグレーション
- ログ管理
- セキュリティ
- UX モニタリング
- 管理
Cloud Run は、HTTP リクエストを使って呼び出し可能なステートレスコンテナを実行できるマネージド型のコンピューティングプラットフォームです。
このインテグレーションを有効にしてコンテナをインスツルメンテーションすると、Cloud Run のメトリクス、トレース、ログのすべてを Datadog に表示できます。
Cloud Run for Anthos の詳細については、Google Cloud Run for Anthos ドキュメントを参照してください。
Google Cloud Platform インテグレーションをセットアップして、すぐに使えるメトリクスの収集を開始します。カスタムメトリクスを設定するには、Serverless ドキュメントを参照してください。
Google Cloud Run は、監査ログも公開します。 Google Cloud Run のログは、Google Cloud Logging を使用して収集され、HTTP プッシュフォワーダーを使用して Cloud Pub/Sub へ送信されます。Cloud Pub/Sub をまだセットアップしていない場合は、HTTP プッシュフォワーダーを使用してセットアップしてください。
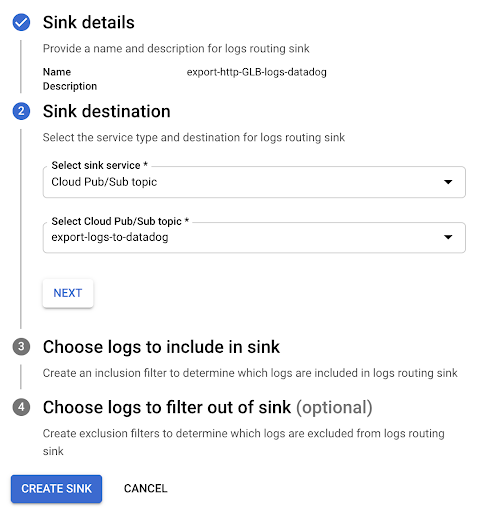
これが完了したら、Google Cloud Run のログを Google Cloud Logging から Pub/Sub へエクスポートします。
Google Cloud Logging のページに移動し、Google Cloud Run のログを絞り込みます。
シンクを作成し、シンクに適宜名前を付けます。
エクスポート先として「Cloud Pub/Sub」を選択し、エクスポート用に作成された Pub/Sub を選択します。注: この Pub/Sub は別のプロジェクト内に配置することもできます。
作成をクリックし、確認メッセージが表示されるまで待ちます。
Cloud Run サービスから Datadog へのアプリケーションの直接ロギングについては、Serverless ドキュメントを参照してください。
フルマネージド Google Cloud Run に特化した Agent の設定手順については、Serverless ドキュメントを参照してください。
gcp.run.container.billable_instance_time (rate) | Billable time aggregated from all container instances of the revision (ms/s). Shown as millisecond |
gcp.run.container.cpu.allocation_time (rate) | Container CPU allocation of the revision in seconds. Shown as core |
gcp.run.container.cpu.utilizations.avg (gauge) | The average distribution of container CPU utilization distribution across all container instances of the revision. Shown as fraction |
gcp.run.container.cpu.utilizations.p95 (gauge) | The 95th percentile distribution of container CPU utilization distribution across all container instances of the revision. Shown as fraction |
gcp.run.container.cpu.utilizations.p99 (gauge) | The 99th percentile distribution of container CPU utilization distribution across all container instances of the revision. Shown as fraction |
gcp.run.container.cpu.utilizations.samplecount (count) | Sample count of the distribution of service request times in milliseconds. Shown as fraction |
gcp.run.container.instance_count (gauge) | The number of container instances that exist, broken down by state. Shown as container |
gcp.run.container.max_request_concurrencies.avg (gauge) | Average of the maximum number of concurrent requests being served by each container instance over a minute. Shown as request |
gcp.run.container.max_request_concurrencies.p95 (gauge) | 95th percentile distribution of the maximum number of concurrent requests being served by each container instance over a minute. Shown as request |
gcp.run.container.max_request_concurrencies.p99 (gauge) | 99th percentile distribution of the maximum number of concurrent requests being served by each container instance over a minute. Shown as request |
gcp.run.container.max_request_concurrencies.samplecount (count) | Sample count of the distribution of the maximum number of concurrent requests being served by each container instance over a minute. Shown as request |
gcp.run.container.memory.allocation_time (rate) | Container memory allocation of the revision in Gigabytes-seconds. Shown as gibibyte |
gcp.run.container.memory.utilizations.avg (gauge) | Average of the container memory utilization distribution across all container instances of the revision. Shown as fraction |
gcp.run.container.memory.utilizations.p95 (gauge) | 95th percentile distribution of the container memory utilization distribution across all container instances of the revision. Shown as fraction |
gcp.run.container.memory.utilizations.p99 (gauge) | 99th percentile distribution of the container memory utilization distribution across all container instances of the revision. Shown as fraction |
gcp.run.container.memory.utilizations.samplecount (count) | Sample count of the container memory utilization distribution across all container instances of the revision. Shown as fraction |
gcp.run.container.network.received_bytes_count (count) | The incoming socket and HTTP response traffic of revision, in bytes. Shown as byte |
gcp.run.container.network.sent_bytes_count (count) | The outgoing socket and HTTP response traffic of revision, in bytes. Shown as byte |
gcp.run.request_count (count) | The number of service requests. Shown as request |
gcp.run.request_latencies.avg (gauge) | Average distribution of service request times in milliseconds. Shown as millisecond |
gcp.run.request_latencies.p95 (gauge) | The 95th percentile distribution of service request times in milliseconds. Shown as millisecond |
gcp.run.request_latencies.p99 (gauge) | The 99th percentile distribution of service request times in milliseconds. Shown as millisecond |
gcp.run.request_latencies.samplecount (count) | Sample count of the distribution of service request times in milliseconds. Shown as millisecond |
gcp.run.request_latencies.sumsqdev (gauge) | Sum of squared deviation of the distribution of service request times in milliseconds. Shown as millisecond |
Google Cloud Functions インテグレーションには、イベントは含まれません。
Google Cloud Functions インテグレーションには、サービスのチェック機能は含まれません。
ご不明な点は、Datadog のサポートチームまでお問合せください。
お役に立つドキュメント、リンクや記事: