Supported OS
![Linux]()
![Mac OS]()
概要
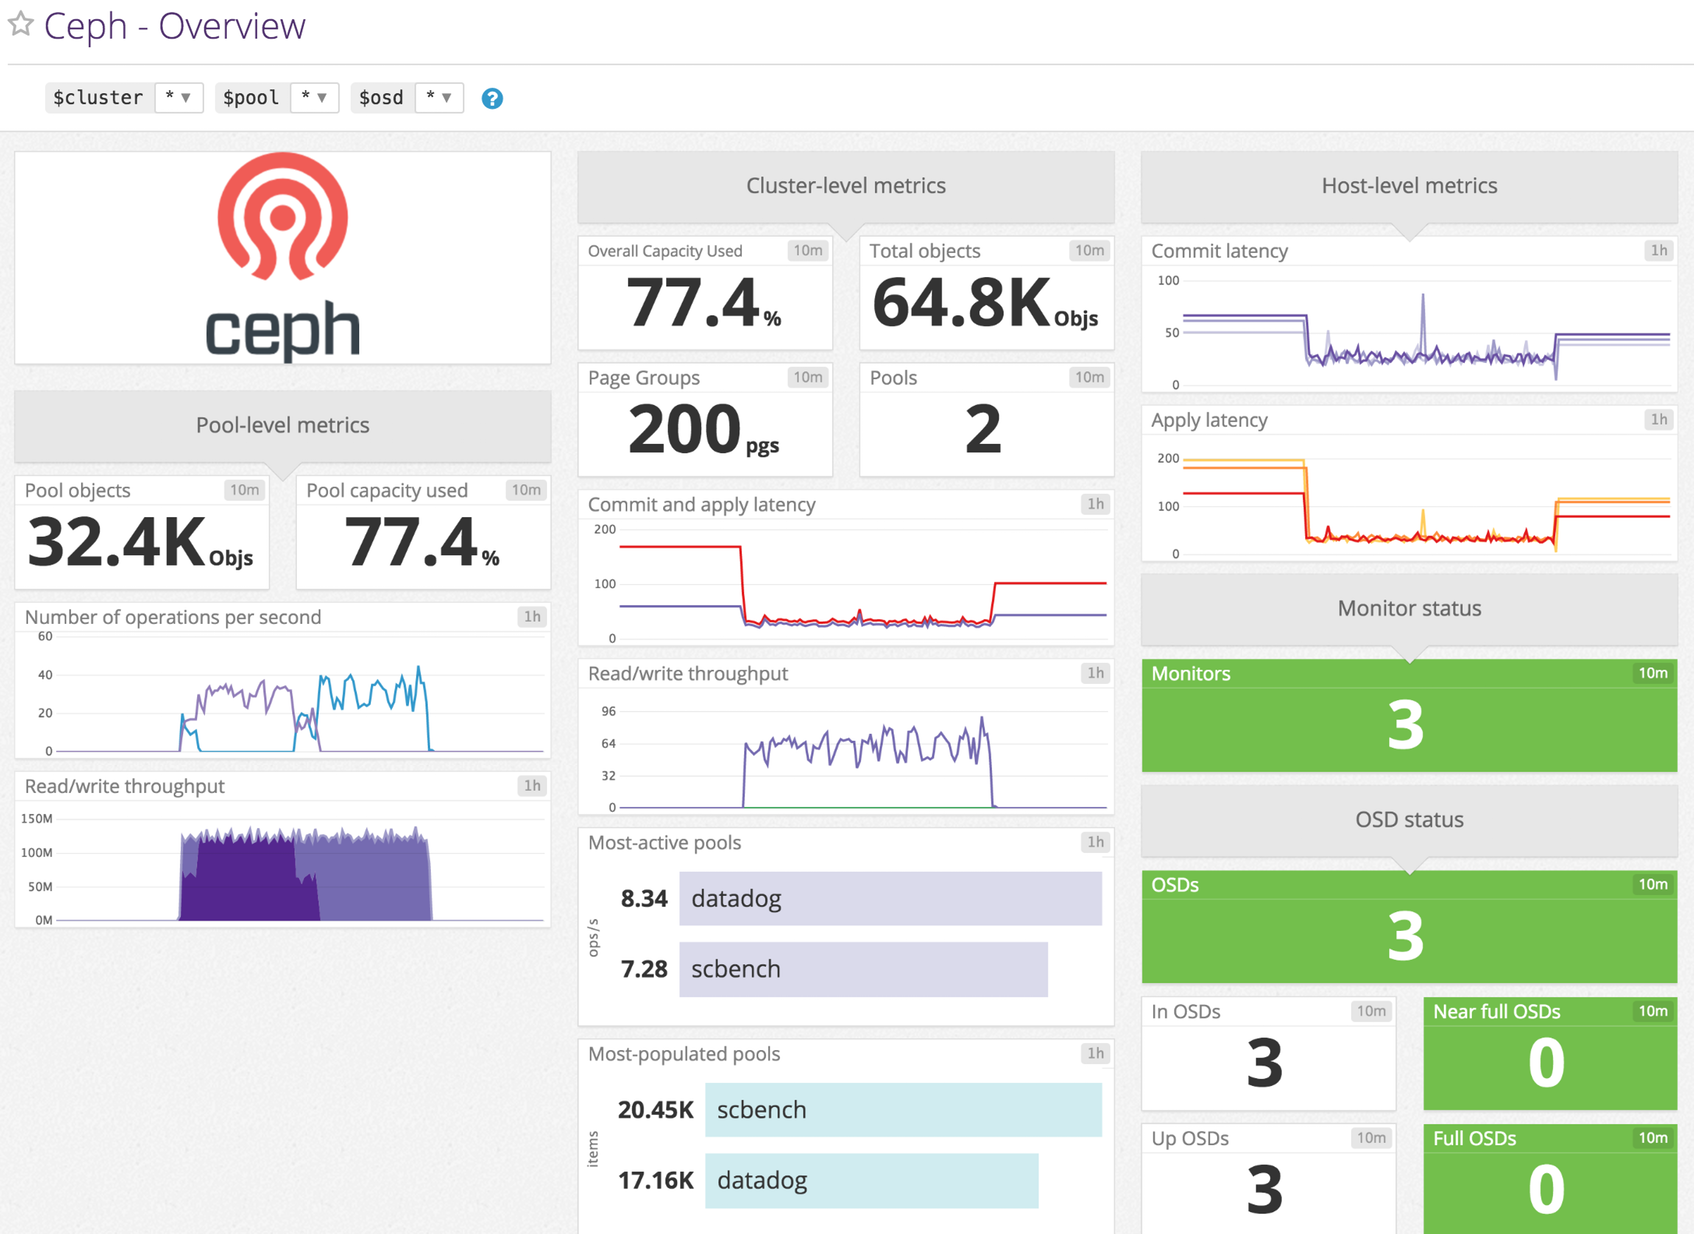
Datadog-Ceph インテグレーションを有効にすると、以下のことができます。
- ストレージプール全体のディスク使用状況を追跡できます。
- 問題が発生した場合にサービスチェックを受信できます。
- I/O パフォーマンスメトリクスを監視できます。
セットアップ
インストール
Ceph チェックは Datadog Agent パッケージに含まれています。Ceph サーバーに追加でインストールする必要はありません。
構成
Agent のコンフィギュレーションディレクトリのルートにある conf.d/ フォルダーの ceph.d/conf.yaml ファイルを編集します。
使用可能なすべてのコンフィギュレーションオプションの詳細については、サンプル ceph.d/conf.yaml を参照してください。
init_config:

instances:
  - ceph_cmd: /path/to/your/ceph # default is /usr/bin/ceph
    use_sudo: true # ご利用のノードで ceph バイナリが sudo を必要とする場合のみ
use_sudo を有効にした場合は、sudoers ファイルに以下のような行を追加します。
dd-agent ALL=(ALL) NOPASSWD:/path/to/your/ceph
ログ収集
Agent バージョン 6.0 以降で利用可能
Datadog Agent で、ログの収集はデフォルトで無効になっています。以下のように、datadog.yaml ファイルでこれを有効にします。
次に、下部にある logs 行のコメントを解除して、ceph.d/conf.yaml を編集します。ログの path を Ceph ログファイルの正しいパスで更新してください。
logs:
  - type: file
    path: /var/log/ceph/*.log
    source: ceph
    service: "<APPLICATION_NAME>"
Agent を再起動します。
検証
Agent の status サブコマンドを実行し、Checks セクションで ceph を探します。
収集データ
メトリクス
| |
|---|
ceph.aggregate_pct_used
(gauge) | Overall capacity usage metric
Shown as percent |
ceph.apply_latency_ms
(gauge) | Time taken to flush an update to disks
Shown as millisecond |
ceph.class_pct_used
(gauge) | Per-class percentage of raw storage used
Shown as percent |
ceph.commit_latency_ms
(gauge) | Time taken to commit an operation to the journal
Shown as millisecond |
ceph.misplaced_objects
(gauge) | Number of objects misplaced
Shown as item |
ceph.misplaced_total
(gauge) | Total number of objects if there are misplaced objects
Shown as item |
ceph.num_full_osds
(gauge) | Number of full osds
Shown as item |
ceph.num_in_osds
(gauge) | Number of participating storage daemons
Shown as item |
ceph.num_mons
(gauge) | Number of monitor daemons
Shown as item |
ceph.num_near_full_osds
(gauge) | Number of nearly full osds
Shown as item |
ceph.num_objects
(gauge) | Object count for a given pool
Shown as item |
ceph.num_osds
(gauge) | Number of known storage daemons
Shown as item |
ceph.num_pgs
(gauge) | Number of placement groups available
Shown as item |
ceph.num_pools
(gauge) | Number of pools
Shown as item |
ceph.num_up_osds
(gauge) | Number of online storage daemons
Shown as item |
ceph.op_per_sec
(gauge) | IO operations per second for given pool
Shown as operation |
ceph.osd.pct_used
(gauge) | Percentage used of full/near full osds
Shown as percent |
ceph.pgstate.active_clean
(gauge) | Number of active+clean placement groups
Shown as item |
ceph.read_bytes
(gauge) | Per-pool read bytes
Shown as byte |
ceph.read_bytes_sec
(gauge) | Bytes/second being read
Shown as byte |
ceph.read_op_per_sec
(gauge) | Per-pool read operations/second
Shown as operation |
ceph.recovery_bytes_per_sec
(gauge) | Rate of recovered bytes
Shown as byte |
ceph.recovery_keys_per_sec
(gauge) | Rate of recovered keys
Shown as item |
ceph.recovery_objects_per_sec
(gauge) | Rate of recovered objects
Shown as item |
ceph.total_objects
(gauge) | Object count from the underlying object store. [v<=3 only]
Shown as item |
ceph.write_bytes
(gauge) | Per-pool write bytes
Shown as byte |
ceph.write_bytes_sec
(gauge) | Bytes/second being written
Shown as byte |
ceph.write_op_per_sec
(gauge) | Per-pool write operations/second
Shown as operation |
Note: If you are running Ceph luminous or later, the ceph.osd.pct_used metric is not included.
注: Ceph luminous またはそれ以降を実行している場合、ceph.osd.pct_used メトリクスは含まれません。
イベント
Ceph チェックには、イベントは含まれません。
サービスチェック
ceph.overall_status
Returns OK if your ceph cluster status is HEALTH_OK, WARNING if it’s HEALTH_WARNING, CRITICAL otherwise.
Statuses: ok, warning, critical
ceph.osd_down
Returns OK if you have no down OSD. Otherwise, returns WARNING if the severity is HEALTH_WARN, else CRITICAL.
Statuses: ok, warning, critical
ceph.osd_orphan
Returns OK if you have no orphan OSD. Otherwise, returns WARNING if the severity is HEALTH_WARN, else CRITICAL.
Statuses: ok, warning, critical
ceph.osd_full
Returns OK if your OSDs are not full. Otherwise, returns WARNING if the severity is HEALTH_WARN, else CRITICAL.
Statuses: ok, warning, critical
ceph.osd_nearfull
Returns OK if your OSDs are not near full. Otherwise, returns WARNING if the severity is HEALTH_WARN, else CRITICAL.
Statuses: ok, warning, critical
ceph.pool_full
Returns OK if your pools have not reached their quota. Otherwise, returns WARNING if the severity is HEALTH_WARN, else CRITICAL.
Statuses: ok, warning, critical
ceph.pool_near_full
Returns OK if your pools are not near reaching their quota. Otherwise, returns WARNING if the severity is HEALTH_WARN, else CRITICAL.
Statuses: ok, warning, critical
ceph.pg_availability
Returns OK if there is full data availability. Otherwise, returns WARNING if the severity is HEALTH_WARN, else CRITICAL.
Statuses: ok, warning, critical
ceph.pg_degraded
Returns OK if there is full data redundancy. Otherwise, returns WARNING if the severity is HEALTH_WARN, else CRITICAL.
Statuses: ok, warning, critical
ceph.pg_degraded_full
Returns OK if there is enough space in the cluster for data redundancy. Otherwise, returns WARNING if the severity is HEALTH_WARN, else CRITICAL.
Statuses: ok, warning, critical
ceph.pg_damaged
Returns OK if there are no inconsistencies after data scrubing. Otherwise, returns WARNING if the severity is HEALTH_WARN, else CRITICAL.
Statuses: ok, warning, critical
ceph.pg_not_scrubbed
Returns OK if the PGs were scrubbed recently. Otherwise, returns WARNING if the severity is HEALTH_WARN, else CRITICAL.
Statuses: ok, warning, critical
ceph.pg_not_deep_scrubbed
Returns OK if the PGs were deep scrubbed recently. Otherwise, returns WARNING if the severity is HEALTH_WARN, else CRITICAL.
Statuses: ok, warning, critical
ceph.cache_pool_near_full
Returns OK if the cache pools are not near full. Otherwise, returns WARNING if the severity is HEALTH_WARN, else CRITICAL.
Statuses: ok, warning, critical
ceph.too_few_pgs
Returns OK if the number of PGs is above the min threshold. Otherwise, returns WARNING if the severity is HEALTH_WARN, else CRITICAL.
Statuses: ok, warning, critical
ceph.too_many_pgs
Returns OK if the number of PGs is below the max threshold. Otherwise, returns WARNING if the severity is HEALTH_WARN, else CRITICAL.
Statuses: ok, warning, critical
ceph.object_unfound
Returns OK if all objects can be found. Otherwise, returns WARNING if the severity is HEALTH_WARN, else CRITICAL.
Statuses: ok, warning, critical
ceph.request_slow
Returns OK requests are taking a normal time to process. Otherwise, returns WARNING if the severity is HEALTH_WARN, else CRITICAL.
Statuses: ok, warning, critical
ceph.request_stuck
Returns OK requests are taking a normal time to process. Otherwise, returns WARNING if the severity is HEALTH_WARN, else CRITICAL.
Statuses: ok, warning, critical
トラブルシューティング
ご不明な点は、Datadog のサポートチームまでお問い合わせください。
その他の参考資料